AWS HPC Blog
Optimizing undersea cables: how Orsted and AWS modeled seabed thermal properties
 This post was contributed by Ross Pivovar, Rafał Ołdziejewski, Cindy Xin Qi Lee
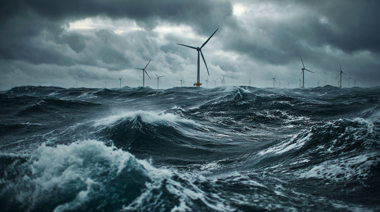
Offshore wind farms play a critical role in the global transition to renewable energy and clean power generation. But generating electricity is only half the battle—safely and efficiently transporting that power to the grid through undersea cables is equally important.
Today, we’ll explore how Ørsted, a global leader in offshore wind energy, partnered with AWS to develop a proof-of-concept for a complex thermal modeling challenge for their submarine cables, enabling more efficient operations and potentially extending cable lifespan.
In this post, we describe a proof-of-concept project. The solutions, methodologies, and products mentioned haven’t yet been vetted for general use in Ørsted, so they represent prototype work rather than production systems.
Background: why cable thermal modeling matters
Undersea cables (Figure 1) are the unsung heroes of offshore wind energy. These complex structures carry electricity from offshore wind turbines to onshore substations, ultimately connecting to the power grid. For companies like Ørsted, optimizing cable performance is critical for several reasons:
- High stakes failures: Undersea cables are extremely expensive and difficult to repair when they fail. Their immense size and weight make transportation challenging, and installation requires specialized vessels, specific weather windows, and highly trained personnel.
- Cost-revenue balance: If cables aren’t utilized to their full capacity, valuable revenue is lost. Conversely, if pushed beyond safe limits, they risk premature failure.
- Project viability: For newer, larger wind farms, cable capacity can be the difference between a project being financially viable or not.
The goal with thermal cable models is to optimize the use of cables—from early development to operation.
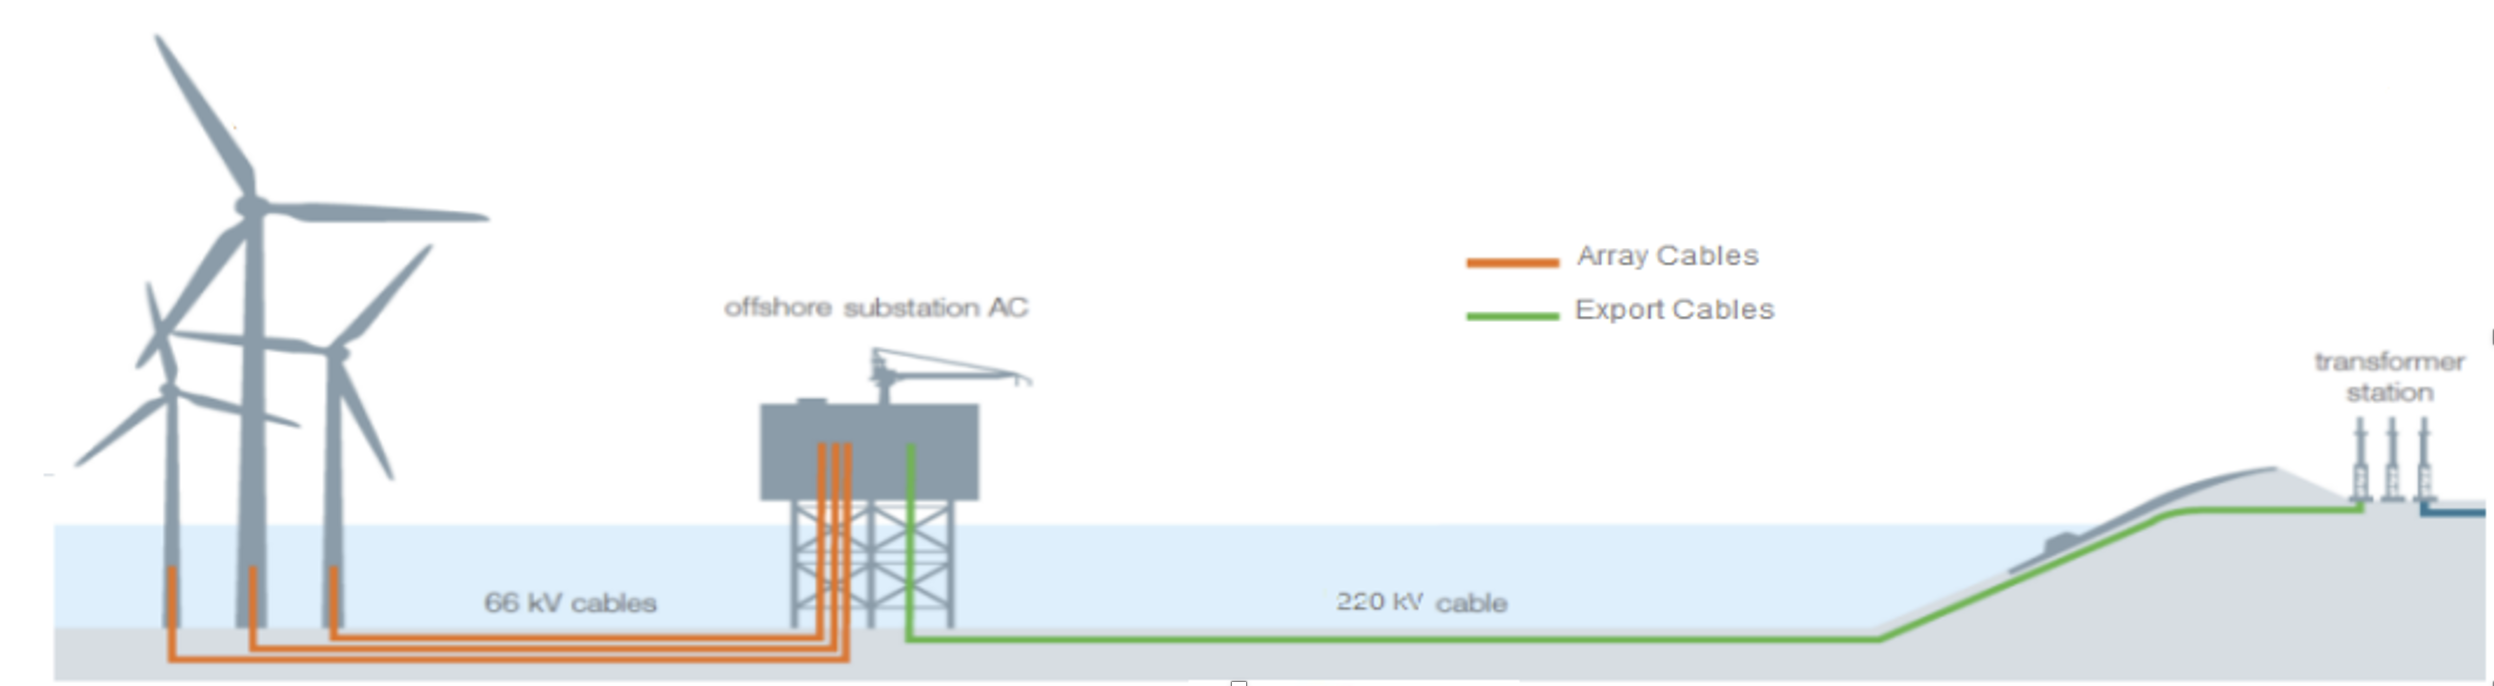
Figure 1 The diagram shows offshore wind turbines connected to an offshore substation via orange “Array Cables” (66 kV), with electricity then transmitted to shore through a green “Export Cable” (220 kV) to a transformer station. This illustration demonstrates how wind-generated electricity is collected, voltage-converted at sea, and efficiently transmitted to land for distribution.
The TEEM model: predicting cable temperature
To manage their cable infrastructure, Ørsted developed a thermal model using a technique called TEEM (Thermal Electrical Equivalent Model [1]). This method transforms the complex 3D heat transfer problem of an undersea cable (Figure 2) into a simplified but accurate electrical equivalent model (Figure 3).
TEEM treats the cable as a series of cylindrical layers, each with specific thermal properties.
- Heat generation is represented by current sources
- Heat transfer resistance is represented by electrical resistors
- Heat storage capacity is represented by capacitors
This approach allows Ørsted to predict cable temperatures based on electrical current, cable design specifications, and installation conditions. The model’s key task is to determine if, for a given set of thermal conditions, the cable’s maximum safe operating temperature of 90°C is exceeded. If this threshold is exceeded the insulation begins to degrade, potentially leading to failure.
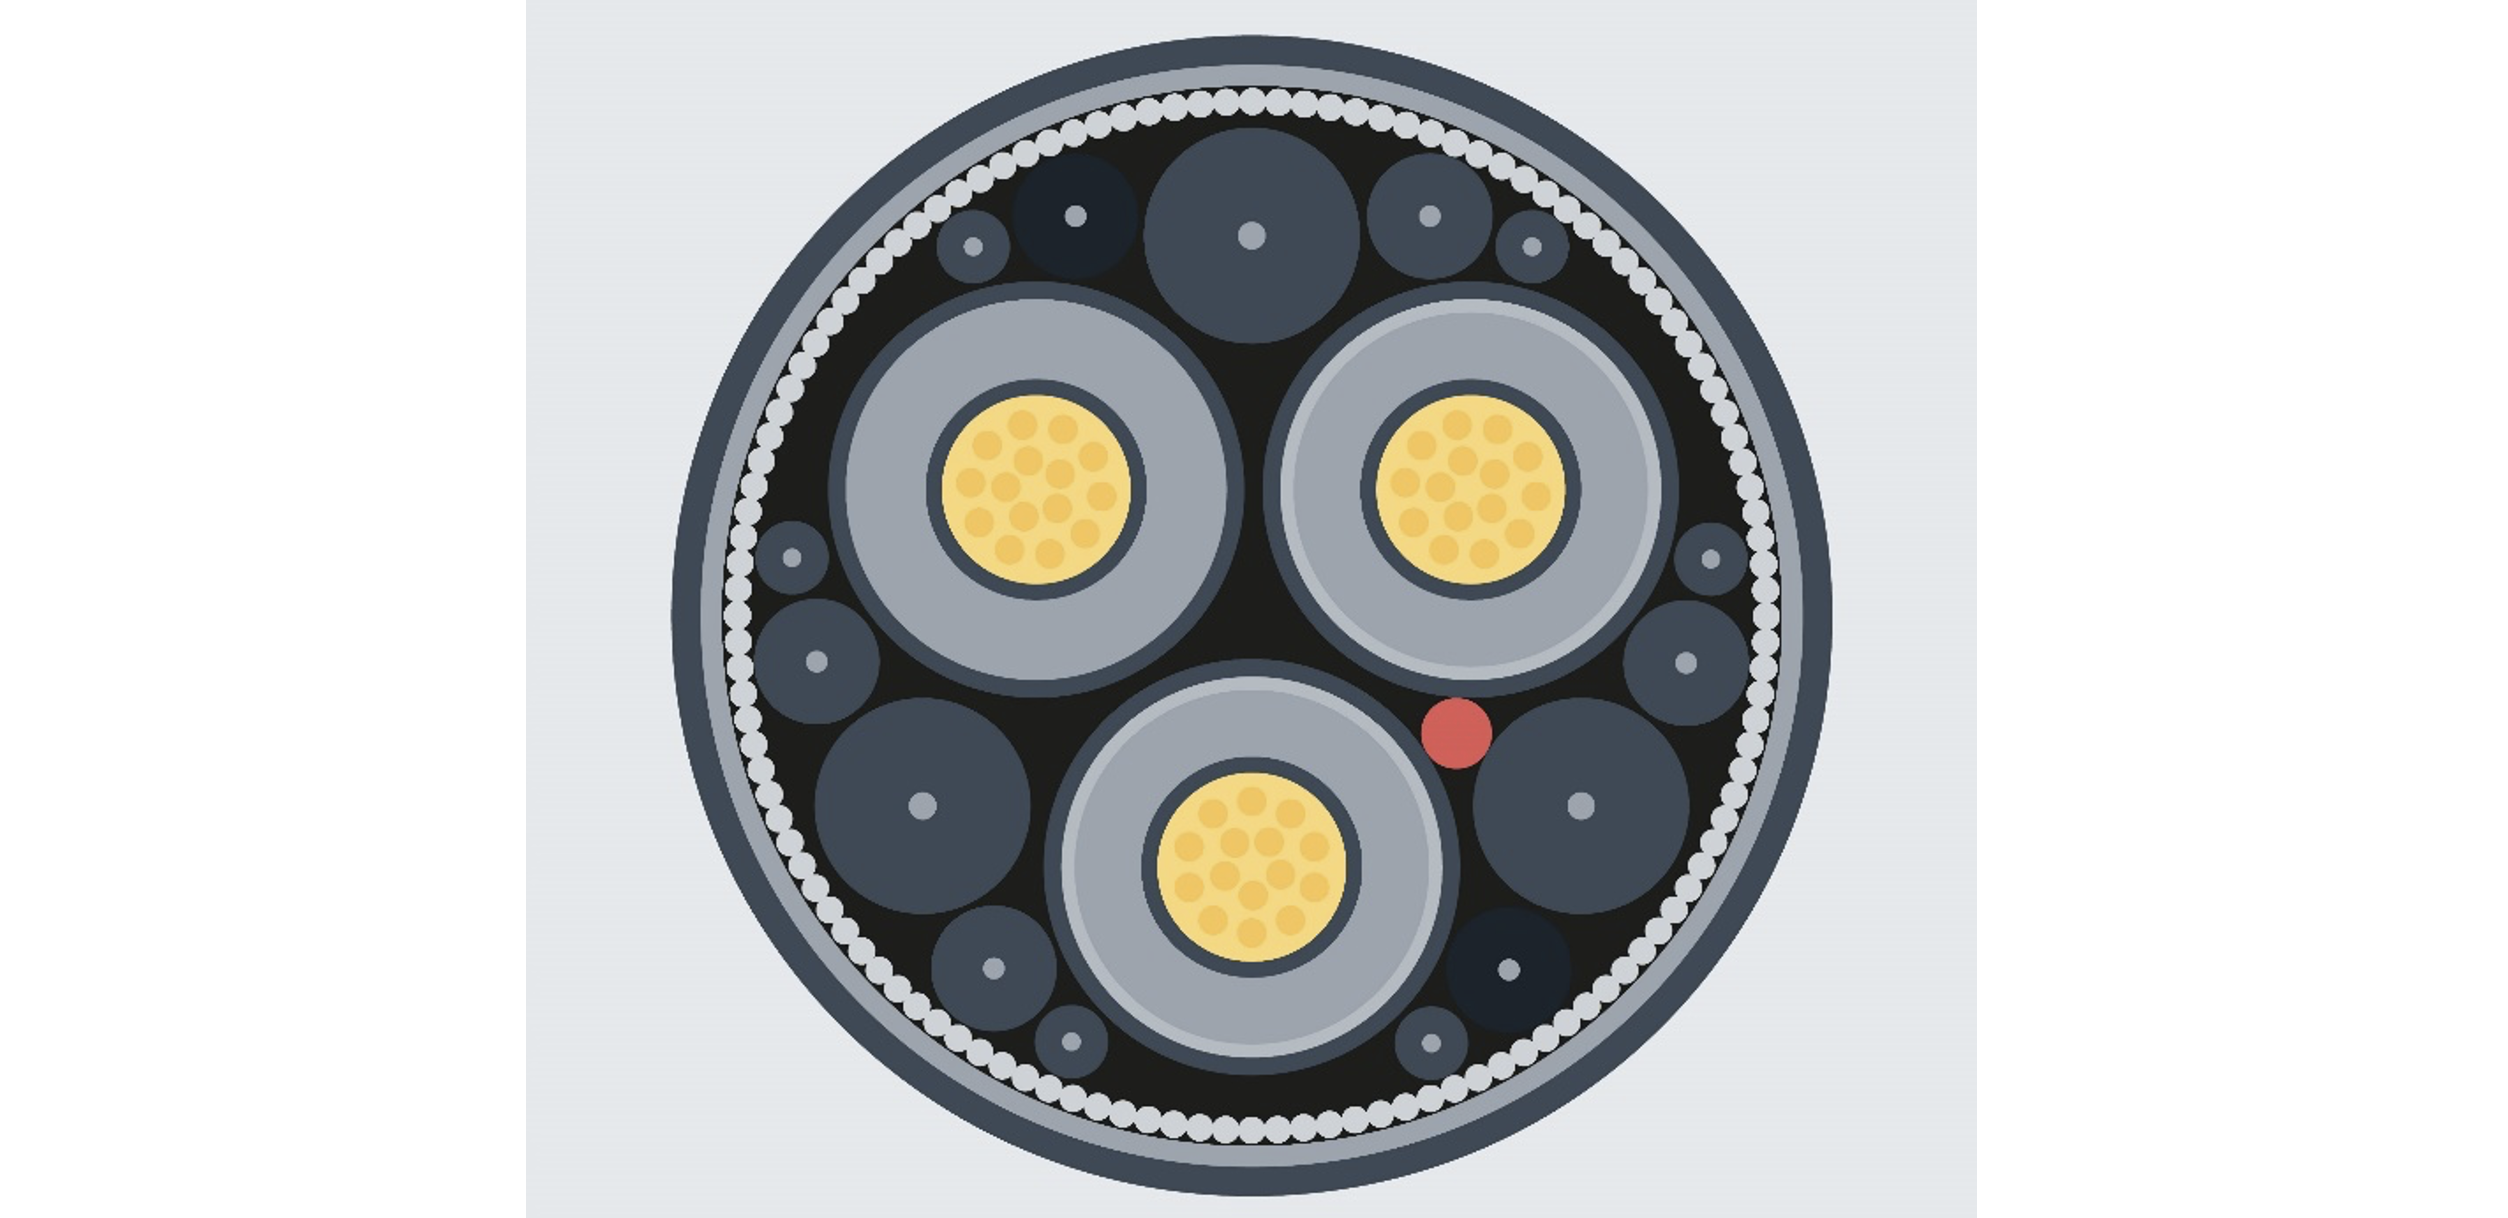
Figure 2 2D cross-sectional view of a subsea power cable showing its layered construction with multiple protective layers and three cylindrical cores visible in the cross section.
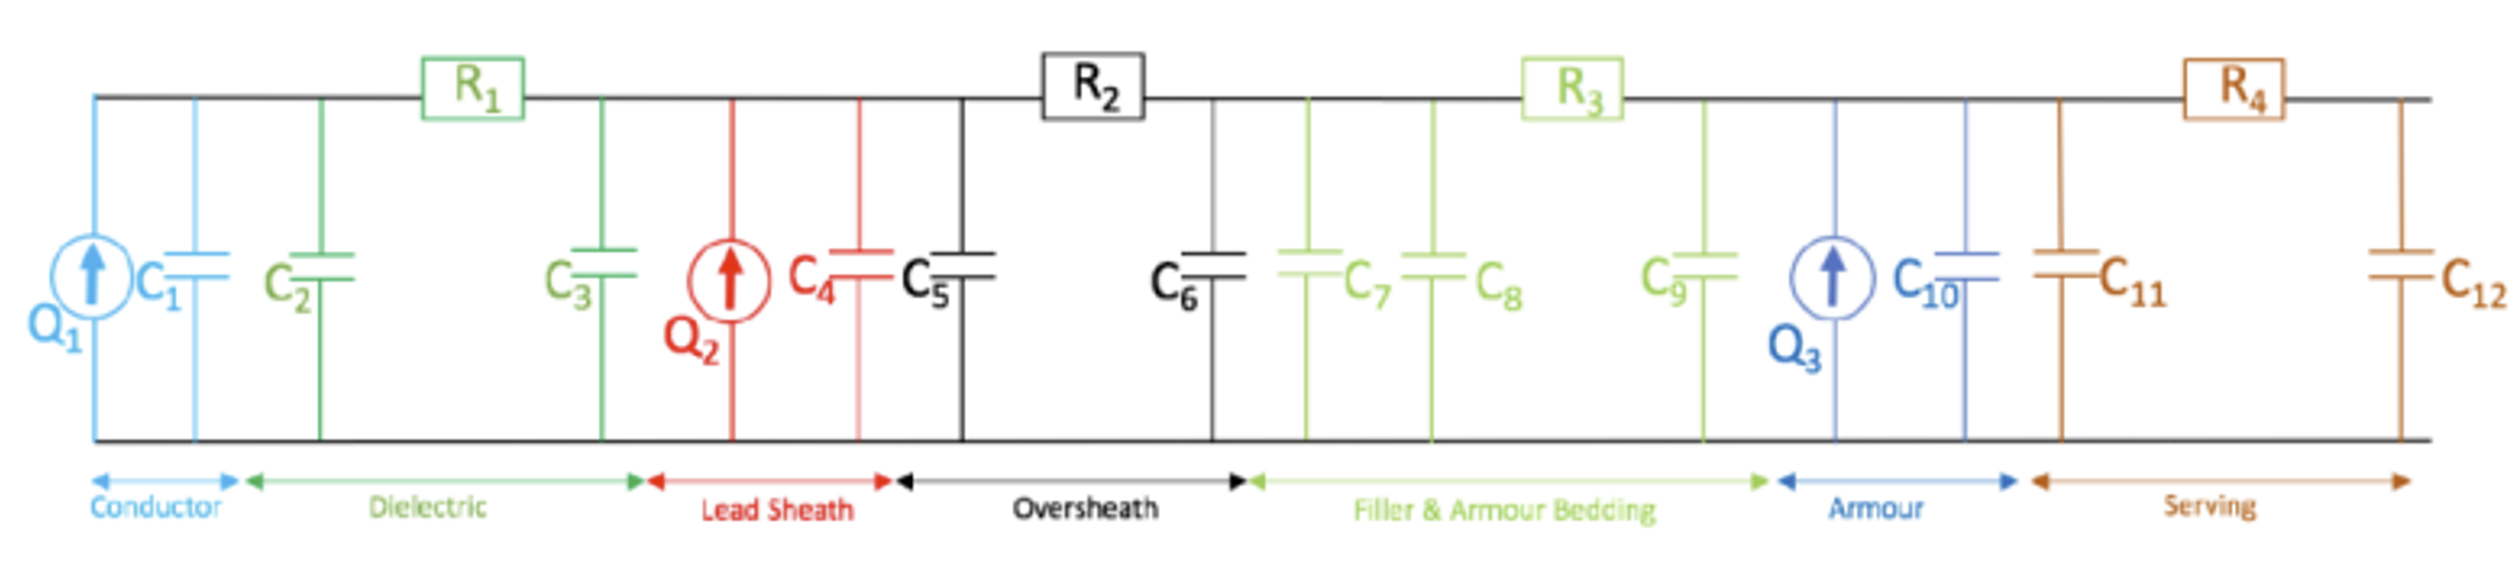
Figure 3 The image displays a detailed electrical circuit diagram representing the thermal modeling of a cable system, with resistors (R1-R4) arranged in series along the top and multiple capacitors (C1-C12) connected below. Color-coded sections indicate different components of the cable structure including conductor (blue), dielectric (green), lead sheath (red), oversheath (black), filler & armour bedding (light green), armour (blue), and serving (orange), demonstrating how heat transfer in cables can be analyzed using electrical circuit analogies.
The challenge: unknown seabed properties
While Ørsted had extensive knowledge about their cable designs and materials, they faced an important challenge regarding the thermal properties of the seabed materials surrounding their cables. These properties, such as thermal resistivity and heat capacity, directly impact how efficiently heat dissipates from the cable into the surrounding environment.
The uncertainty stemmed from limited and coarse-grained measurements taken during the design phase, combined with the fact that these properties may change over time. This created an input-data uncertainty constraint in their thermal models. Without more accurate and localized values for seabed thermal properties, temperature predictions contained margins of uncertainty, potentially leading to either:
- Overly conservative operation—sacrificing power capacity and revenue
- Excessive risk of overheating—jeopardizing expensive infrastructure
The challenge was clear: how could Ørsted improve the accuracy of thermal property measurements for seabed materials at specific locations along their vast submarine cable network, accounting for both spatial variation and temporal changes?
The solution: combining IoT data with physics-based simulation
To solve their undersea cable thermal modeling problem, Ørsted partnered with AWS to develop a solution combining real-world measurements with computational optimization. Here’s how they approached it:
- Data Collection System
Ørsted compiled a comprehensive dataset by combining distributed optical sensing along the cables with additional survey information. The dataset includes:
- Cable temperatures at strategic points
- Precise cable burial depths from geophysical surveys
- Geographical coordinates (organized using location identifiers called “TAZIDs” that segment the cable route into manageable sections)
- Ambient seawater temperatures from sensors and models
This integrated dataset was used to calibrate the thermal models.
- Gradient Descent Optimization Strategy
With this data in hand, the team implemented an iterative optimization approach:
- Initial estimates for thermal properties (e.g., thermal resistivity) at each location are provided from field investigations during the design process and existing soil models.
- Run the Thermal Electrical Equivalent Model (TEEM) to simulate expected temperatures
- Compare simulated results with actual measurements on the operational cable
- Adjust thermal properties to minimize the discrepancy
- Repeat until convergence
Mathematically, this process minimizes an objective function representing the error between measured and simulated temperatures:

Where represents the thermal parameters being optimized at each location, i is index for individual temperature measurements, and n is the total number of temperature measurements or data points used in the optimization process.
- Statistical Analysis for Reliability Assessment
Beyond optimization, the team conducted rigorous statistical analysis to validate their results:
- Grouped measurements by TAZID location identifiers
- Applied non-parametric statistical techniques to handle non-Gaussian distributions
- Implemented bootstrap sampling (5000 samples per location) to calculate robust confidence intervals
- Performed variogram analysis to assess spatial correlation between sampling points
- Used temporal models such as Autoregressive Integrated Moving Average (ARIMA) to perform hypothesis testing and confirm the existence of material properties that are changing over time
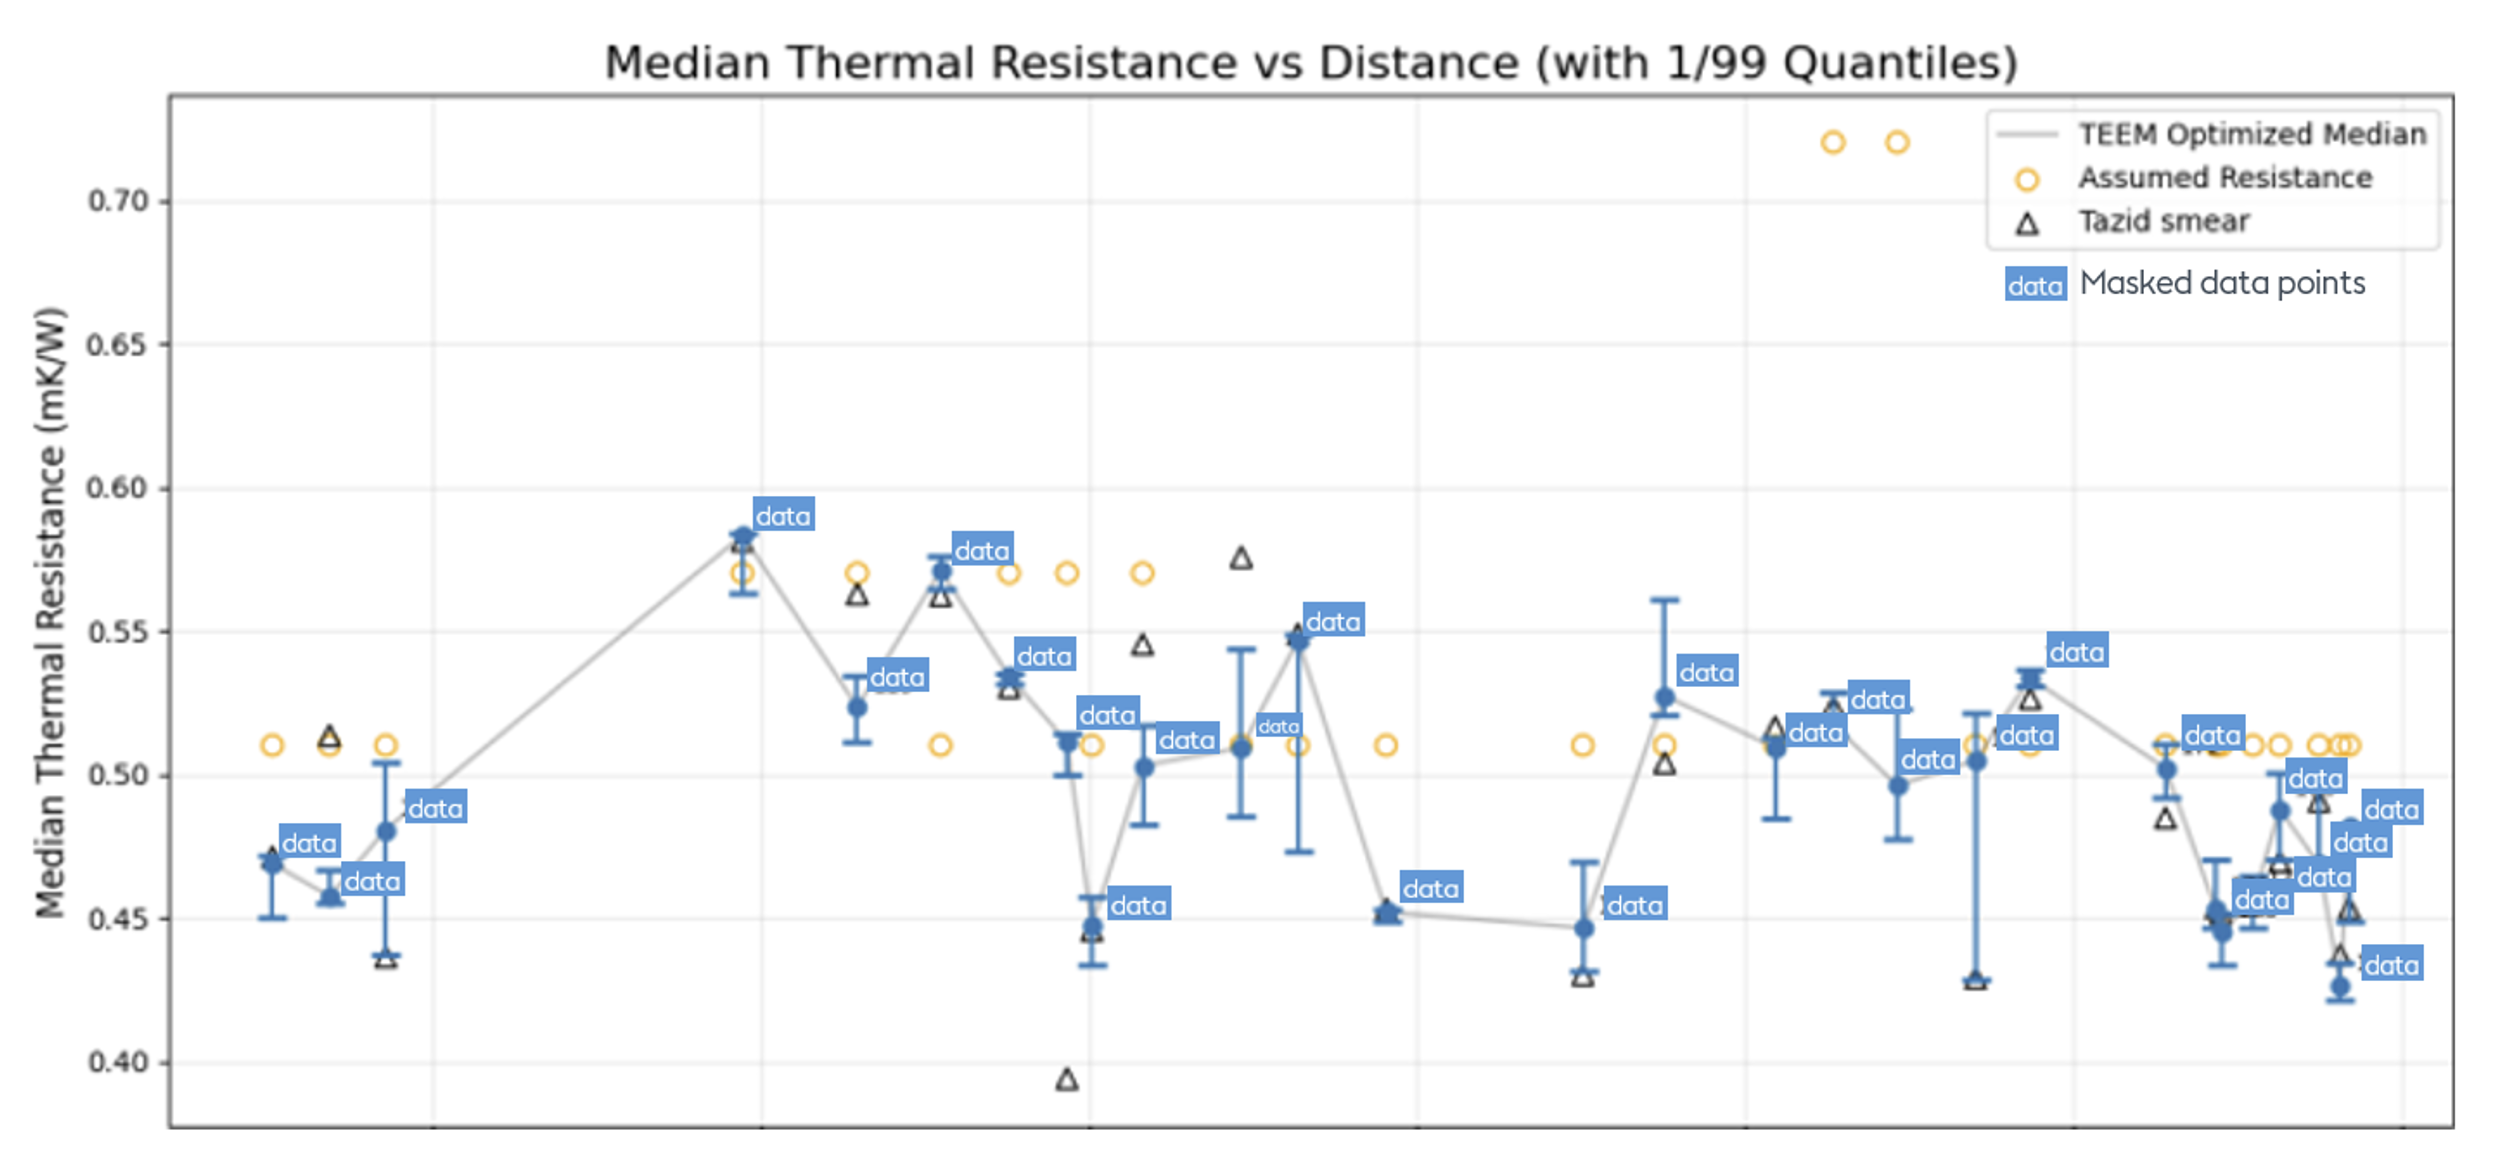
Figure 5 demonstrates how thermal resistivity varies significantly along the cable route, with error bars representing 1st/99th percentiles from bootstrap analysis of the median values. The analysis reveals that current thermal resistivity assessments are overly conservative, as they assume homogeneous soil properties within each TAZID. Statistical distribution fitting shows many locations exhibit multi-modal patterns consistent with soil property mixtures rather than uniform composition, indicating the current approach fails to capture the full complexity of soil characteristics within individual TAZIDs.
Figure 5 Demonstration of change in the median of each TAZID group vs distance. Error bars are based on 1/99 quantiles of 5000 sample bootstraps for the median. Medians are at the average distance for a group.
The value of this optimization process extends beyond simply generating new thermal property values. By systematically comparing the optimized thermal resistivity values against the initial estimates derived from pre-construction field investigations and standard soil models, Ørsted gained insights into the accuracy of their existing modeling approaches. In many locations, the optimization revealed significant discrepancies between assumed and actual thermal properties—up to 30% difference in some seabed environments. These findings enabled Ørsted to recalibrate their baseline assumptions for future projects, refine their cable design safety margins with greater precision, and develop more sophisticated regional thermal property maps. Additionally, by identifying patterns in the discrepancies, engineering teams could investigate specific environmental factors that might explain why conventional models underestimated or overestimated thermal resistivity in particular conditions, ultimately improving the guidance provided by their existing predictive models.
- Advanced Multivariate Optimization with SPSA
Building on this foundation, the team extended their approach to simultaneously optimize multiple thermal properties—specifically thermal resistivity and volumetric heat capacity.
This required implementing Simultaneous Perturbation Stochastic Approximation (SPSA), which efficiently estimates gradients in high-dimensional spaces:

Where:
- is a random perturbation vector
- is a small positive number that decreases with iterations
The key advantage of SPSA is that it requires only two function evaluations to estimate gradients regardless of parameter dimensionality—vastly more efficient than the n+1 evaluations needed by standard finite difference methods.
Since spatial statistical analysis demonstrated sufficient independence between sensor locations, the team was able to parallelize the gradient calculations across AWS infrastructure, dramatically accelerating the optimization process.
Optimization results and operational impact
The thermal property optimization delivered several significant analytical insights for Ørsted’s undersea cable modeling:
- Refined Thermal Property Understanding: The analysis revealed significant variations in thermal resistivity across different seabed locations (TAZID groups), with non-Gaussian distributions and notable outliers. This provided a more nuanced understanding of the thermal environment surrounding the cables than previously assumed values.
- Improved Model Accuracy: By using optimized thermal resistivity values rather than assumed constants, the TEEM simulations achieved substantially reduced error rates at specific cable distances, enabling more accurate temperature predictions.
- Temporal Variation Insights: ARIMA model analysis of the TEEM residuals suggested that thermal resistance may vary over time, indicating that the constant thermal resistance assumption in the current model may be limiting long-term simulation accuracy.
- Material Heterogeneity Confirmation: Statistical analysis revealed that observed uncertainty in thermal resistivity is primarily due to process variability rather than measurement or model error, confirming heterogeneity in seabed sediments.
- Computational Framework Development: A scalable computational approach was established using AWS resources, with optimal EC2 instance selection providing cost-effective execution of complex thermal simulations.
From static model to living digital twin
With our established methodology now validated, the next evolution is to transform this historical-data physics model into a living digital twin. Having confirmed the presence of temporal components in seabed properties, we can now leverage the combination of sensors, TEEM modeling, and AWS’s event-driven infrastructure to create an adaptive thermal model. This dynamic system continuously reassesses how soil thermal properties change over time, enabling Orsted to detect thermal anomalies before the cable temperature exceeds its limit and inform design decisions for more robust cable systems in future deployments.
How AWS enabled the prototype solution
The computational demands of this project were substantial. Each TEEM simulation processed millions of temperature data points, and thousands of simulations were needed for the optimization process. AWS provided the scalable computing infrastructure that made this analysis feasible.
- Efficient resource identification
To determine the most appropriate computing resources, the team used the CloudInstanceOptimizer tool to evaluate 114 different EC2 instance types, conducting systematic performance testing with replications to identify the optimal configuration. Figure 5 shows an example output from the optimizer. The analysis revealed that memory-optimized instances were most suitable for this workload, with each TEEM execution requiring approximately 8GB of RAM per vCPU.
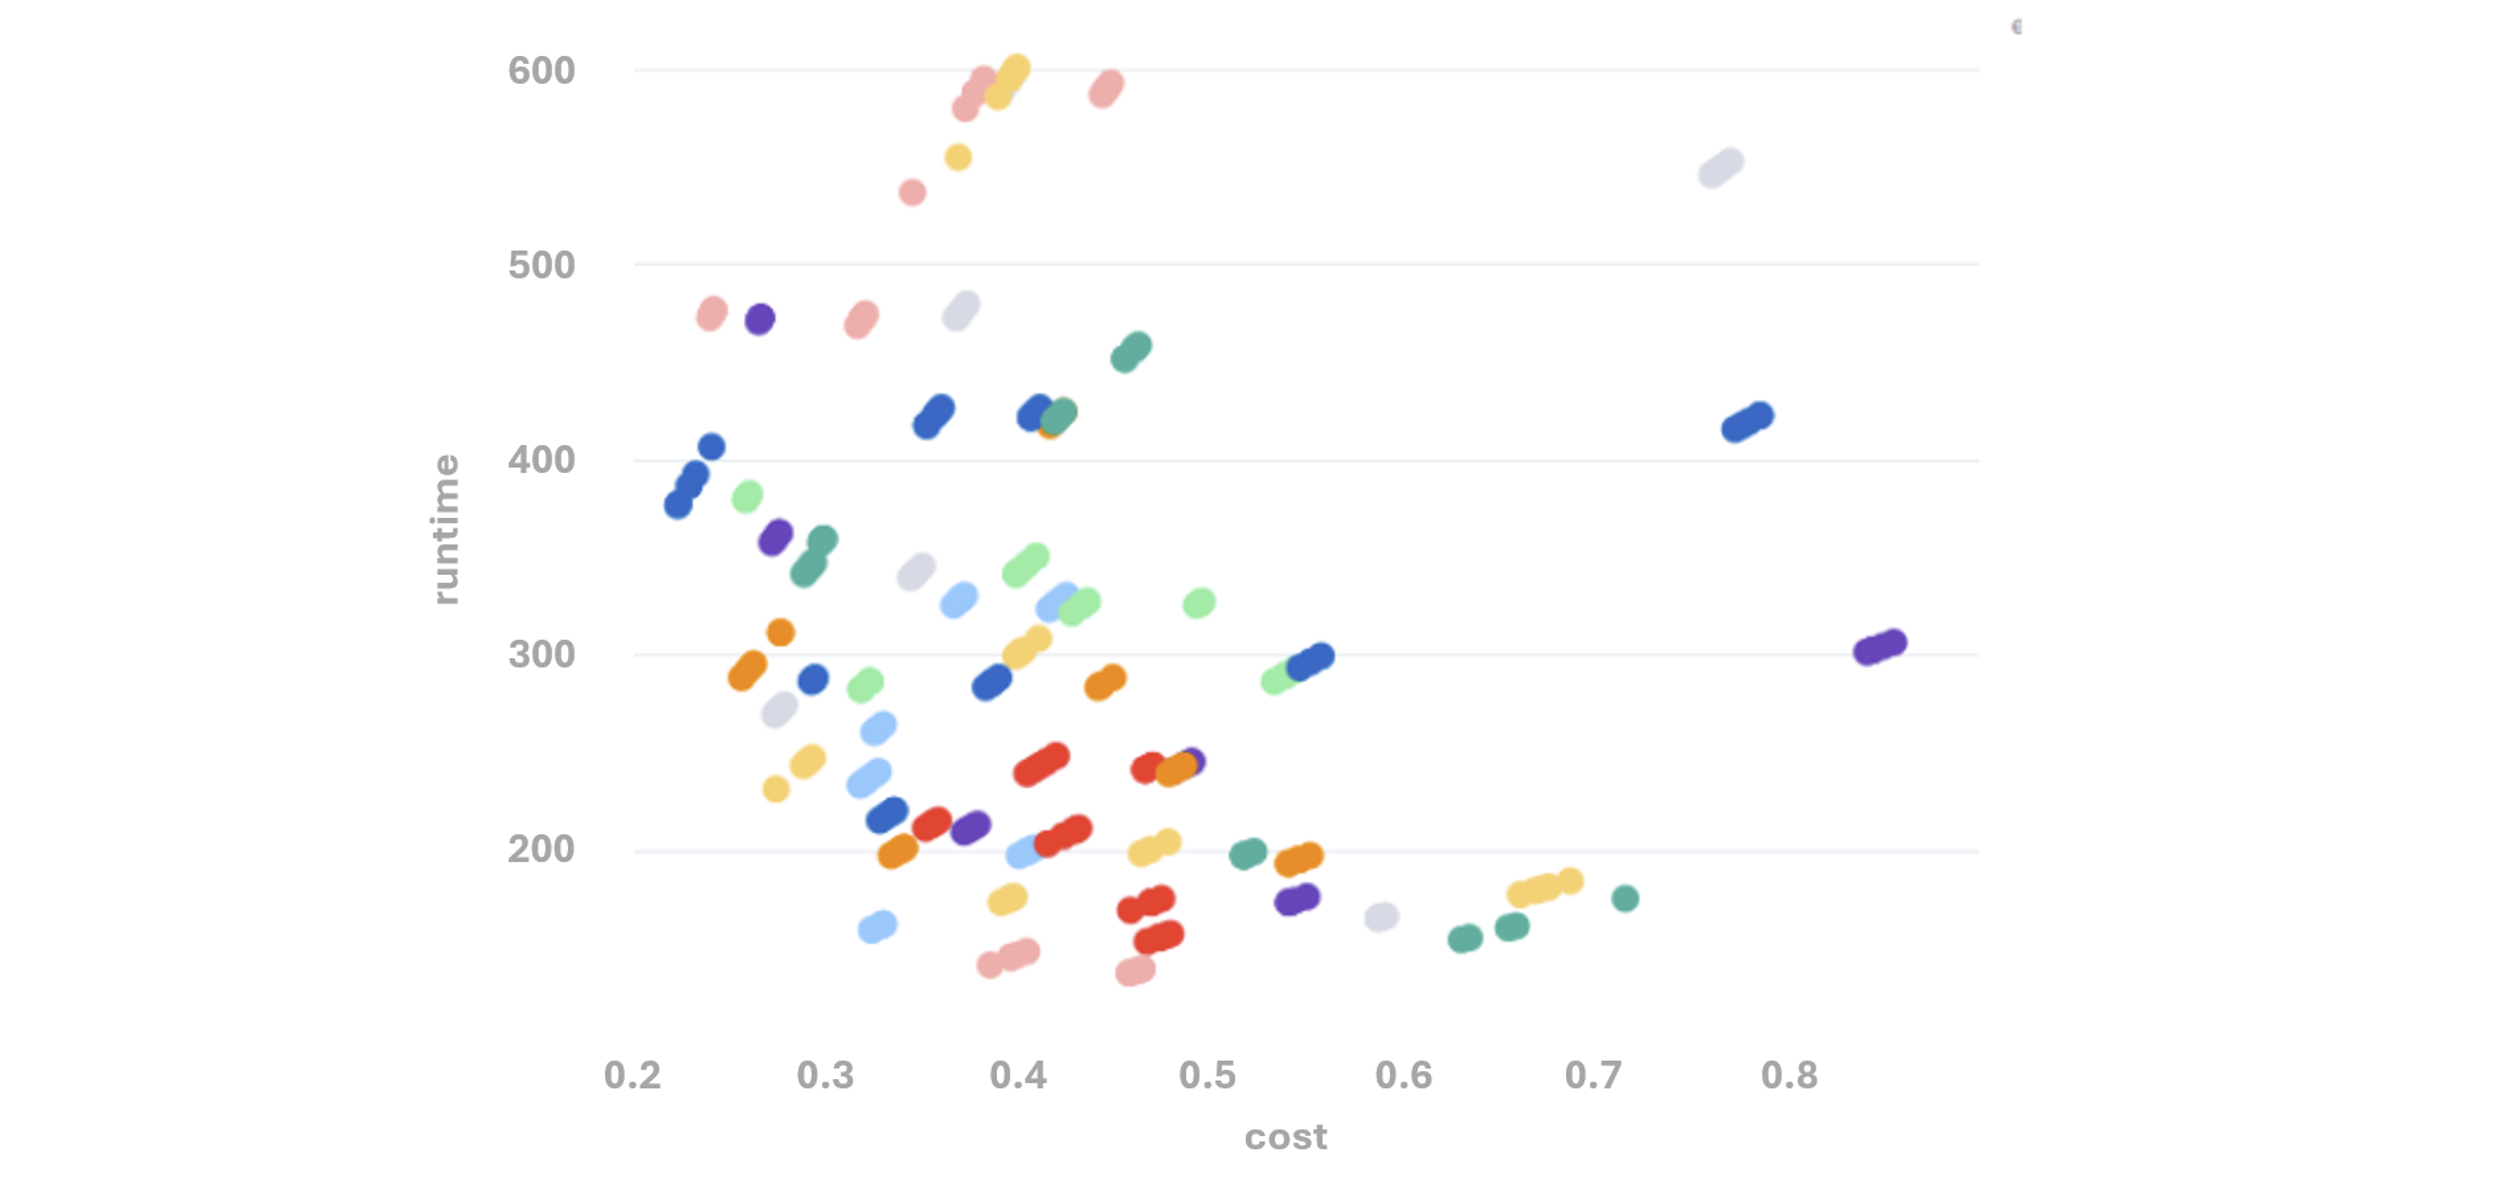
Figure 6 : runtime (s) vs cost ($) for each EC2 type reviewed with the TEEM model. Each color is a different instance type. This figure can be filtered and analyzed in the streamlit app.
- Distributed computing with Ray
Each TEEM execution used Ray on AWS Batch, a distributed computing framework. Ray allows for precise control over RAM usage for each TEEM execution, which is crucial for proper utilization of the Ray cluster when scaling up calculations to review all available data as fast as possible.
- Massive parallel processing
The scale of computing resources deployed was:
- For univariate analysis: 9 nodes, 1600 vCPUs, and approximately 13 terabytes of RAM
- For multivariate analysis: 17 nodes, 3264 vCPUs, and approximately 21 terabytes of RAM
- Rapid time to results
Despite the large computational requirements, AWS’s scalable infrastructure delivered results quickly:
- The univariate optimization completed in less than 2 hours
- The more complex multivariate analysis finished in less than 3 hours
This rapid turnaround enabled the team to iterate on their approach, refine their methodologies, and conduct comprehensive statistical analysis within a reasonable timeframe.
Conclusion
This proof-of-concept collaboration between Ørsted and AWS demonstrates the power of combining domain expertise with cloud computing capabilities to solve complex engineering challenges. By successfully estimating the thermal properties of seabed materials, Ørsted gained valuable insights that will help them optimize their undersea cable operations, potentially extending cable lifespan and maximizing the economic value of their offshore wind projects.
The project’s success relied on several key elements:
- Sophisticated physics-based modeling with TEEM
- Advanced optimization algorithms including gradient descent and SPSA
- Rigorous statistical analysis to quantify uncertainty
- Massive parallel processing enabled by AWS’s scalable infrastructure
As renewable energy continues to grow, particularly offshore wind, the insights and methodologies developed in this project will help ensure that the critical undersea cable infrastructure connecting these resources to the grid operates safely, efficiently, and reliably—bringing us one step closer to a sustainable energy future.
Note: The figures referenced in this blog are illustrative examples from the original project documentation. Contact Orsted for access to the complete analysis and results.
References
[1] Frank P. Incropera, David P. DeWitt, Theodore L. Bergman, and Adrienne S. Lavine. Fundamentals of Heat and Mass Transfer. 7th Edition, Wiley, 2011.