IBM & Red Hat on AWS
Running Cluster Autoscaler and Karpenter side by side on ROSA with HCP
Teams running Red Hat OpenShift Service on AWS (ROSA) often assume they must choose between the Cluster Autoscaler and the Red Hat build of Karpenter, or they blur the line between scaling pods and scaling nodes. ROSA with hosted control planes (HCP) gives several ways to scale, and teams often conflate them.
This post clears up that confusion by building a single ROSA HCP cluster that runs all four autoscaling mechanisms together: the Horizontal Pod Autoscaler (HPA) and the Custom Metrics Autoscaler (KEDA) at the pod tier, and the Cluster Autoscaler and Karpenter at the node tier.
The key insight is that the two node autoscalers are not mutually exclusive. They can run on the same cluster at the same time, with each workload choosing its provisioner through a single label. By the end, you will know when to reach for each mechanism, how to combine them safely, and how to observe every one of them from both the command line and the OpenShift web console.
Overview of solution
Autoscaling on Kubernetes happens at two tiers, and they work together rather than competing:
- Pod tier. The HPA and KEDA change how many pod replicas run. The HPA scales on CPU or memory. KEDA scales on any metric you can express, such as a Prometheus query, a queue depth, or a schedule.
- Node tier. The Cluster Autoscaler and Karpenter change how many nodes exist. When the pod tier adds replicas that do not fit on the current nodes, the node tier adds capacity so those pods can schedule.
The mechanism that lets both node autoscalers coexist on one cluster is a pair of node “lanes.” Each lane is a set of nodes that carries a shared label, demo-scaler, whose value names the autoscaler that manages it (cluster-autoscaler or karpenter). A workload opts into a lane with a matching nodeSelector. The Cluster Autoscaler manages an autoscaling machine pool whose nodes carry demo-scaler=cluster-autoscaler, and the Karpenter NodePool stamps demo-scaler=karpenter on every node it provisions. Because each overflow workload declares which label it requires, its pods land only on the intended lane, and the two strategies never step on each other.
The walkthrough uses a small demo namespace, autoscaling-demo, with these workloads:
- manual-demo, a workload with no autoscaler, used to demonstrate manual scaling.
- load-target, scaled by an HPA on CPU.
- keda-target, scaled by KEDA on a Prometheus query.
- overflow-ca, which lands only on the Cluster Autoscaler lane.
- overflow-karpenter, which lands only on the Karpenter lane.
Prerequisites
To follow along, you will need:
- A ROSA cluster with hosted control planes, running OpenShift 4.22 or later.
- The oc and rosa command line tools, and an account with cluster-admin on the cluster.
- User-workload monitoring enabled, so KEDA has a Prometheus source to query.
- The Red Hat build of Karpenter enabled on the cluster. You turn this on per cluster with the rosa command line interface (CLI) AutoNode setting, which provisions the controller AWS Identity and Access Management (IAM) role and installs the Karpenter custom resource definitions.
Setting up the environment
The rest of this section stands up everything the walkthrough uses. If you already have your own workloads, you can adapt these steps to them; the concepts are the same.
- Log in to the cluster. Authenticate the oc client to your cluster with an account that has cluster-admin. Use the API URL and credentials from your cluster (in the console, your username menu has a Copy login command option that provides a token-based oc login):
oc login <YOUR_CLUSTER_API_URL> --username <YOUR_USERNAME> --password <YOUR_PASSWORD>
- Create the namespace and the demo workloads. Everything lives in one namespace, autoscaling-demo. Create it and deploy the applications the steps below scale. Use small, low-request pods so the demo is inexpensive; for the two CPU-scaled apps (load-target and keda-target), set a CPU request so the autoscalers have a percentage to scale against.
oc new-project autoscaling-demo
There are three kinds of workload to deploy. The first is a CPU-burnable HTTP server used by the pod-tier demos. The load-target Deployment below runs a small Python server on port 8080 that spins the CPU on each request, sets a CPU request (so the HPA has a percentage to scale against), and runs cleanly under OpenShift’s restricted-v2 security context:
apiVersion: apps/v1
kind: Deployment
metadata:
  name: load-target
  namespace: autoscaling-demo
  labels: { app: load-target }
spec:
  replicas: 1
  selector:
    matchLabels: { app: load-target }
  template:
    metadata:
      labels: { app: load-target }
    spec:
      securityContext:
        runAsNonRoot: true
        seccompProfile: { type: RuntimeDefault }
      containers:
        - name: cpu-burn
          image: registry.access.redhat.com/ubi9/python-39
          command: ["python3", "-c"]
          args:
            - |
              import http.server, socketserver
              class H(http.server.BaseHTTPRequestHandler):
                  def do_GET(self):
                      x = 0
                      for i in range(20_000_000):
                          x += i * i
                      self.send_response(200); self.end_headers()
                      self.wfile.write(b"ok\n")
                  def log_message(self, *a): pass
              socketserver.TCPServer(("", 8080), H).serve_forever()
          ports: [{ containerPort: 8080 }]
          securityContext:
            allowPrivilegeEscalation: false
            capabilities: { drop: ["ALL"] }
          resources:
            requests: { cpu: 200m, memory: 128Mi }
            limits: { cpu: 500m, memory: 256Mi }
---
apiVersion: v1
kind: Service
metadata:
  name: load-target
  namespace: autoscaling-demo
spec:
  selector: { app: load-target }
  ports: [{ name: http, port: 80, targetPort: 8080 }]
Save that as load-target.yaml and apply it:
oc apply -f load-target.yaml
Deploy a second, identical workload named keda-target (copy the manifest above and change every load-target to keda-target). It needs to be separate because a KEDA ScaledObject creates its own HPA and cannot target a workload that already has one, so load-target belongs to the HPA demo and keda-target belongs to the KEDA demo. Save it as keda-target.yaml and apply it the same way:
oc apply -f keda-target.yaml
The second kind is manual-demo, used only for the manual-scaling baseline. It has no autoscaler and does no work, so a tiny pause container is enough:
apiVersion: apps/v1
kind: Deployment
metadata:
  name: manual-demo
  namespace: autoscaling-demo
  labels: { app: manual-demo }
spec:
  replicas: 1
  selector:
    matchLabels: { app: manual-demo }
  template:
    metadata:
      labels: { app: manual-demo }
    spec:
      containers:
        - name: pause
          image: registry.k8s.io/pause:3.9
          resources:
            requests: { cpu: 10m, memory: 16Mi }
Save that as manual-demo.yaml and apply it:
oc apply -f manual-demo.yaml
The third kind is the two overflow workloads that trigger node scaling. Each requests about 1.5 CPU per pod, so a few replicas cannot fit on one node, and each carries a nodeSelector pinning it to one lane. Here is overflow-ca; create overflow-karpenter the same way, changing both demo-scaler values from cluster-autoscaler to karpenter:
apiVersion: apps/v1
kind: Deployment
metadata:
  name: overflow-ca
  namespace: autoscaling-demo
  labels: { app: overflow-ca, demo-scaler: cluster-autoscaler }
spec:
  replicas: 0
  selector:
    matchLabels: { app: overflow-ca }
  template:
    metadata:
      labels: { app: overflow-ca, demo-scaler: cluster-autoscaler }
    spec:
      nodeSelector:
        demo-scaler: cluster-autoscaler
      containers:
        - name: pause
          image: registry.k8s.io/pause:3.9
          resources:
            requests: { cpu: "1500m", memory: 512Mi }
Save overflow-ca.yaml and the overflow-karpenter.yaml you derived from it, then apply both:
oc apply -f overflow-ca.yamloc apply -f overflow-karpenter.yaml
- Create the HPA for load-target. A standard HorizontalPodAutoscaler that targets 50 percent average CPU:
oc autoscale deploy/load-target --cpu-percent=50 --min=1 --max=10 -n autoscaling-demo
- Turn on user-workload monitoring and install KEDA. KEDA reads the cluster’s built-in monitoring, so first turn on user-workload monitoring by applying the cluster-monitoring-config ConfigMap:
oc apply -f - <<'EOF'
apiVersion: v1
kind: ConfigMap
metadata:
  name: cluster-monitoring-config
  namespace: openshift-monitoring
data:
  config.yaml: |
    enableUserWorkload: true
EOF
Next, install the Custom Metrics Autoscaler (KEDA) operator. You can do this from OperatorHub in the console, or apply the namespace, OperatorGroup, and Subscription directly:
oc apply -f - <<'EOF'
apiVersion: v1
kind: Namespace
metadata:
  name: openshift-keda
---
apiVersion: operators.coreos.com/v1
kind: OperatorGroup
metadata:
  name: openshift-keda
  namespace: openshift-keda
spec:
  targetNamespaces:
    - openshift-keda
---
apiVersion: operators.coreos.com/v1alpha1
kind: Subscription
metadata:
  name: openshift-custom-metrics-autoscaler-operator
  namespace: openshift-keda
spec:
  channel: stable
  name: openshift-custom-metrics-autoscaler-operator
  source: redhat-operators
  sourceNamespace: openshift-marketplace
EOF
The operator installs asynchronously. Wait until its custom resource definitions are served (for example, oc get crd scaledobjects.keda.sh succeeds), then create a KedaController named keda to deploy the KEDA control plane:
oc apply -f - <<'EOF'
apiVersion: keda.sh/v1alpha1
kind: KedaController
metadata:
  name: keda
  namespace: openshift-keda
spec:
  watchNamespace: ""
EOF- Wire up KEDA’s access to monitoring, then create the ScaledObject. This is the step most people miss. For KEDA to query per-namespace metrics through the Thanos querier, its trigger needs a bearer token with two grants: the cluster-monitoring-view ClusterRole (to reach Thanos at all) and a namespaced view RoleBinding (to read this project’s user-workload metrics; without it, queries return HTTP 403). Create a service account, a service-account-token Secret, both bindings, and a TriggerAuthentication that hands KEDA the token:
apiVersion: v1
kind: ServiceAccount
metadata: { name: thanos, namespace: autoscaling-demo }
---
apiVersion: v1
kind: Secret
metadata:
  name: thanos-token
  namespace: autoscaling-demo
  annotations:
    kubernetes.io/service-account.name: thanos
type: kubernetes.io/service-account-token
---
apiVersion: rbac.authorization.k8s.io/v1
kind: ClusterRoleBinding
metadata: { name: autoscaling-demo-thanos-monitoring-view }
roleRef: { apiGroup: rbac.authorization.k8s.io, kind: ClusterRole, name: cluster-monitoring-view }
subjects: [{ kind: ServiceAccount, name: thanos, namespace: autoscaling-demo }]
---
apiVersion: rbac.authorization.k8s.io/v1
kind: RoleBinding
metadata: { name: thanos-view, namespace: autoscaling-demo }
roleRef: { apiGroup: rbac.authorization.k8s.io, kind: ClusterRole, name: view }
subjects: [{ kind: ServiceAccount, name: thanos, namespace: autoscaling-demo }]
---
apiVersion: keda.sh/v1alpha1
kind: TriggerAuthentication
metadata: { name: keda-trigger-auth-prometheus, namespace: autoscaling-demo }
spec:
  secretTargetRef:
    - parameter: bearerToken
      name: thanos-token
      key: token
Then create the ScaledObject that scales keda-target on a Prometheus query. Note the minReplicaCount of 1: scaling a Prometheus-scraped app to zero would leave no pods to produce the metric:
apiVersion: keda.sh/v1alpha1
kind: ScaledObject
metadata: { name: keda-target-prometheus, namespace: autoscaling-demo }
spec:
  scaleTargetRef: { name: keda-target }
  minReplicaCount: 1
  maxReplicaCount: 10
  triggers:
    - type: prometheus
      metadata:
        serverAddress: https://thanos-querier.openshift-monitoring.svc.cluster.local:9092
        namespace: autoscaling-demo
        metricName: keda_target_cpu_seconds
        threshold: "0.2"
        query: |
          sum(rate(container_cpu_usage_seconds_total{namespace="autoscaling-demo",pod=~"keda-target-.*",container!="POD",container!=""}[2m]))
        authModes: bearer
      authenticationRef:
        name: keda-trigger-auth-prometheus
Save both to files and apply them:
oc apply -f keda-trigger-auth.yamloc apply -f keda-scaledobject.yaml
- Create the Cluster Autoscaler lane. On ROSA HCP, the Cluster Autoscaler runs as an autoscaling machine pool. Create one that scales 1 to 3 nodes and labels its nodes so the overflow-ca workload lands on them. In an account that enforces IMDSv2, set the metadata option to required or the pool’s nodes will silently fail to launch:
rosa create machinepool -c <your-cluster> --name ca-demo \
  --enable-autoscaling --min-replicas 1 --max-replicas 3 \
  --instance-type m5.xlarge \
  --labels demo-scaler=cluster-autoscaler \
--ec2-metadata-http-tokens required --yes- Create the Karpenter NodePool and EC2NodeClass. With the Red Hat build of Karpenter enabled (see the prerequisites), apply a default OpenshiftEC2NodeClass and a NodePool. The NodePool must label the nodes it provisions demo-scaler=karpenter so the overflow-karpenter workload lands on them:
apiVersion: karpenter.sh/v1
kind: NodePool
metadata:
  name: default
spec:
  template:
    metadata:
      labels:
        demo-scaler: "karpenter"
    spec:
      nodeClassRef:
        group: karpenter.k8s.aws
        kind: EC2NodeClass
        name: default
      requirements:
        - key: kubernetes.io/arch
          operator: In
          values: ["amd64", "arm64"]
        - key: karpenter.sh/capacity-type
          operator: In
          values: ["spot", "on-demand"]
  limits:
    cpu: 32           # cost guardrail, discussed later
  disruption:
    consolidationPolicy: WhenEmptyOrUnderutilized
    consolidateAfter: 30s
Save the NodePool as nodepool.yaml and apply it, along with a minimal OpenshiftEC2NodeClass named default:
oc apply -f - <<'EOF'apiVersion: karpenter.hypershift.openshift.io/v1kind: OpenshiftEC2NodeClassmetadata: name: defaultspec: {}EOFoc apply -f nodepool.yaml
You do not need a metadata flag on this lane. The OpenshiftEC2NodeClass enforces IMDSv2 by default on every node the Red Hat build of Karpenter provisions.
Confirm the workloads are present before you begin:
oc project autoscaling-demooc get deploy,hpa,scaledobject
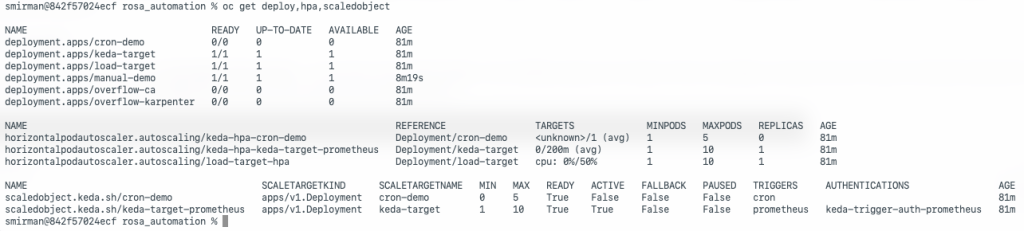
Figure 1: Command-line output of the existing demo workloads.
Most steps below can also be driven from the OpenShift web console. Log in, open Topology under Workloads, and enable Display Options > Pod Count so each application’s ring shows its live pod count.
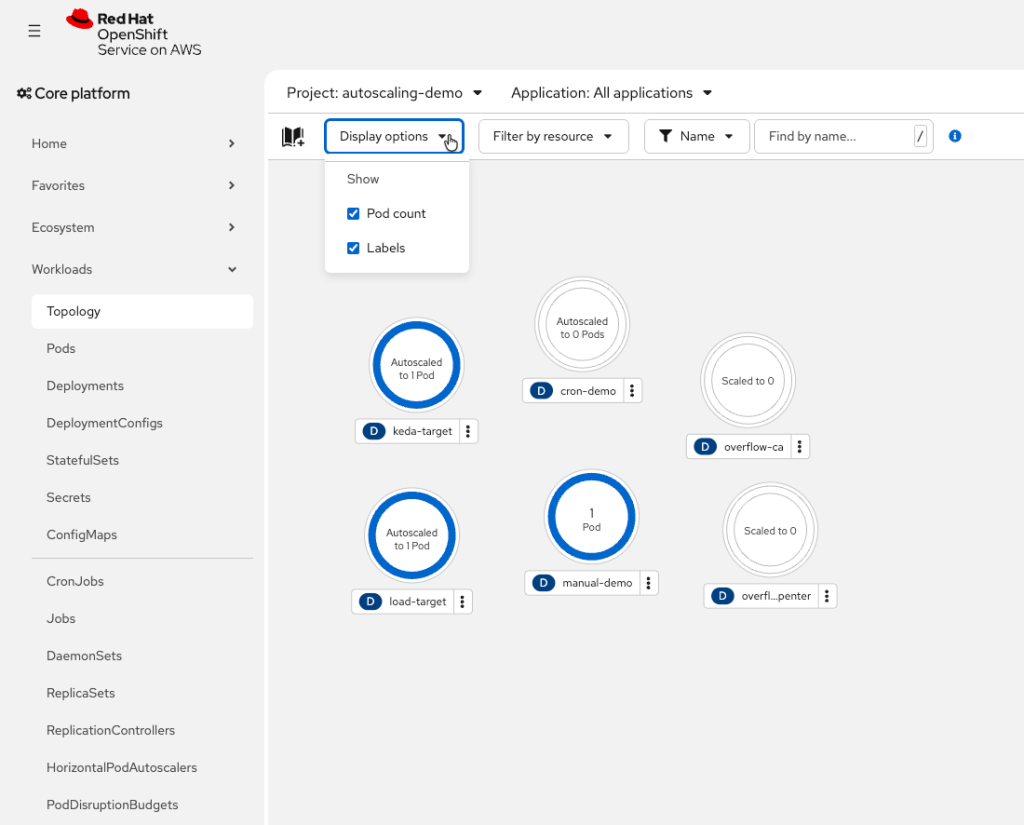
Figure 2: Enabling Pod Count under Display Options in the console Topology view.
Step 1: Manual scaling as a baseline
Before anything automatic, scale a workload by hand so the automated behavior later has something to contrast with. Use manual-demo, which has no autoscaler, so the count you set actually holds:
oc scale deploy/manual-demo --replicas=3oc get pods -l app=manual-demo -w
In the console, you can do the same thing by opening the manual-demo application in Topology, choosing Actions > Edit Pod count, and saving a new value.
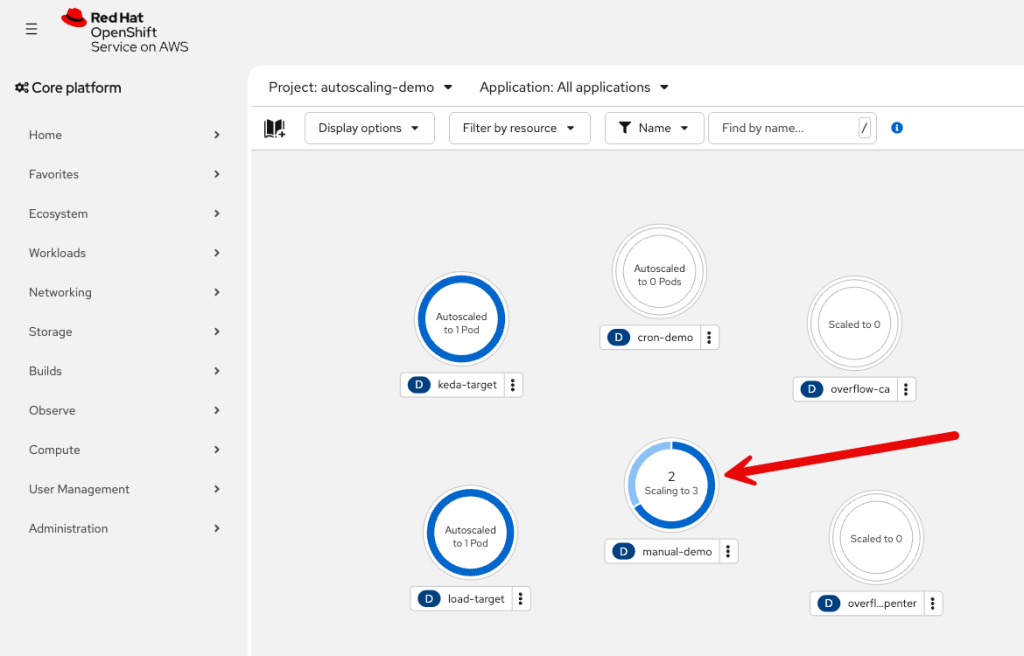
Figure 3: Manually scaling the same workload from the console using Edit Pod count.
This is an important detail that shapes the rest of this post. A workload that has an HPA cannot be scaled by hand, because the HPA owns its replica count and reverts any manual change within seconds. That is exactly why this step uses a dedicated workload with no autoscaler.
Step 2: Pod-tier autoscaling with the HPA
The HPA watches CPU on the load-target application and adds replicas to keep average CPU under 50 percent. Watch it at rest first:
oc get hpa load-target-hpa -w
In a second terminal, start a small load generator that runs inside the cluster and drives CPU on load-target:
oc run load-gen --image=busybox:1.36 --restart=Never \

          --overrides='{"spec":{"securityContext":{"runAsNonRoot":true,"seccompProfile":{"type":"RuntimeDefault"}},"containers":[{"name":"load-gen","image":"busybox:1.36","command":["/bin/sh","-c","while true; do wget -q -O- http://load-target.autoscaling-demo.svc.cluster.local >/dev/null 2>&1; done"],"securityContext":{"allowPrivilegeEscalation":false,"capabilities":{"drop":["ALL"]}}}]}}'
Over one to two minutes, the CPU column climbs past 50 percent and the replica count rises toward its maximum.
In the console, the load-target ring fills with pods on its own, and it is labeled “Autoscaled to N Pods.” Notice that its Actions menu no longer offers Edit Pod count. Once a workload has an HPA, the console hands scaling to the autoscaler, which is the visual confirmation of the behavior in Step 1.
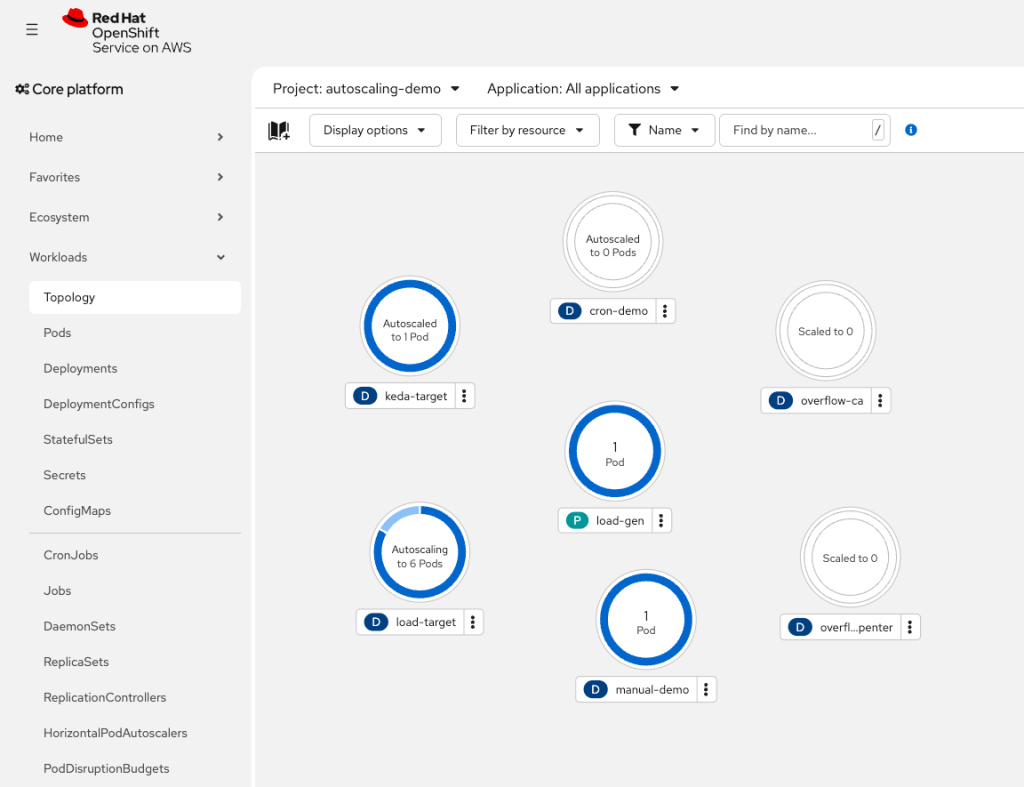
Figure 4: The load-target workload scaling up in the console Topology view.
Delete the load generator with oc delete pod load-gen. After the load stops, the HPA scales back down.
Step 3: Custom-metric autoscaling with KEDA
The HPA scales only on CPU and memory. KEDA, delivered on OpenShift as the Custom Metrics Autoscaler, scales on any metric you can express. A common misconception is that KEDA replaces the HPA. It does not. When you create a KEDA ScaledObject, KEDA creates an HPA under the hood and publishes your metric to the Kubernetes external-metrics API so that HPA can consume it. Both Step 2 and Step 3 are ultimately the same engine, a HorizontalPodAutoscaler, reading different metrics.
In this environment, the keda-target-prometheus ScaledObject scales the keda-target application on a Prometheus query against the cluster’s built-in monitoring. You can confirm that the KEDA-created HPA reads an external metric rather than CPU:
oc get hpa keda-hpa-keda-target-prometheus -n autoscaling-demo \ -o jsonpath='{.spec.metrics[0].type}{"\n"}' # prints: External
Confirm the ScaledObject is ready, then drive load against keda-target with the same load-generator pattern used in Step 2, pointed at the keda-target service:
oc run load-gen --image=busybox:1.36 --restart=Never \

          --overrides='{"spec":{"securityContext":{"runAsNonRoot":true,"seccompProfile":{"type":"RuntimeDefault"}},"containers":[{"name":"load-gen","image":"busybox:1.36","command":["/bin/sh","-c","while true; do wget -q -O- http://keda-target.autoscaling-demo.svc.cluster.local >/dev/null 2>&1; done"],"securityContext":{"allowPrivilegeEscalation":false,"capabilities":{"drop":["ALL"]}}}]}}'
Within a few minutes, the ScaledObject reports ACTIVE True and the keda-target deployment scales up.
The web console is the clearest way to see the metric drive the scaling. Under Observe > Metrics, run the same Prometheus query KEDA evaluates and watch the value rise past the threshold as load increases:
sum(rate(container_cpu_usage_seconds_total{namespace="autoscaling-demo",pod=~"keda-target-.*",container!="POD",container!=""}[2m]))
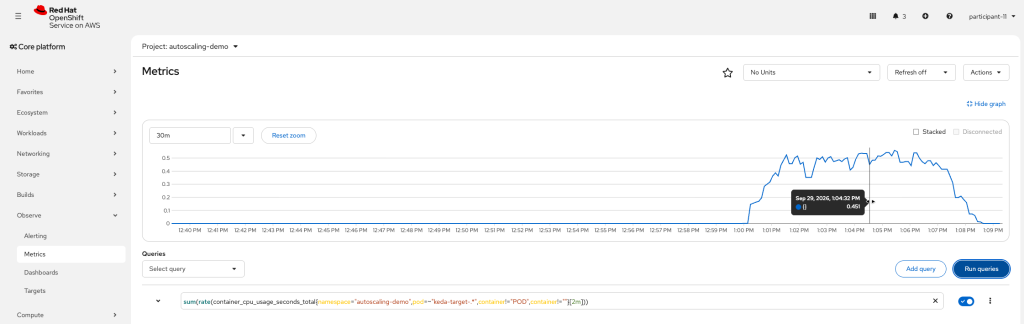
Figure 5: The Prometheus metric rising past its threshold in the Observe, Metrics query browser.
This is the pattern you would use to scale on queue depth, request rate, or any business metric, rather than being limited to CPU.
Step 4: Node-tier autoscaling with the Cluster Autoscaler
So far, the walkthrough has only added pods. Now you add pods that cannot fit on the current nodes and watch a node appear. This cluster has a dedicated Cluster Autoscaler lane: an autoscaling machine pool named ca-demo that scales between 1 and 3 nodes and labels its nodes demo-scaler=cluster-autoscaler. The overflow-ca workload is built to land only on that lane.
Watch the lane’s nodes, then request more pods than one node can hold:
oc get nodes -l demo-scaler=cluster-autoscaler -w
oc scale deploy/overflow-ca --replicas=4oc get pods -l app=overflow-ca -o wide
At first, some pods sit Pending because there is no room for them.

Figure 6: The overflow-ca pods sitting Pending before the Cluster Autoscaler adds nodes.
The Cluster Autoscaler notices the unschedulable pods and grows the ca-demo pool from 1 node toward its maximum of 3. As each node becomes ready, the pending pods schedule onto it.
You can watch the same event in the console as a new node initializes, backed by a new Amazon Elastic Compute Cloud (Amazon EC2) instance.
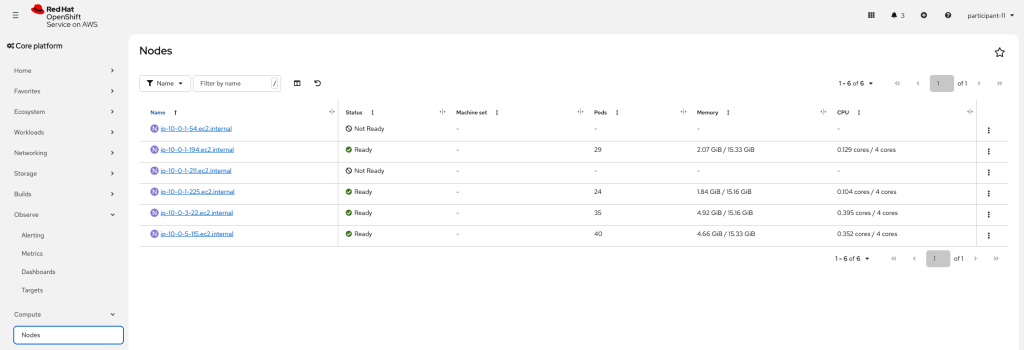
Figure 7: A new Cluster Autoscaler node initializing in the console.
When you are done, scale the workload back down:
oc scale deploy/overflow-ca --replicas=0
Scale-down is deliberately slow. After you scale overflow-ca back to 0, the pods stop immediately, but the Cluster Autoscaler only removes a node after it has been underutilized for a sustained period, roughly 10 minutes by default. The pool never drops below its minimum of 1 node. This is the defining trait of the Cluster Autoscaler: it manages a predefined pool of a fixed instance type, and it keeps a minimum warm.
Step 5: Node-tier autoscaling with the Red Hat build of Karpenter
Karpenter takes a different approach. Instead of growing a fixed pool, it reads the pending pods and provisions a node sized to fit them, then removes that node when it is no longer needed. Two objects control it:
- The NodePool defines what Karpenter is allowed to launch (this environment supports both amd64 and arm64 architectures and both Spot and On-Demand capacity, so Karpenter can pick a cost-effective instance) and the labels it stamps on the nodes it creates, including demo-scaler=karpenter. Pin the capacity type to on-demand for workloads that cannot tolerate interruption. It also carries a CPU limit as a guardrail, discussed in the next section.
- The EC2NodeClass is the AWS-side template: the Amazon Machine Image (AMI), subnets, security groups, and IAM role the launched instances use. Red Hat manages these defaults.
The overflow-karpenter workload carries nodeSelector: demo-scaler=karpenter. Watch the Karpenter lane and scale the workload up:
oc get nodes -l demo-scaler=karpenter -w
oc scale deploy/overflow-karpenter --replicas=6
Within a couple of minutes, Karpenter launches a right-sized node and the pods schedule onto it.
In the console, the new node appears in the node list. If you open it and look at its labels, you will see demo-scaler=karpenter. That label is the proof the node came from Karpenter, and it is exactly what the overflow-karpenter pods matched to land there.
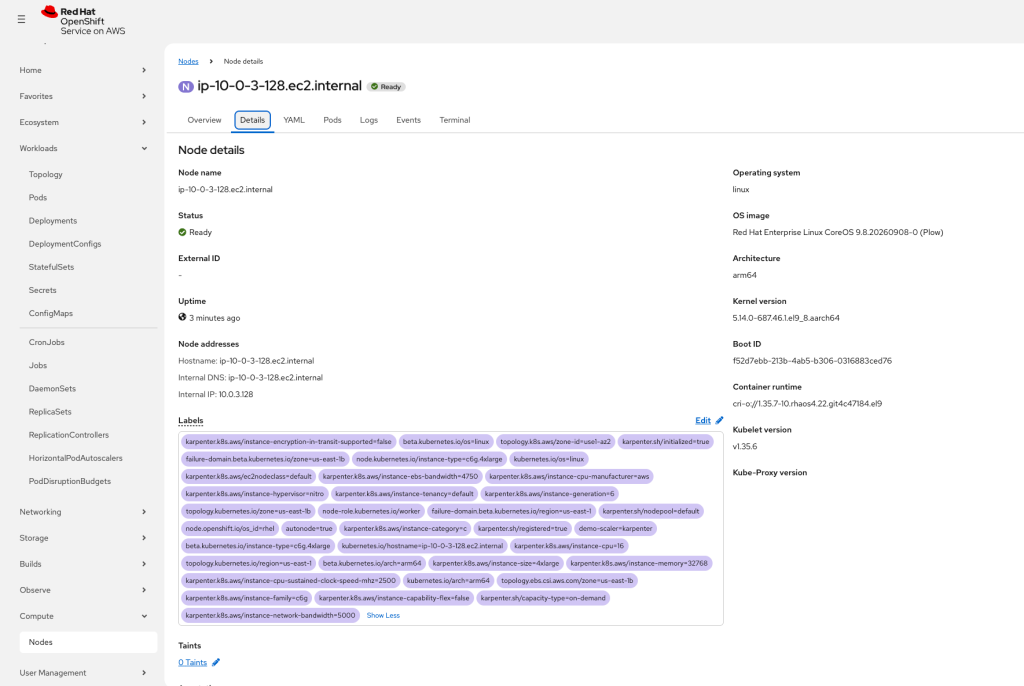
Figure 8: The new node’s labels, including demo-scaler=karpenter, confirming Karpenter created it.
When you are done, scale the workload back down:
oc scale deploy/overflow-karpenter --replicas=0
Karpenter then consolidates and removes the node entirely. This is the contrast with the Cluster Autoscaler: Karpenter has no minimum, so its node disappears completely a few minutes after the pods are gone, while the ca-demo pool scales back down to its one warm node.
Step 6: Running both node autoscalers side by side
This is the core of the post. Scale both overflow workloads at once and list the nodes with their lane label:
oc scale deploy/overflow-ca --replicas=4oc scale deploy/overflow-karpenter --replicas=6oc get nodes -L demo-scaler
The DEMO-SCALER column tells the story: nodes labeled cluster-autoscaler are the predefined pool growing, and nodes labeled karpenter are right-sized nodes appearing on demand. In the console Topology view, you can watch both overflow workloads scale their pods at the same time, each landing on its own lane’s nodes.
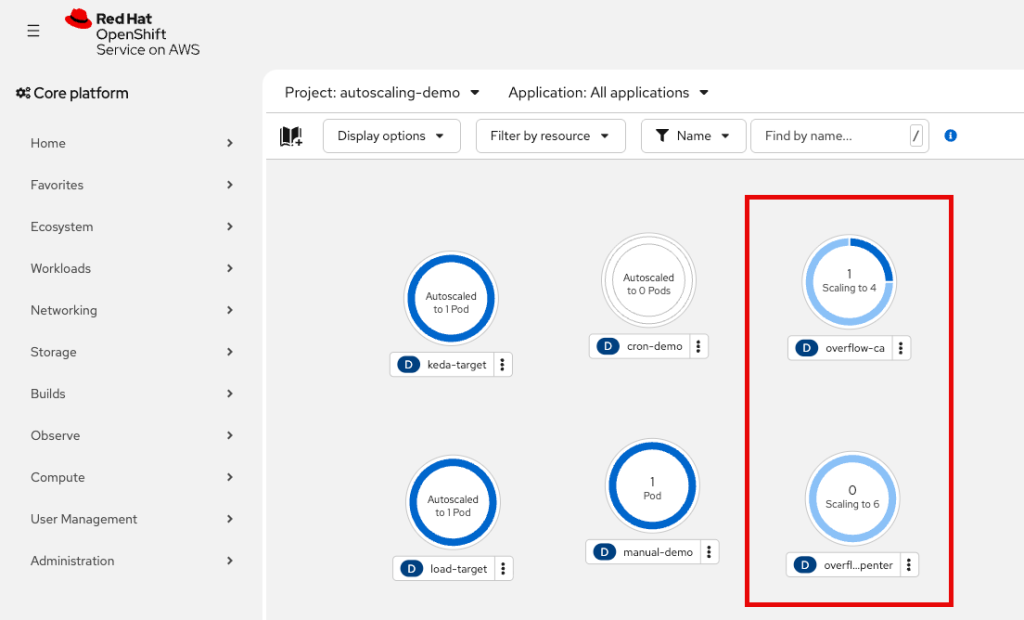
Figure 9: Both overflow workloads scaling their pods at once in the console Topology view.
The same cluster is running two node-management strategies at once, and each workload picked its strategy with nothing more than a label.
Choosing between the two node autoscalers
Seeing them side by side makes the trade-off concrete:
- Cluster Autoscaler grows a predefined pool of a fixed instance type and keeps a configurable minimum of nodes warm. It is a good fit when your workloads are uniform, when you want a known instance type, or when keeping a warm node reduces scheduling latency for the first burst of pods.
- Karpenter provisions a node sized to the pending pods, can choose across instance types and Spot or On-Demand capacity for cost, and consolidates nodes away to zero when they are idle. It is a good fit for spiky or heterogeneous workloads where right-sizing and scale-to-zero reduce cost.
You do not have to pick one for the whole cluster. As this walkthrough shows, you can run both and route workloads to whichever fits.
Guardrails to control cost and prevent runaway scaling
Autoscaling that provisions nodes on demand is powerful, but without bounds it can also be expensive. A misconfigured deployment, a runaway continuous integration (CI) job, a load test left running, or a typo such as oc scale deploy/my-app –replicas=600 can ask the node autoscalers to provision far more compute than you intended, and the cost shows up on your next bill. Setting explicit limits is a production best practice, not only a safeguard for shared environments. Two guardrails cap the blast radius:
- A namespace ResourceQuota bounds total CPU, memory, and pod count for the whole autoscaling-demo namespace. Once the cap is reached, the API server rejects further pods at admission rather than piling up and driving node provisioning. Because it bounds the namespace, it backstops both node lanes at once.
- A CPU limit on the Karpenter NodePool caps how much compute that lane can ever provision, regardless of how far you scale a workload.
Together, these controls let you adopt on-demand node autoscaling with confidence: workloads scale to meet real demand, but neither lane can provision compute beyond the ceiling you set. They apply equally to a single production namespace and to a cluster shared across many teams.
Cleaning up
ROSA HCP clusters, their worker nodes, and their load balancers are recurring-cost resources, so remove them when you are done. Delete the demo workloads with oc delete (or remove the autoscaling-demo namespace), and delete the cluster with rosa delete cluster, then remove the associated account roles, OpenID Connect (OIDC) configuration, and virtual private cloud (VPC).
Conclusion
In this post, you learned that autoscaling on ROSA with HCP works as two tiers that compose. The HPA and KEDA scale pods, on CPU or on any custom metric, and the Cluster Autoscaler and the Red Hat build of Karpenter scale nodes to satisfy that demand. The most useful takeaway is that the two node autoscalers are not an either-or choice. They can run on the same cluster, with each workload selecting its provisioner through a label, which lets you match a fixed pool or right-sized on-demand nodes to each workload’s behavior. Layered with a namespace quota and a NodePool CPU limit, this setup keeps that flexibility from turning into runaway cost. Try it on your own cluster, watch the two strategies react to the same workload, and decide which one fits each of your applications. If you have questions or suggestions, leave a comment on this post.