AWS Cloud Operations Blog
An AI Observability Framework for Your Agentic Applications
Best practices for every layer, from the first prototype to production
Agents have moved beyond proof of concept. IDC’s July 2026 survey found that 95% of enterprises now run at least one agent-enabled workflow in production, and 67% exceeded their agent budgets by more than 10% in the past year. Gartner predicts that more than 40% of agentic AI projects will be canceled by the end of 2027 because of escalating costs, unclear business value, or inadequate risk controls. Each of those causes is a visibility problem.
For years, observability helped humans answer questions about deterministic software, where the same input followed the same logic defined in the code. An agent decides at runtime which tools to call, which context to trust, how many steps to take, and when to stop. Two identical requests can take different paths at very different costs, and an answer can be fluent, fast, and wrong. Knowing that a service is up tells you very little about whether an agent is behaving.
This post presents a framework for observing agents across their whole lifecycle, from the first prototype to production. It breaks an agentic system into four layers: the application the agent is part of, the agent’s reasoning and tool calls, the models behind it, and the infrastructure underneath, with best practices for each one: what goes wrong, the signals that detect it, and where to start.
What changes with AI workloads
Traditional monitoring assumes that the code defines the behavior. Agents break that assumption in four ways:
- Behavior changes without a release. A model update,refreshed knowledge base, or a new tool can change what an agent does without going through your deployment pipeline.
- Wrong answers look like the right ones. Agents rarely fail with errors. They return a confident answer from the wrong document or report a task as done when it is never finished.
- Context becomes instruction, and actions carry permissions. Anything an agent reads (a document, a tool description, another agent output) can steer it, and it acts with real credentials on real systems.
- Cost follows reasoning, not traffic. Steps, retries, and reasoning tokens set for the bill, so the same request volume can cost very different amounts from one day to the next.
This is how agentic systems normally behave, which is why observability has to span every layer.
The framework
An agent never runs in isolation. It is part of an application, calls models, and runs on infrastructure, and a problem rarely stays in the layer where it shows up. The framework has two dimensions. The first is the four layers an agent depends on, from the top down:
- Application: the application code, and the services, APIs and data stores it calls
- Agentic: the agents and the tools, retrieval, memory, and protocols they use
- Model: managed or self-hosted inference
- Infrastructure: the compute that hosts the agents and the models
The second dimension is how a layer can fail. Any layer can stop working or give wrong answers, spend more than it should, or reach data it shouldn’t. So the framework tracks three cross-cutting concerns in every layer:
- Reliability and Quality: does it work and give the right answer
- Cost: what it spends
- Security and Governance: what it can reach, and who approved it
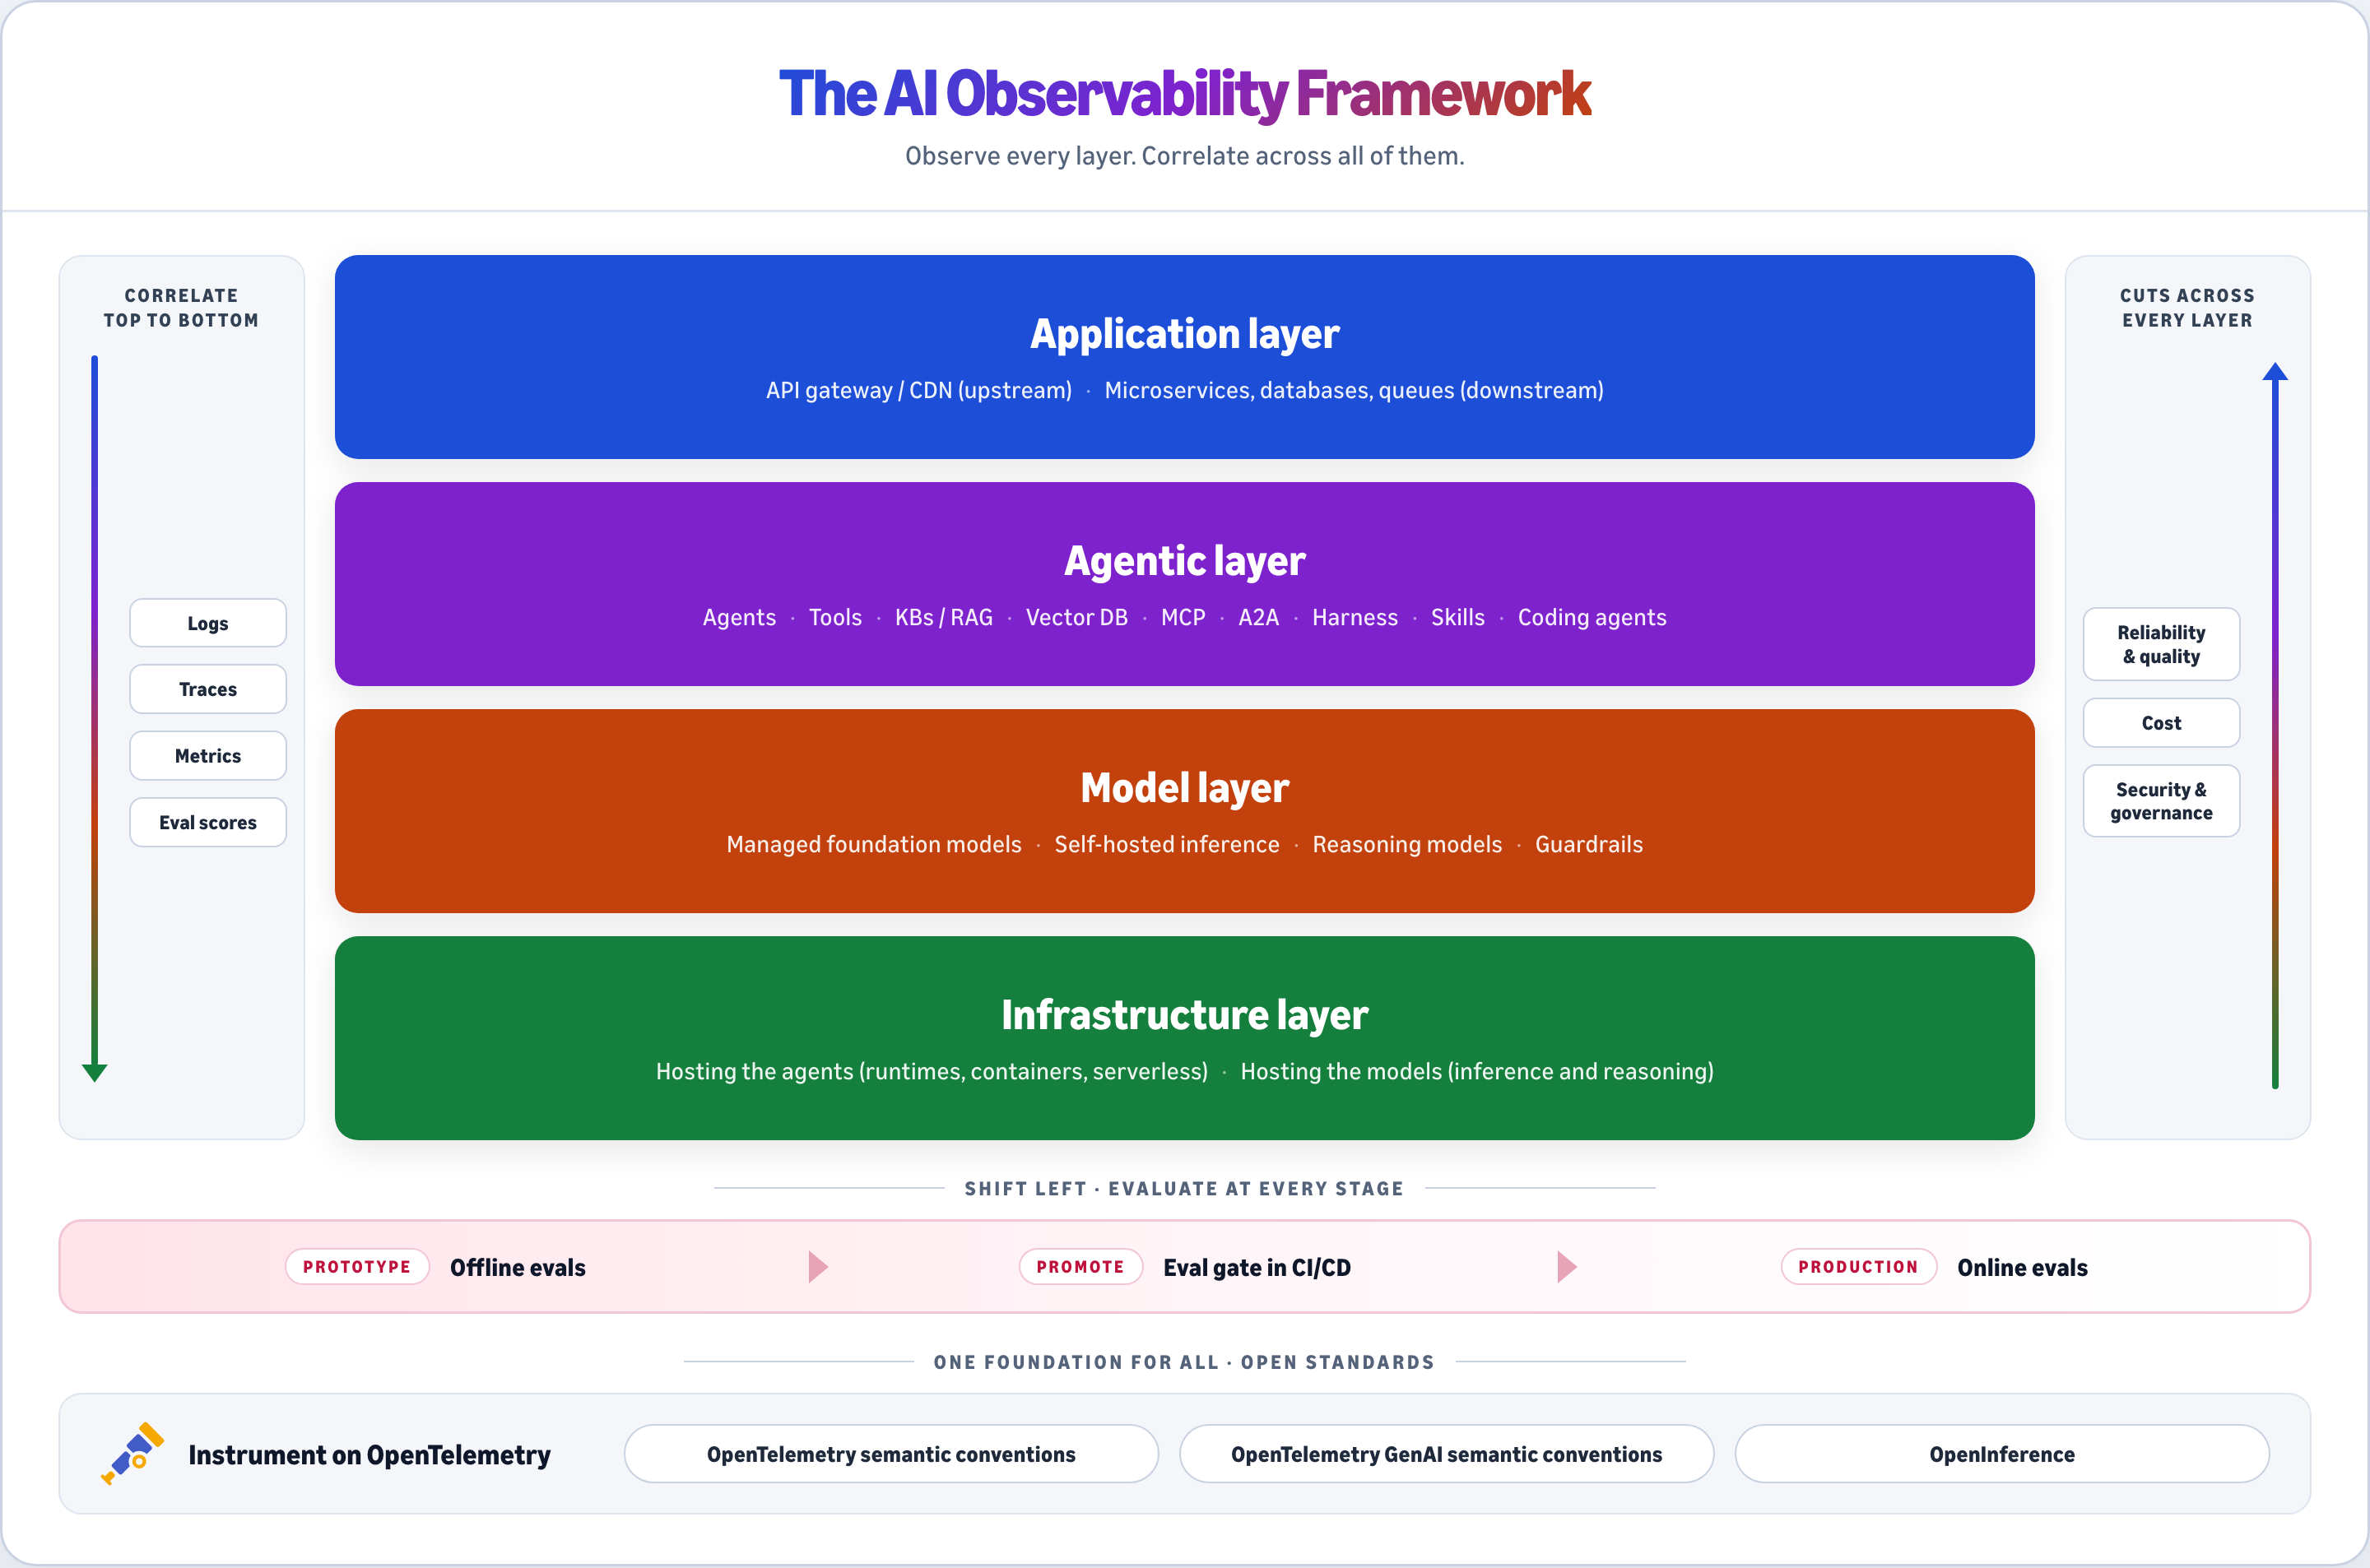
Figure 1: The AI Observability Framework
Each layer in the above framework addresses the below four questions
- Scope: What does the layer cover?
- Failure patterns: What goes wrong, for each concern?
- Detection signals: How do you know it’s happening?
- Response: What do you do about it, and where do you start?
Observe each layer
1. The application layer
Many of the problems users notice first, such as slow or failed answers, start in the services around the agent, not in the agent itself.
Scope. The application the agent is part of: the application code and user-facing surface, the gateways and content delivery upstream, and the microservices, databases, queues, and caches downstream that the agent calls. Most teams already monitor this layer well. The gap is that agent telemetry usually lives somewhere else.
Failure patterns:
- Reliability and quality: a slow or failing downstream service makes the agent look slow; a stale cache feeds the agent outdated data.
- Cost: retries against a slow service multiply model calls and tokens.
- Security and governance: the agent writes to systems of record with no audit trail, or calls APIs without per-request authorization.
Detection signals:
- Request rate, errors, and duration for every service the agent calls
- Database query latency, slow queries, and connection-pool saturation
- Queue depth and consumer lag for work the agent hands off
- Cache hit rate and freshness for data the agent reads
- Writes to systems of record, tagged with the agent’s identity
Response. Start by extending the distributed tracing you already have, so agent spans join the same trace as the services around them. A user asks a support agent where their refund is, and the reply takes eleven seconds. A connected trace shows nine of those seconds went to a slow query in the payments database, two calls below the agent. From there, alert on pool saturation and queue lag, and log every agent write with the identity that made it.
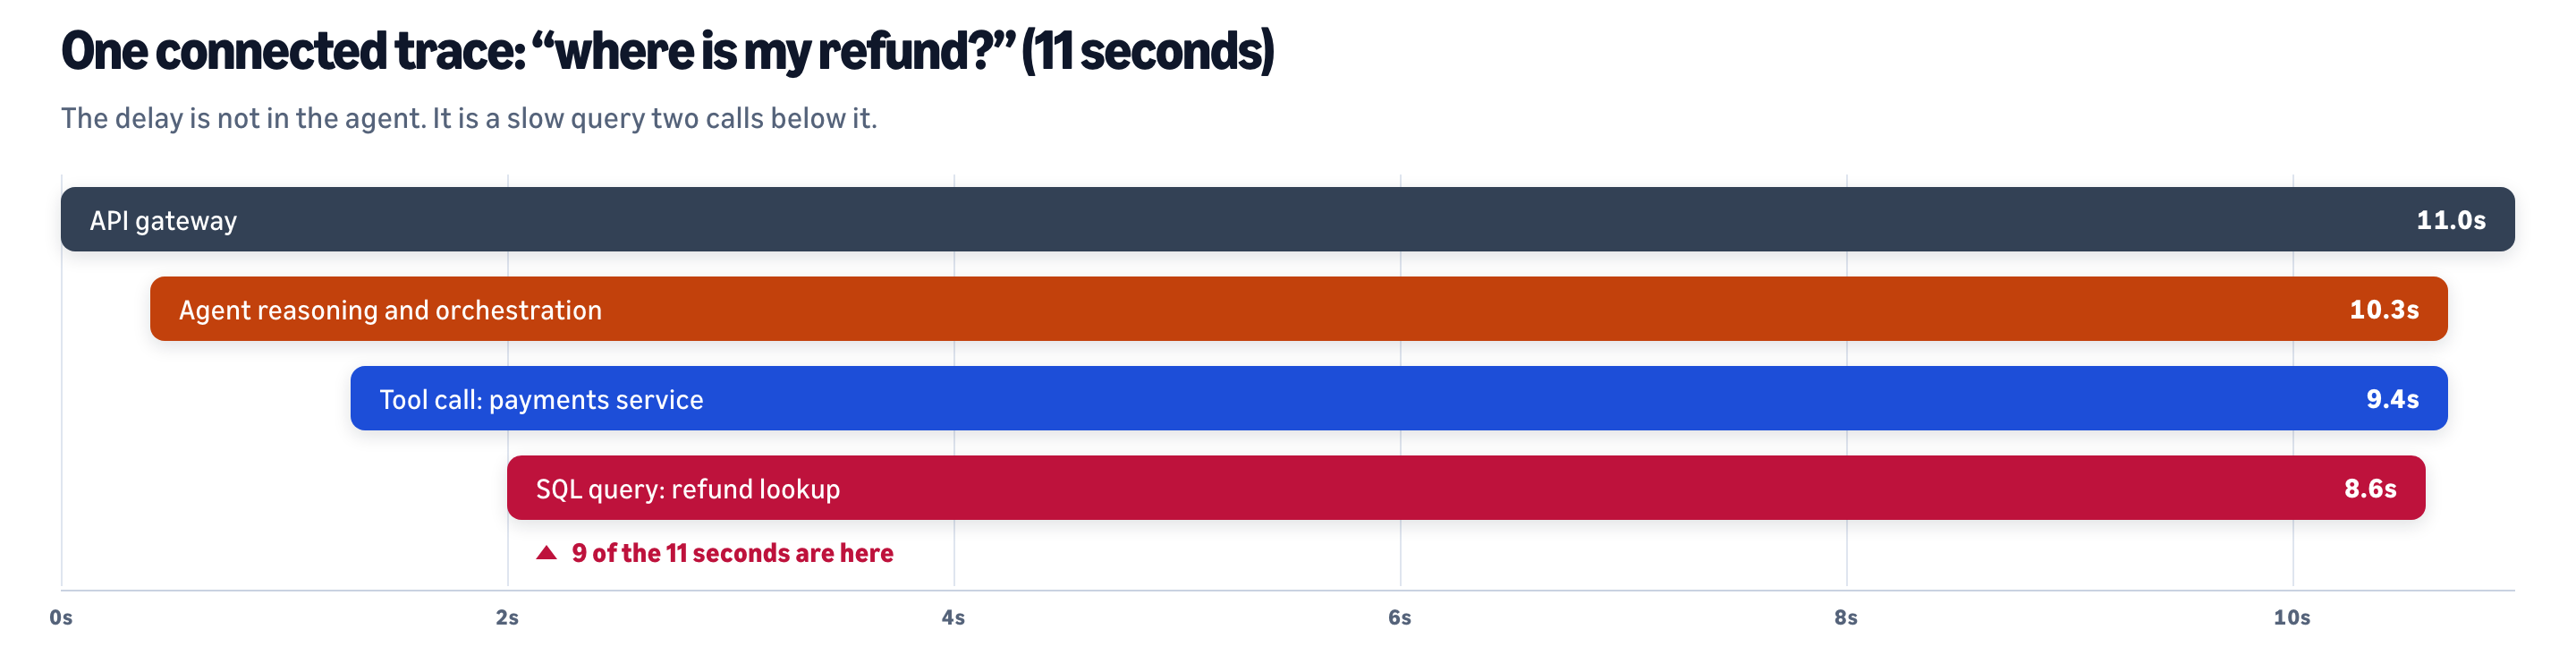
Figure 2: One connected trace locates the delay two calls below the agent
2. The agentic layer
This is where agents fail without errors. The service is healthy, and the behavior is wrong.
Scope. Everything that turns a model into an agent: the agents, the tools they call, the knowledge bases behind retrieval, the protocols that connect them (Model Context Protocol for tools, agent-to-agent for delegation), and the coding agents your developers use. At the center is the harness, the runtime that builds the context, runs the loop, calls tools, handles errors, saves state, and enforces approvals.
Failure patterns:
- Reliability and quality: a confident answer from the wrong document, the same search repeated with rephrased inputs, calls to tools that don’t exist, an instruction lost when the harness compacts context, or a task reported done that never finished.
- Cost: steps, retries, and sub-agents that multiply with no limit.
- Security and governance: instructions hidden in a retrieved document or tool output that steer the agent, and actions outside the agent’s intended scope.
Detection signals:
- The trace tree, with one span per reasoning step, tool call, retrieval, and handoff, tagged with model, prompt, tool, and harness versions
- Tool calls per task, error rate per tool, and invalid or nonexistent tool calls
- Steps per task against the task’s normal range, repeated actions, and whether each run reaches a terminal state
- Retrieval relevance, and how well the answer is grounded in what was retrieved
- Context-window use and compaction events
- Approval gates requested, granted, and denied, and where each input in the context came from
- Task success, faithfulness, and safety scores on the same trace as latency and cost
- For coding agents: cost per developer, and how much generated code survives review, passes tests, and clears security scans
Response: Shift left your observability
Agent observability works best when it starts in development, not after launch. Instrument the first prototype and let the same traces and evaluators follow the agent through promotion into production. What production teaches you then goes back into development.
- During prototyping, trace every run from the first build. Put together a small set of real tasks and run on-demand evals against it, scoring both the final answer and the path the agent took to get there. Use a judge model from a different family than the one under test and check its scores against human labels before you trust them.
- Before promotion, make evals a gate in CI/CD. Any change to a prompt, model, tool definition, or harness runs against your regression set, and ships only if quality holds. An eval failure blocks a release the same way a failing test does.
- In production, run online evals on a sample of live traffic and watch the trends, since slow drift hides in normal variation. Set a hard cap on steps and cost per run. Have people review and label the traces that fail and add each new failure to your evaluation set. That closes the loop back to the next build.
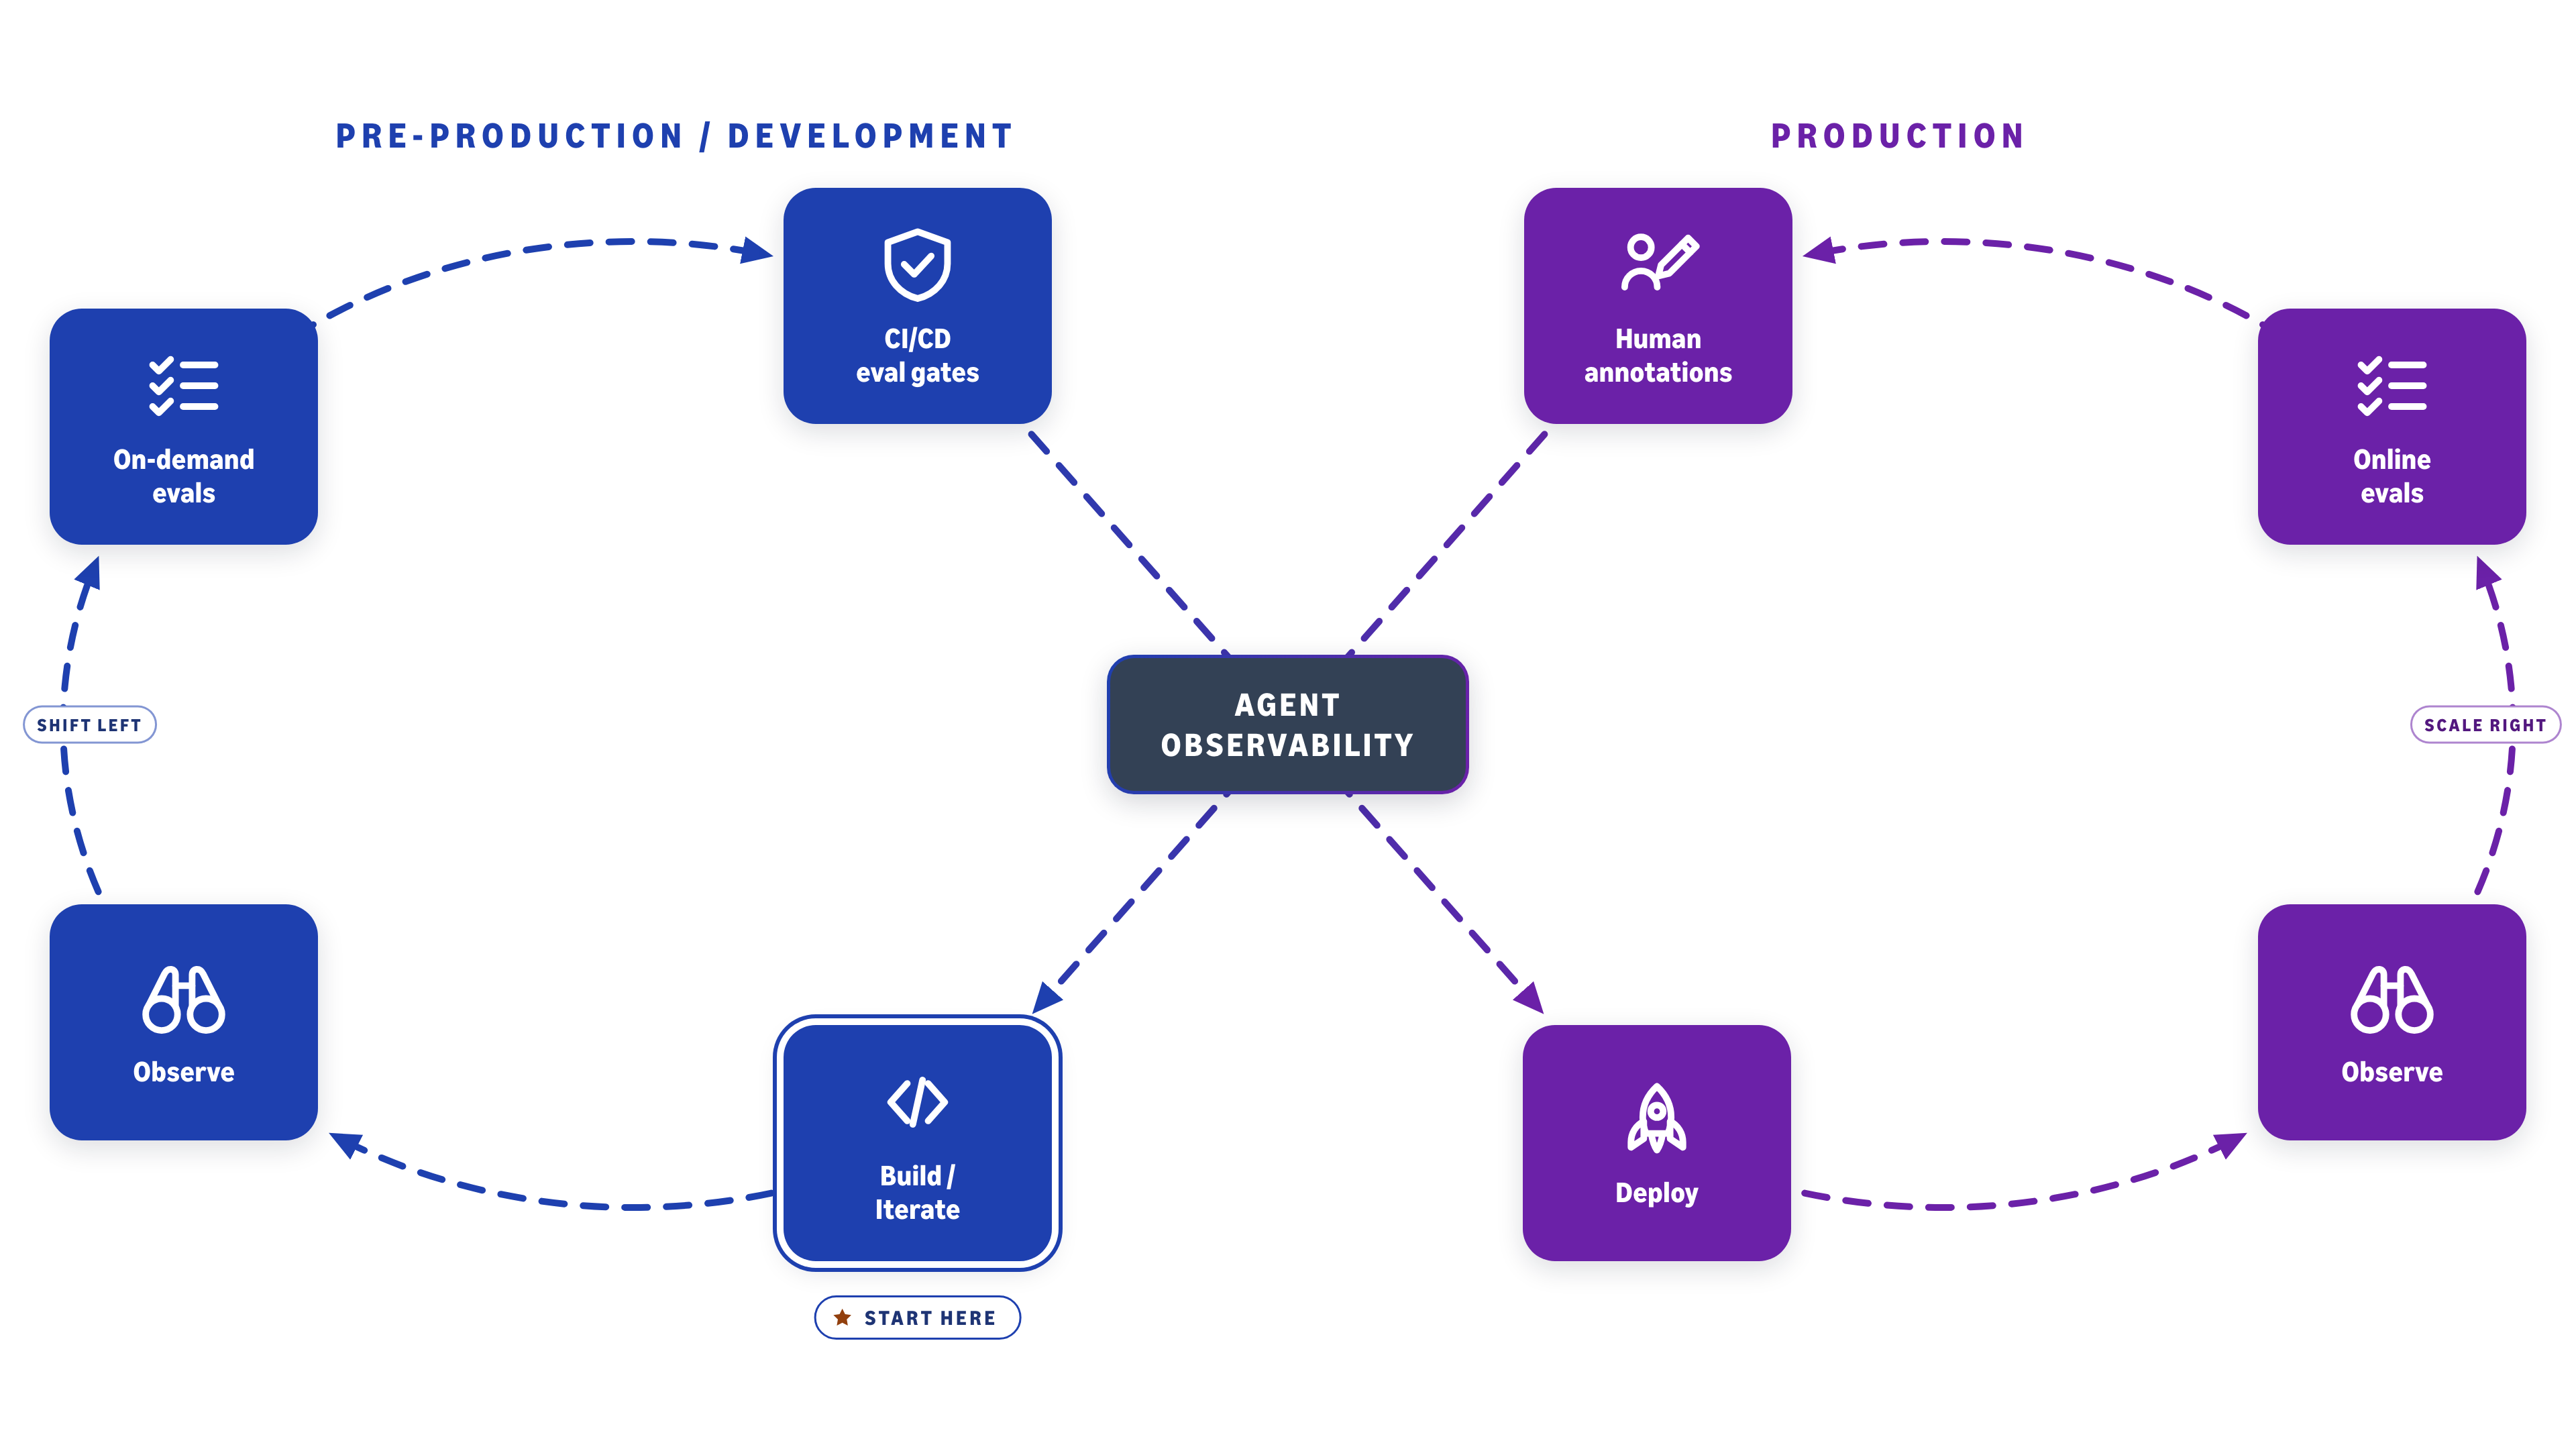
Figure 3: Shift left your observability to development
3. The Model Layer
Model calls drive most of an agent’s latency and cost, and a single run often calls more than one model.
Scope. A single agent run can call several models: a reasoning model to plan, a decision model that routes or checks a step with a confidence score, embedding and reranking models for retrieval, and models constrained to a fixed output format. Any of these can be managed or self-hosted. If you watch only the main large language model (LLM), most of the decisions in a run go unobserved.
Failure patterns:
- Reliability and quality: confident routing decisions that turn out wrong, retrieval that slowly drifts, and responses that are truncated or break the required format.
- Cost: reasoning tokens the user never sees, and lost prompt-cache hits.
- Security and governance: guardrails that block legitimate requests or miss unsafe ones, sensitive data in prompts and responses, and model versions that change without review.
Detection signals:
- Time to first token (TTFT), tokens per second (TPS), and total response time, plus per-call latency for decision, embedding, and reranking models
- Tokens by type (input, output, reasoning) and cache hits
- Cost per call, attributed to the agent, task, and team
- Quota use, throttling, and provider errors
- Refusals, truncation, and schema breaks
- Decision-model confidence against observed accuracy, and how often it abstains
- Embedding drift against a baseline, and changes in ranking
- Guardrail interventions, false blocks, and misses
Response. Start by capturing latency, tokens, and cost on every model call with OpenTelemetry (OTel) generative AI (GenAI) attributes, tagged with model ID, version, and role in the run (planner, router, judge, retriever). Then add throttling and guardrail signals as you move to production, and run any new model through the agent’s evals before you switch.
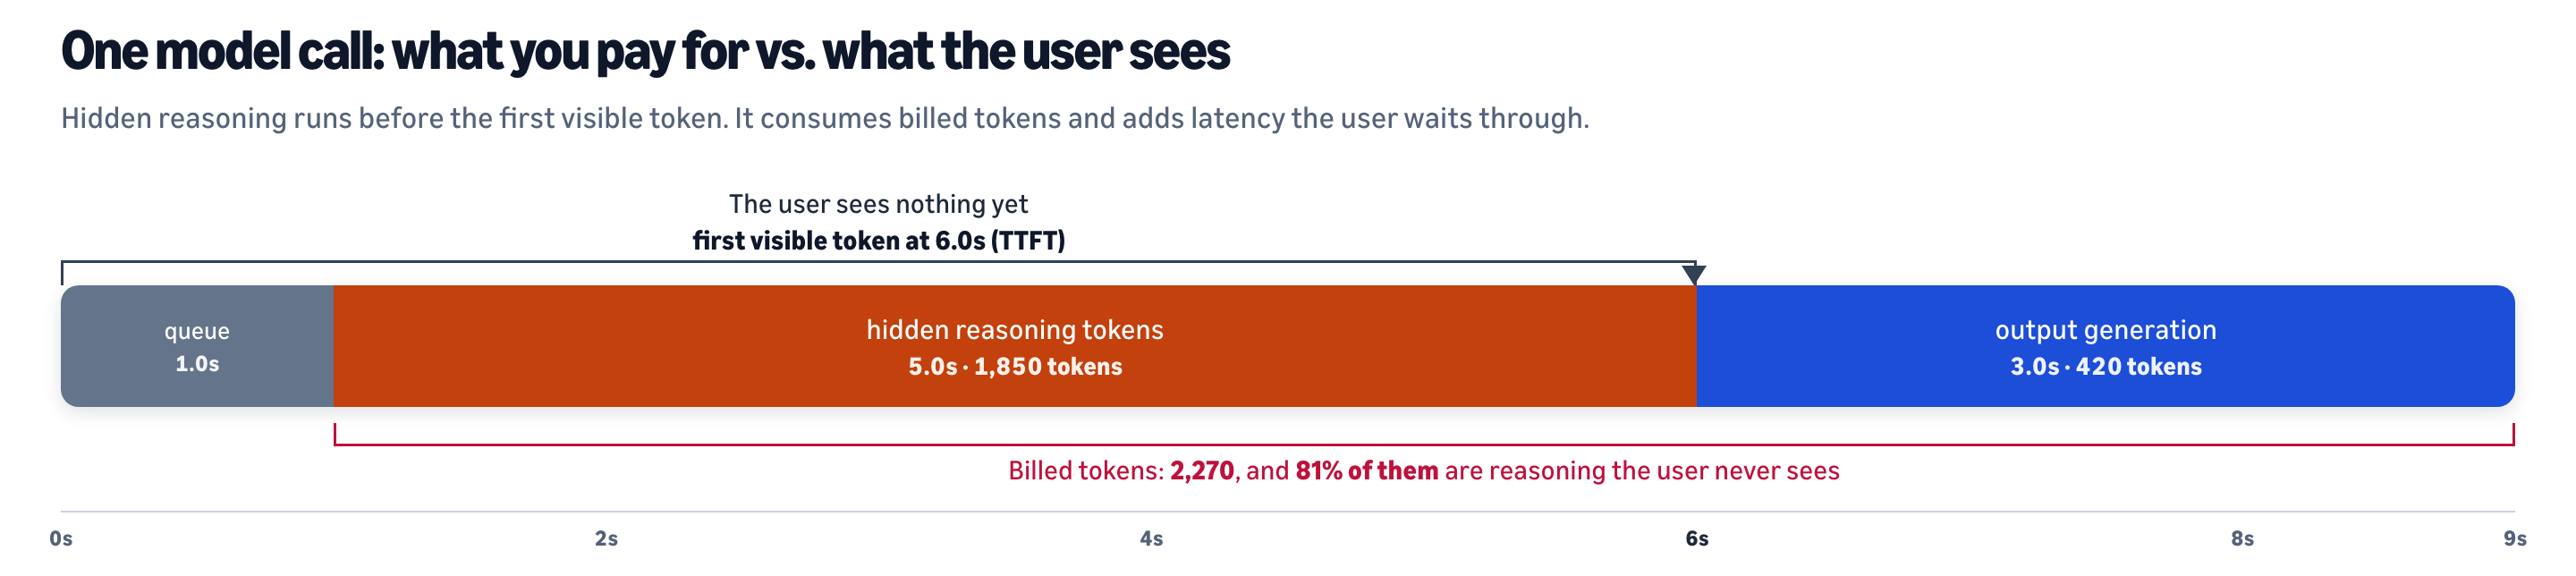
Figure 4: Hidden reasoning sits between the request and the first visible token
4. The infrastructure layer
Infrastructure problems rarely show up where they start. They surface a layer or two up, as a slow agent or one that loses its place mid-task.
Scope. Hosting the agents (containers, serverless functions, or managed agent runtimes) and hosting the models you serve yourself. With managed foundation models, the provider runs the accelerators and serving stack, and you still own the agent runtime, and the data services it depends on.
Failure patterns:
- Reliability and quality: a restarted container drops an agent’s session mid-task, a slow vector store looks like a slow agent, and on self-hosted models, memory pressure evicts cached context and degrades answers.
- Cost: idle or over-provisioned GPU capacity.
- Security and governance: over-privileged credentials on agent runtimes, and unreviewed changes to runtimes or serving.
Detection signals:
- Agent runtime CPU and memory, restarts and out-of-memory kills, cold starts, and whether sessions survive a restart
- Vector store latency, availability, and index freshness
- Serving queue depth, batch size, and preemptions (self-hosted)
- GPU utilization, key-value (KV) cache use and evictions, thermal throttling, and memory errors (self-hosted)
Response. Start with runtime health, session continuity, and vector store latency for every agent. If you self-host models, add queue depth and KV cache utilization, scale on queue depth instead of CPU, and correlate eviction rate with TTFT. Persist session state outside the container so restarts don’t erase an agent’s work.
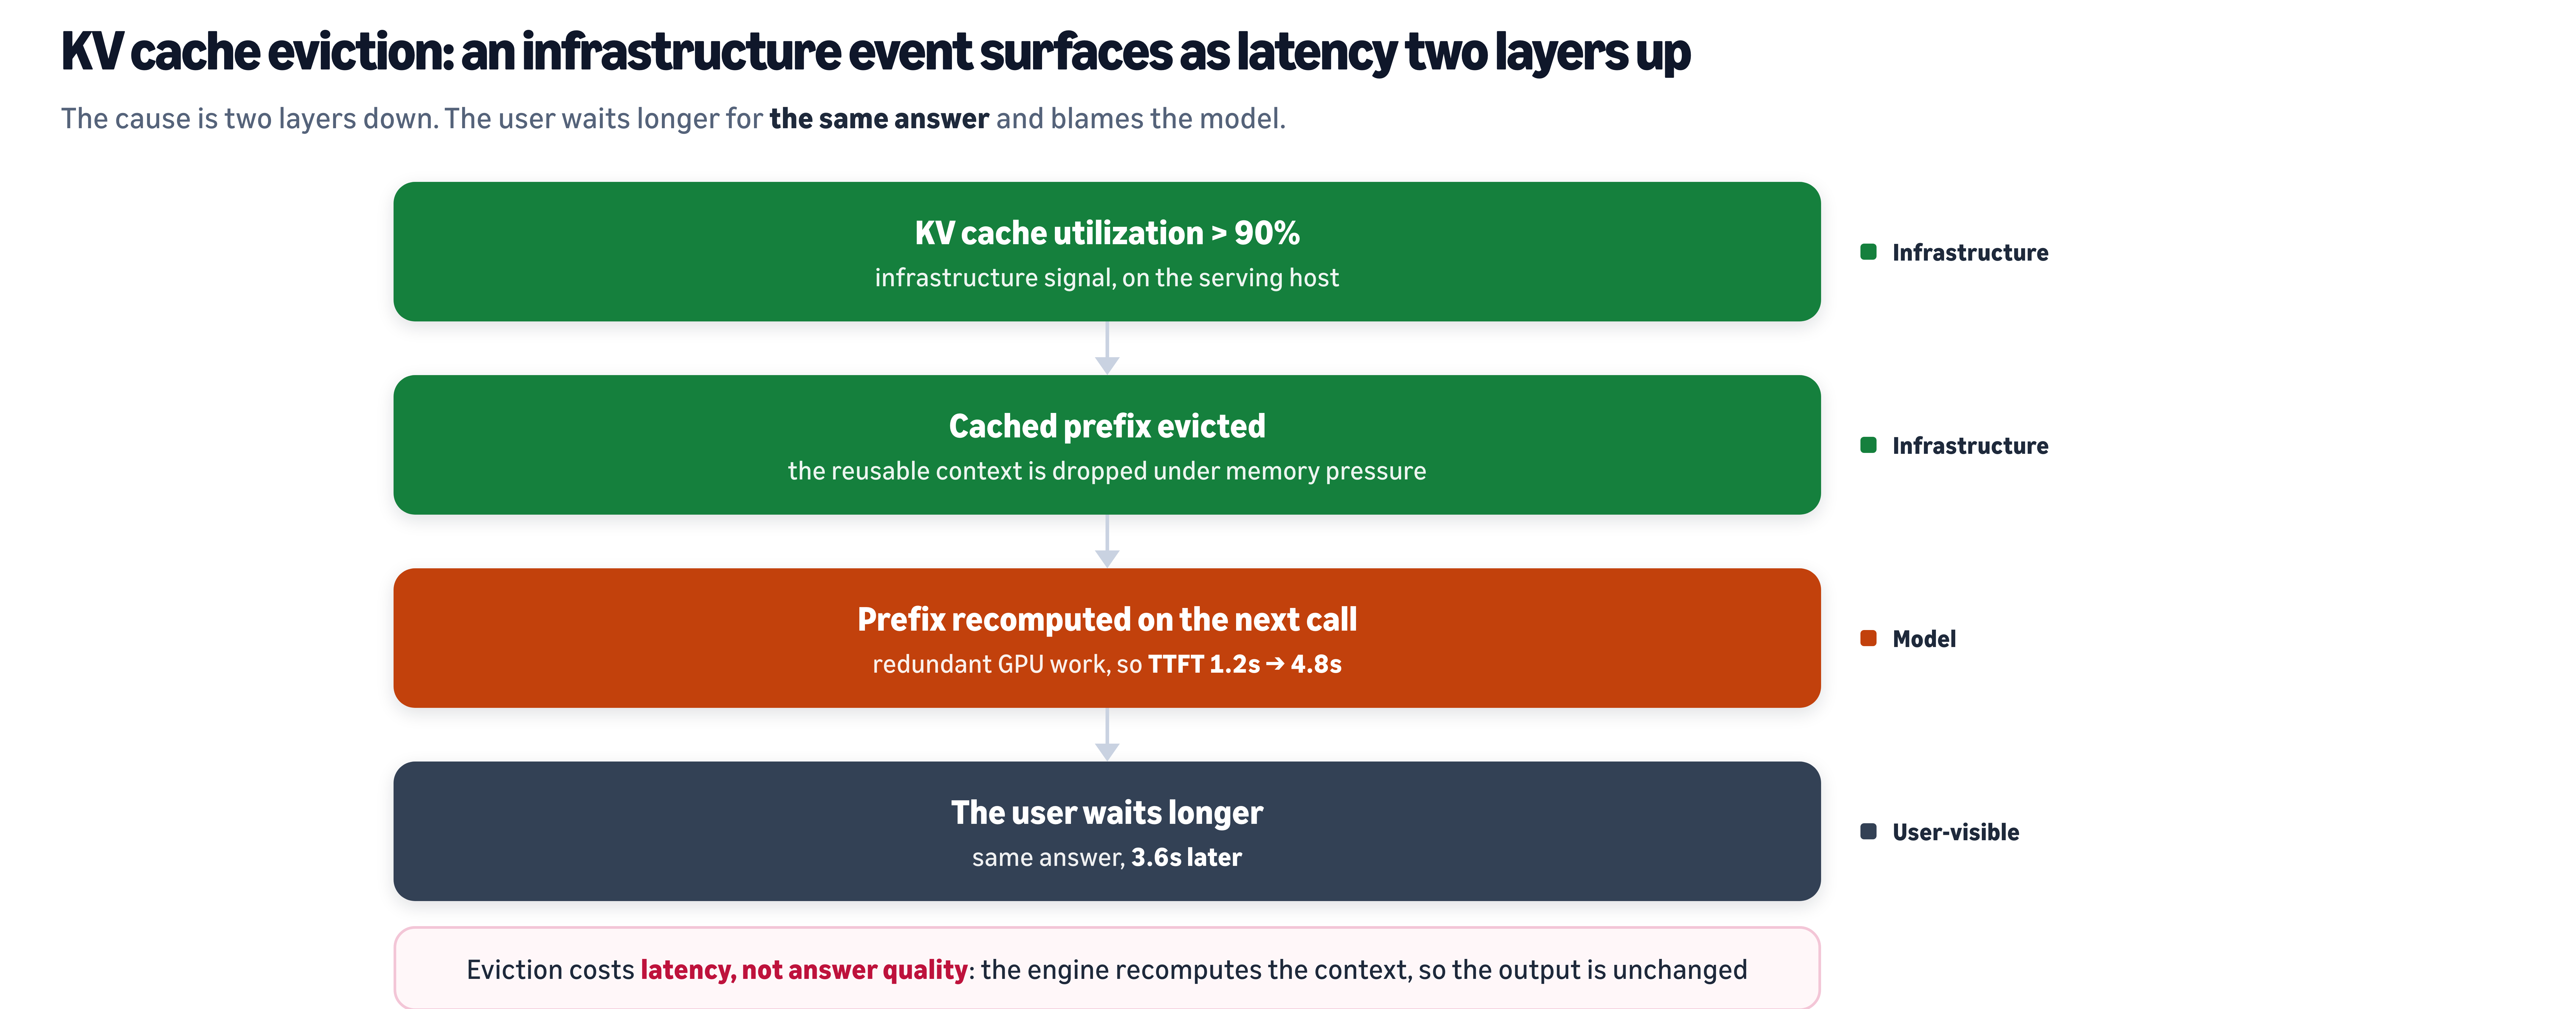
Figure 5: An infrastructure event surfaces as a quality problem two layers up
Work across the layers
1. Correlate the signals
Signals at each layer tell you what is happening there. The most valuable insight comes from the connections between layers, and you can’t see those across four separate dashboards.
Two things make cross-layer observability work:
- Shared trace context: logs, traces, metrics, and profiles carry the same identifiers, so one request can be followed from the user action through the agent’s reasoning, the model calls, and the downstream services, down to the host underneath.
- A dependency map: agents, tools, MCP servers, knowledge bases, models, services, and databases all appear on one graph, with the relationships discovered from telemetry rather than drawn by hand.
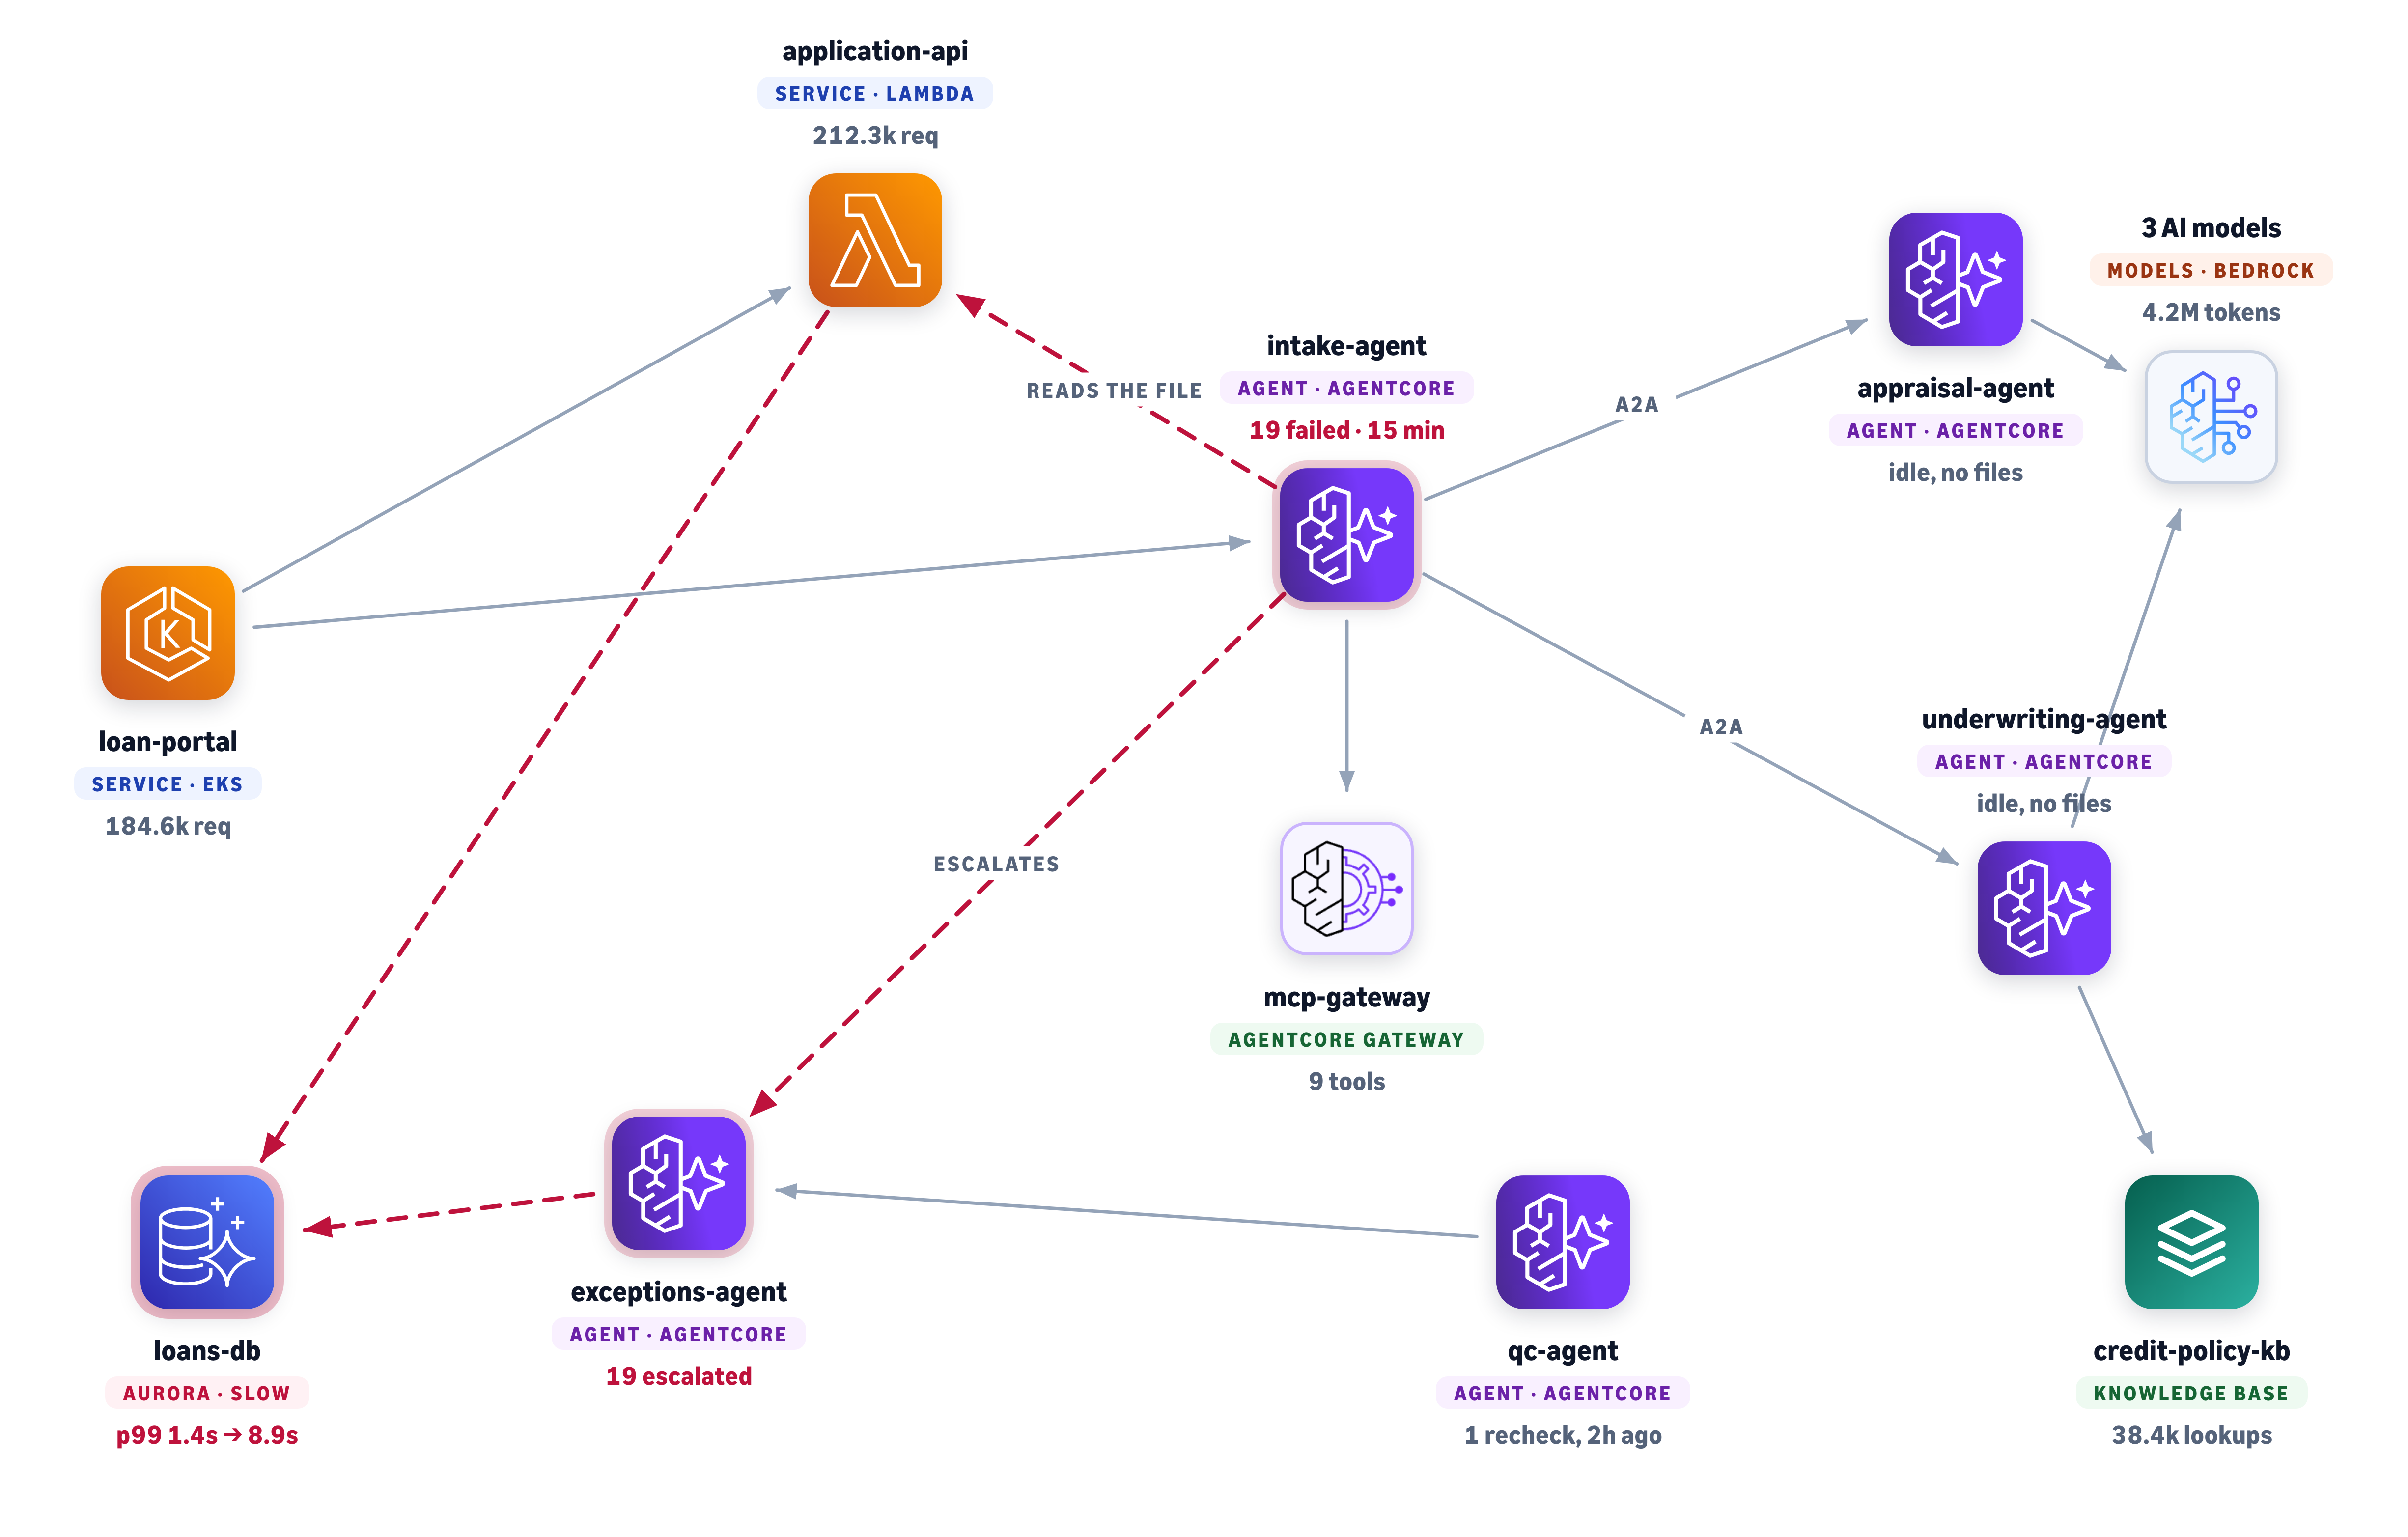 Figure 6: Agents, tools, models and databases on one graph, discovered from telemetry
The map supports impact analysis in both directions. When a database slows down, you can see every agent and application that depends on it. When an agent misbehaves, you can see everything it touched. As multi-agent systems grow, the map is the practical way to understand how a request actually moves through dozens of components.
2. Standardize on OpenTelemetry
Cross-layer correlation only works if every layer describes its telemetry the same way, and OpenTelemetry provides one. Its SDKs and standard semantic conventions already cover the application and infrastructure layers, and the OpenTelemetry GenAI semantic conventions add a shared vocabulary for model calls, agent invocations, tool executions, and token usage. OpenInference builds on OpenTelemetry with instrumentation libraries for popular agent frameworks and model providers, plus attributes for retrieval and evaluation. Because both emit standard OpenTelemetry traces, their spans join the same trace as the rest of your application.
Open standards matter because the rest of the stack keeps changing. Teams switch orchestration frameworks, change model providers, and move between observability backends. Telemetry built on open standards survives each of those changes, so the instrumentation you write for the first prototype keeps paying off.
3. Keep agents accountable
Accountability rests on two practices that span every layer.
- Match oversight to the autonomy you grant: An agent that only reads needs traces and quality scores. An agent that changes systems needs approval gates on high-risk steps, an audit trail for every action, and circuit breakers that act on quality, cost, and action rate together.
- Protect the traces themselves: Redact PII before traces are stored, set how long they’re kept, keep every error and low-scoring trace, and sample the rest. Budget for evaluations too, since judge models have their own bill.
Are you ready?
Ask yourself five questions:
- Can you follow one request from the user through the agent to the database behind it?
- Can you explain why an agent made a decision within minutes of an incident?
- Does every change to a prompt, model, tool, or harness pass an evaluation gate?
- Do you know which team, workflow, and version drove last month’s spend?
- Could you produce an audit trail of every agent action from the last 90 days?
Each "no" points to the layer to invest in next. You can also give these questions to a coding agent connected to your accounts and telemetry, and have it list what’s missing.
Conclusion
Observing agents in production means following one request through every layer it touches. For each layer, know its failure patterns across reliability, cost, and security, watch the signals that detect them, and act on what they show. Connect the layers through shared traces and a dependency map, score quality from the first prototype onward, and build on open standards so the work outlasts your next framework or provider change.
Amazon CloudWatch Omni follows the same approach. Built on OpenTelemetry, it brings AI agents, applications, and infrastructure into one view, whether they run on AWS or in other clouds. Omni discovers dependencies from your telemetry, and scores agent quality on the same trace as latency, errors, and token usage. Developers can work with those traces while they build, through the Omni IDE extension, and operators see the same traces in production in the Omni web UI. To see Omni in action, explore the interactive demos.