AWS Cloud Operations Blog
Announcing AWS CloudTrail Event Aggregation and Insights for Data Events
AWS CloudTrail records API calls and events for your AWS account, providing audit trails for governance, compliance, and operational troubleshooting. Customers can also enable data events in CloudTrail to gain deeper visibility into resource-level operations. These include Amazon S3 object-level operations (such as GetObject/PutObject) or AWS Lambda function invocations. Data events help detect unauthorized access, investigate security incidents, and meet compliance requirements that demand detailed activity logs beyond control plane operations.
Data events represent critical touchpoints in your AWS infrastructure. Whether it’s an Amazon S3 object access, an Amazon DynamoDB operation, or an AWS Lambda invocation, understanding these events are essential for security, compliance, and operational excellence. However, these events can produce massive volumes of data, significantly increasing cost and storage requirements for downstream workflows. Organizations often face significant challenges in this area: many find it difficult to reduce the amount of data sent to their downstream systems, or they struggle to identify anomalies in data events and respond quickly when anomalies occur. These challenges can create unnecessary cost burdens, slow down troubleshooting efforts, and leave potential security risks unaddressed.
Today, we’re excited to introduce two powerful additions to AWS CloudTrail that transform how you monitor and act on data events: CloudTrail event aggregation and insights for data events. Each capability addresses distinct customer needs. Event aggregation helps optimize data volume for downstream workflows and makes it easier to identify changing patterns in your API activity, while CloudTrail Insights helps you identify anomalies in data events for enhanced security monitoring. Whether you’re optimizing your infrastructure costs, meeting compliance requirements, or investigating a security incident, these independent features provide targeted solutions without overwhelming your teams with raw log data.
In this post, we’ll explore how these new capabilities work and walk through how you can analyze and create actionable insights for these types of events.
Prerequisites
This walkthrough requires an existing CloudTrail trail with data events enabled. You can also enable aggregated events and insights events directly when creating a new trail. Also, these two new features do incur an additional cost for CloudTrail. For more information on pricing, visit AWS CloudTrail pricing.
Note: Data events are required to be enabled in your trail to use event aggregation and insights for data events.
Event Aggregation
Setting up CloudTrail Event Aggregation for Data Events
CloudTrail event aggregation consolidates data events into 5-minute summaries, providing visibility into key trends such as access frequency, error rates, and most frequently used API actions. This summarization approach significantly reduces the volume of data transmitted to downstream analysis systems while preserving essential insights for security monitoring and operational oversight.
In this sample scenario, we will demonstrate how to enable aggregation in your trails capturing data events through an existing trail.
- Navigate to the CloudTrail console.
- In the left-hand navigation menu, choose Trails.
- Choose your Trail for CloudTrail events.
- Under Aggregated events, choose Edit.
- Under Aggregation templates, you can select any of the below out of the box templates to aggregate your data events.
-
- API Activity, to get 5 minutes summary of your data event based on the API calls made. Use this to understand your API usage patterns, including frequency, callers, and source.
- Resource Access, to get the activity patterns on your AWS resources. Use this to understand how your AWS resources are being accessed, how many times they are being accessed in the 5-minute window, who is accessing the resource, and what actions are being performed.
- User Actions, to get activity patterns based on IAM principals making API calls in your account.
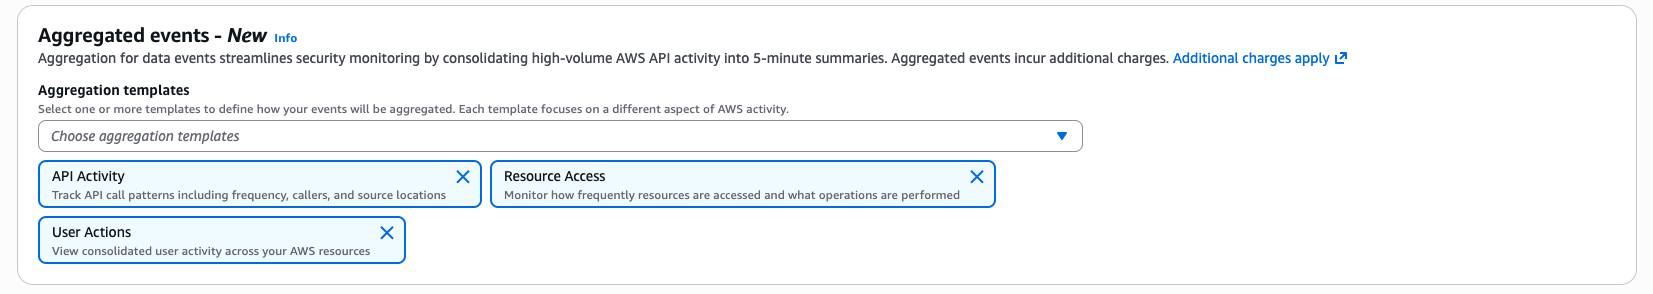
Figure 1: AWS CloudTrail aggregated events
- Choose Save changes.
CloudTrail will start to aggregate all data events for resources defined under the trail. (Note: This feature can also be setup when creating a new trail).
Analyzing CloudTrail Aggregated Events
Aggregated events will be delivered to a CloudTrail-Aggregated folder within the S3 bucket you have configured for your trail. You can then query these events from the S3 bucket using Amazon Athena or CloudWatch Log insights if you have your CloudTrail events delivered to CloudWatch Logs.
Let’s take a look at how we can use CloudWatch Log insights to query for aggregated events with API activity aggregation template to show the aggregated count of API activity over a 5min period. Then it will show which user identity and resources contributed to the overall activity.
- Navigate to the CloudWatch console.
- In the left-hand navigation menu, choose Logs Insights.
- Under the Query definition section, choose SQL.
- Copy the below query and paste it into your editor window. (Note: you must replace [Log Group] with the name of your log group for CloudTrail).
SQL Query:
- Click Run query and then your results will be shown.
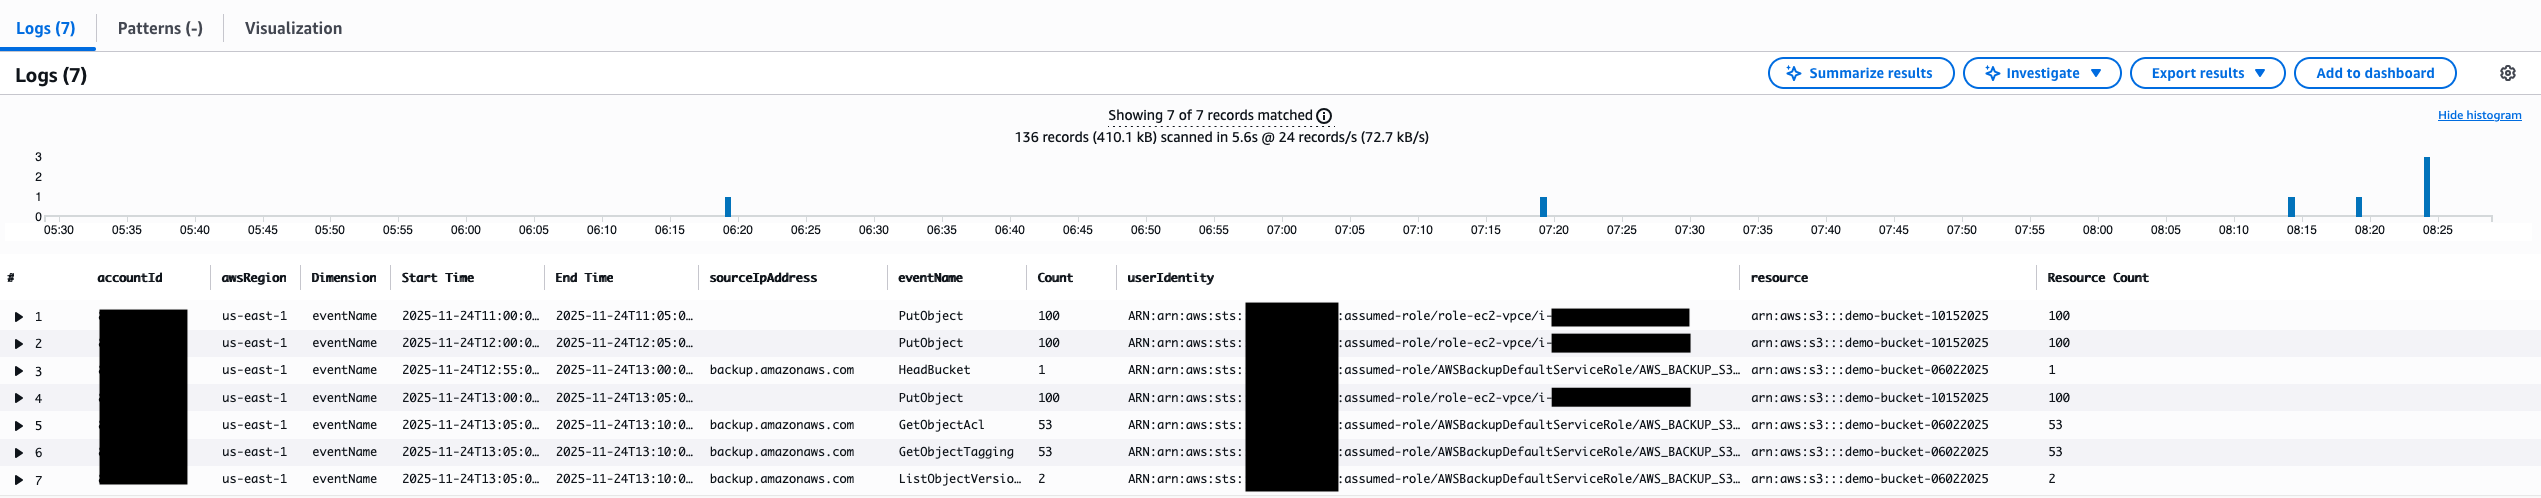
Figure 2: CloudWatch logs insights query results
The query results show API actions and overall count taken for each aggregated event period. It will also show additional statistics as to the user and resources that contributed to the overall count of the API activity. Additionally, you can run a similar query that will show events associated with the Resource Access and User Access aggregation template for additional analytics.
Sending Aggregated Events downstream using Subscription Filters
Event aggregations will consolidate data events into 5-minute summaries providing an overall count and showing key statistics as to what user identity, API activity or resources contributed to the overall count that was capture during the event aggregations. For more details on fields within an event aggregation record, see CloudTrail record contents for aggregated events documentation. Below is an example of the reduced volume of events that event aggregation provides in comparison to data events.
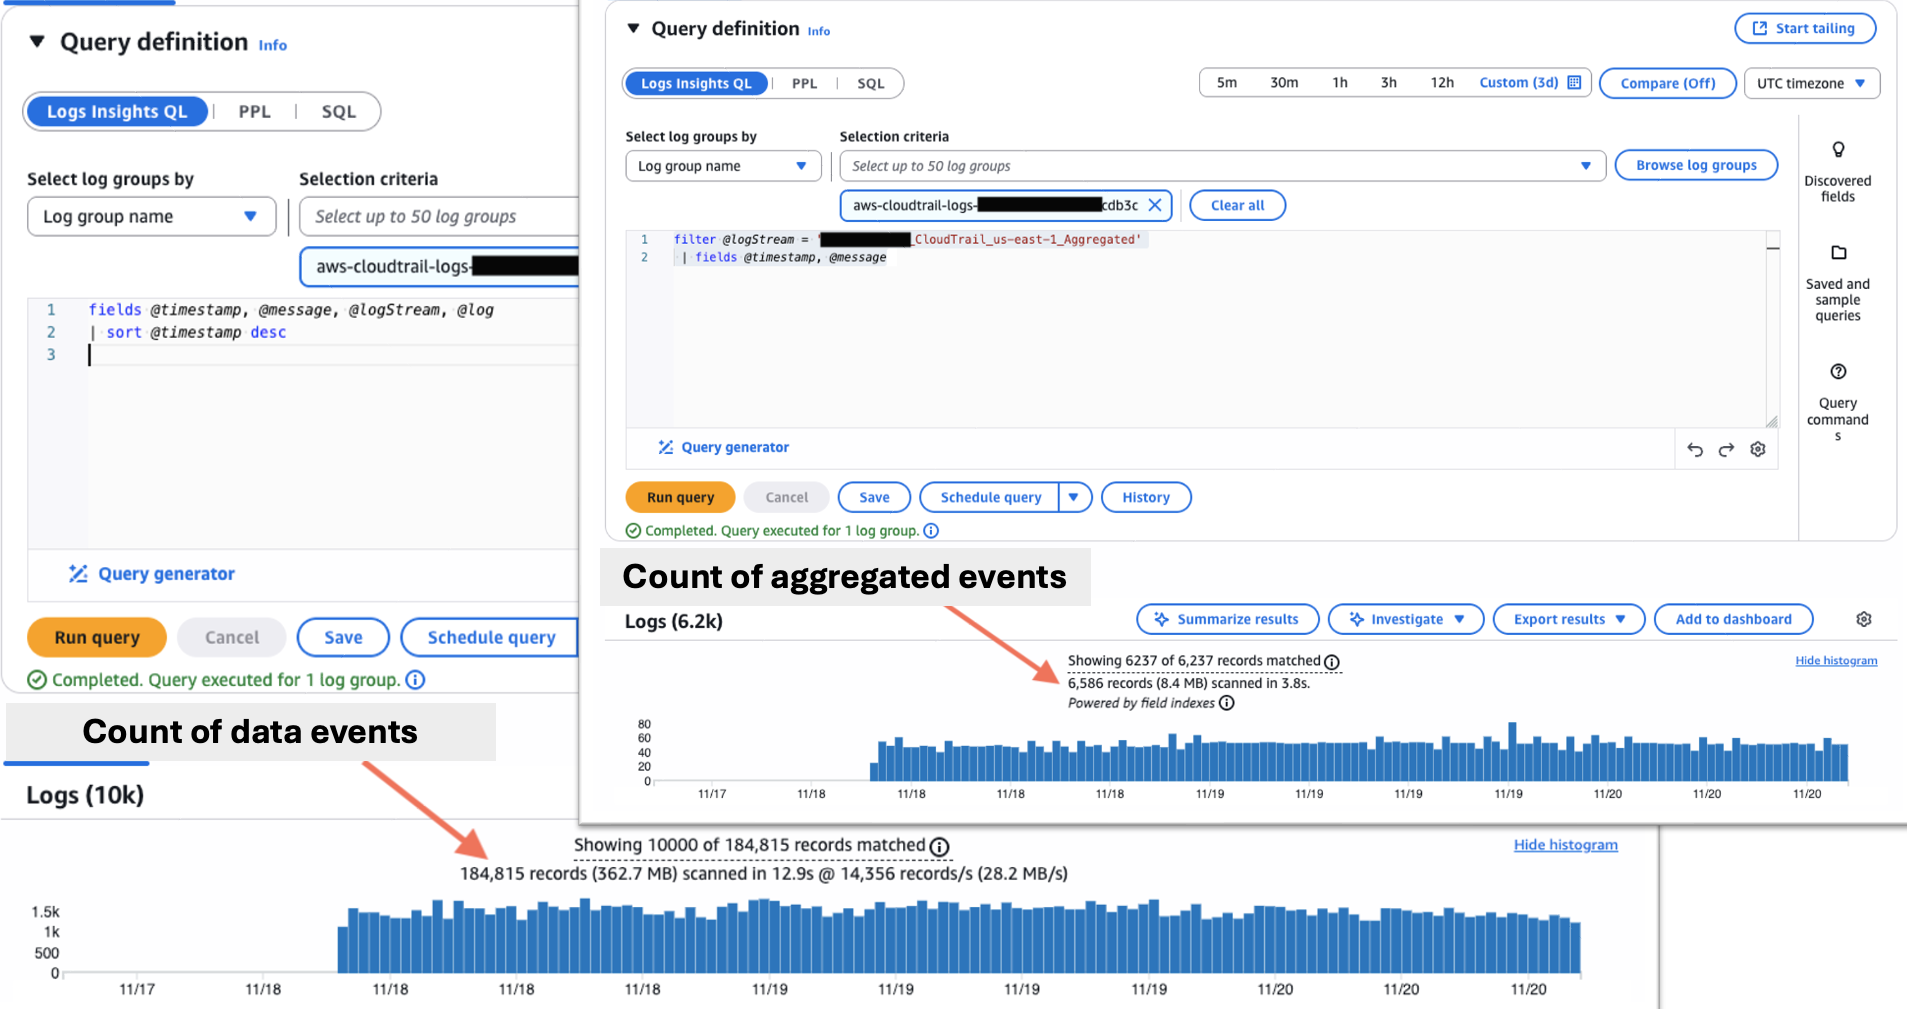
Figure 3: Comparison of total data events vs total aggregated events in CloudTrail
For CloudTrail logs, we can create subscription filters to send aggregated events vs data events from CloudWatch Logs to destinations like Kinesis Data Streams, Kinesis Data Firehose, Lambda functions, or Amazon OpenSearch Service reducing the overall volume that is sent to downstream systems.
Let’s take a look at how we can set up a subscription filter to send only management and aggregated events for CloudTrail.
- Navigate to the CloudWatch console.
- In the left-hand navigation menu, choose Log Groups.
- Select the Log Group used for CloudTrail.
- Choose the Subscriptions filters tab.
- Choose Create and select either Amazon Kinesis Data Streams, AWS Lambda, Amazon Data Firehose, or Amazon OpenSearch Service for your subscription filter.
- Then use the below log format and filter pattern for your subscription filter.
-
- Log format: JSON
- Subscription filter pattern: { ($.eventCategory = “Management”) || ($.eventCategory = “Aggregated”) }
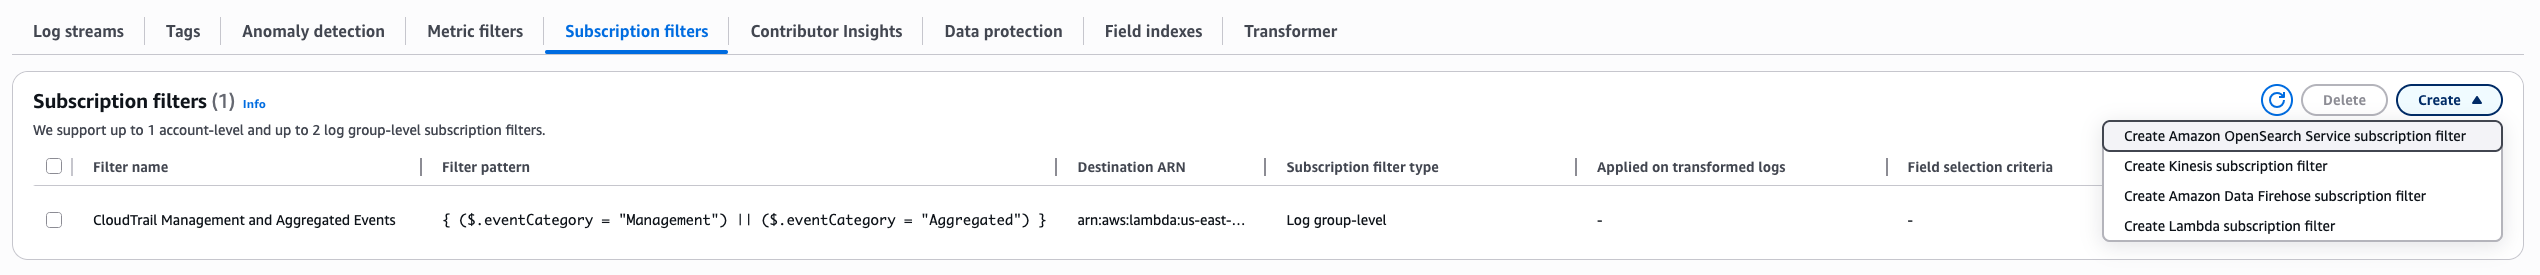
Figure 4: CloudWatch Subscription Filters
Insights for Data Events
Setting up CloudTrail Insights for Data Events
AWS CloudTrail insights is an advanced feature that automatically detects unusual API activity patterns in your AWS account by analyzing CloudTrail events. Previously, this was only on management events but now it’s available to also support data events when identifying changes that differ significantly from your account’s typical usage patterns. When enabled, CloudTrail insights monitors API call rates and error rates, generating insights events when it detects statistically significant deviations such as sudden spikes in resource provisioning, unusual access patterns, or abnormal error rates.
In this sample scenario, we will demonstrate how to set up insights events for data events within an existing CloudTrail trail.
1. Navigate to the CloudTrail console.
2. In the left-hand navigation menu, choose Trails.
3. Choose your Trail for CloudTrail events.
4. Under Insights events, choose Edit.
5. Under Data events Insights types you can select any the options below.
-
- API call rates Insight – This type of Insight is generated when the number of data API calls that occur per minute deviates from the baseline API call rate. Only data API calls that are writes are measured.
- API error rates Insight – This type of Insight is generated when the number of data API calls that are unsuccessful and return an error deviates from the baseline error rate. Data API calls that are both reads and writes are measured.
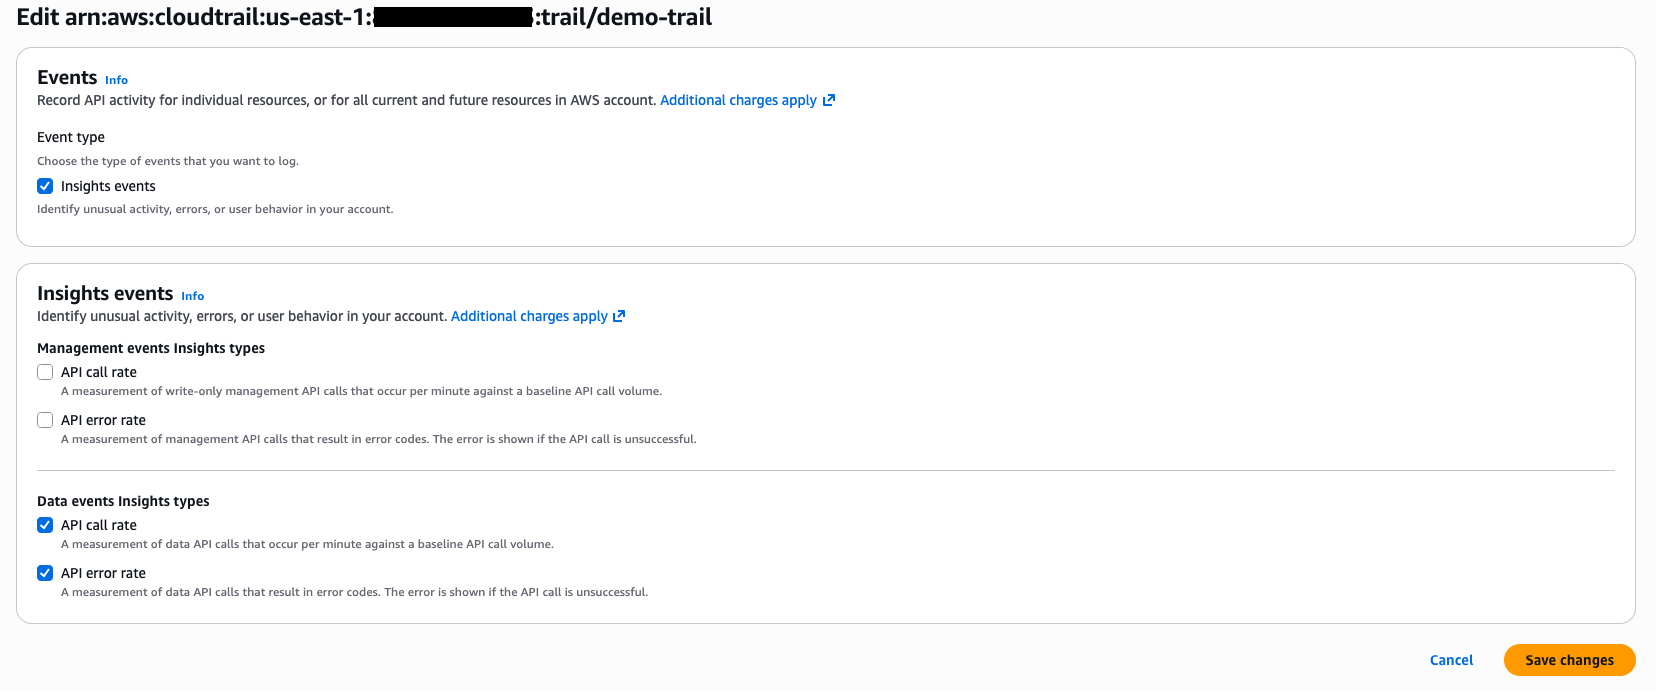
Figure 5: Setup insights events for data events
Once enabled, CloudTrail must first establish a baseline of your normal activity patterns which can take up to 36 hours before the first insights events are delivered, provided that unusual activity is detected during that time. Also, it’s important to note that if you disable and subsequently re-enable insights events, or if you stop and restart logging on a trail, CloudTrail can take up to 36 hours to create new baseline patterns before it can resume delivering insights events.
Analyzing CloudTrail Insights for Data Events
CloudTrail insights events are different than standard CloudTrail events because they are only generated when CloudTrail identifies significant deviations from your account’s usual API activity patterns. Let’s look at how we can view an insights events through the console:
- Navigate to the CloudTrail console.
- In the left-hand navigation menu, choose Insights.
- Select the Data events Insights tab to view the list of Insights events.
- Choose an Insights event in the results list to show its details.
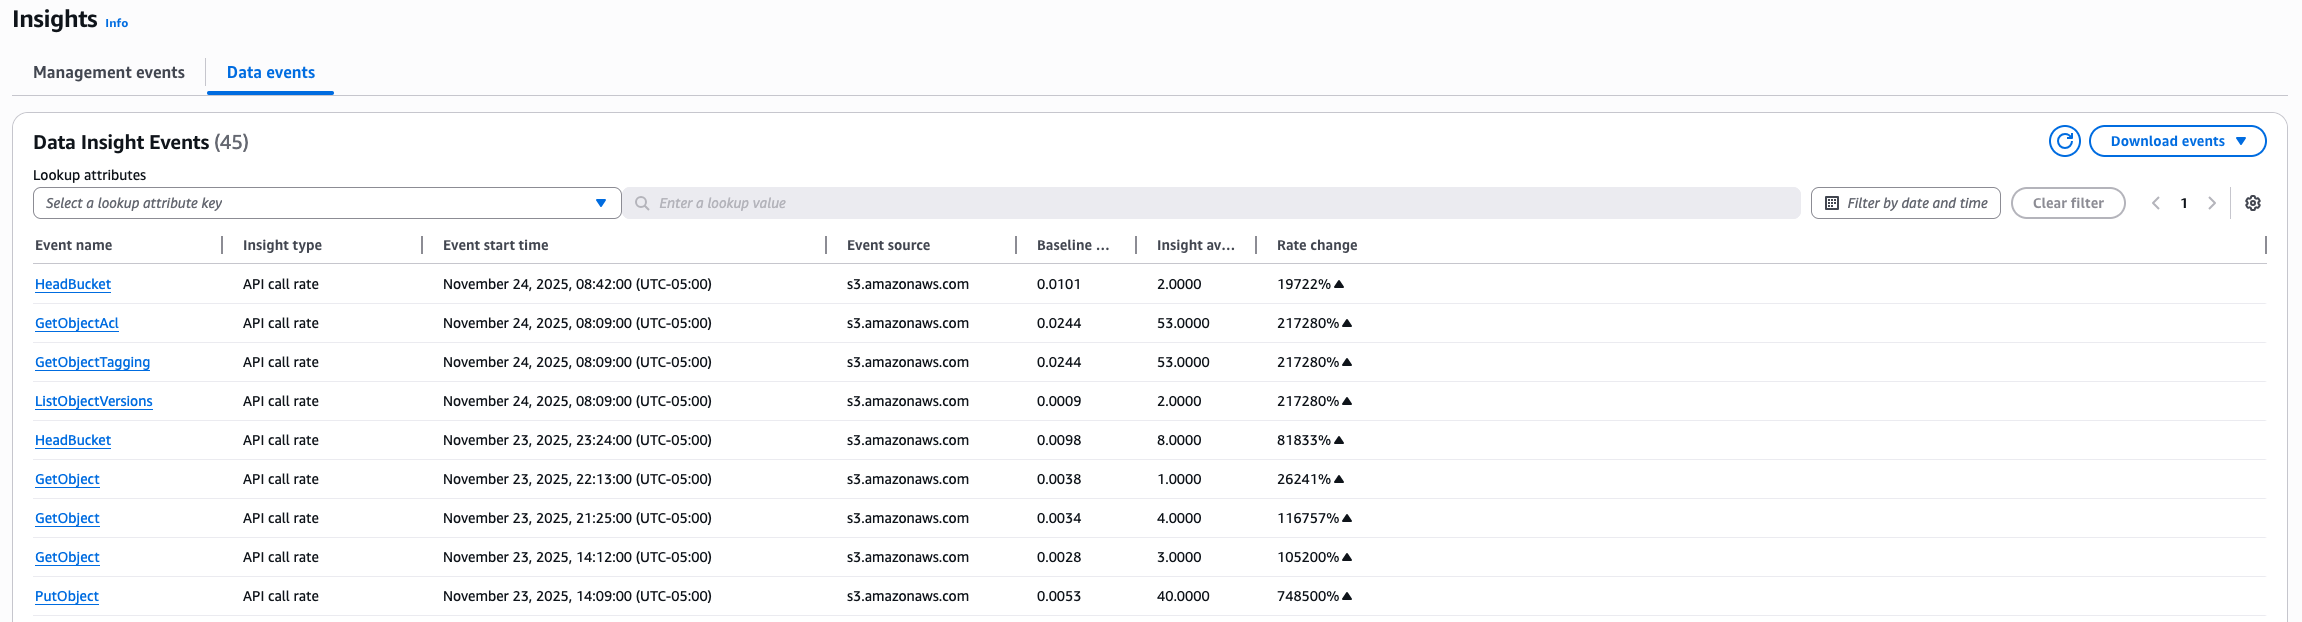
Figure 6: List of insights events for CloudTrail insights
- The details page for an Insights event shows a graph of the unusual activity timeline.
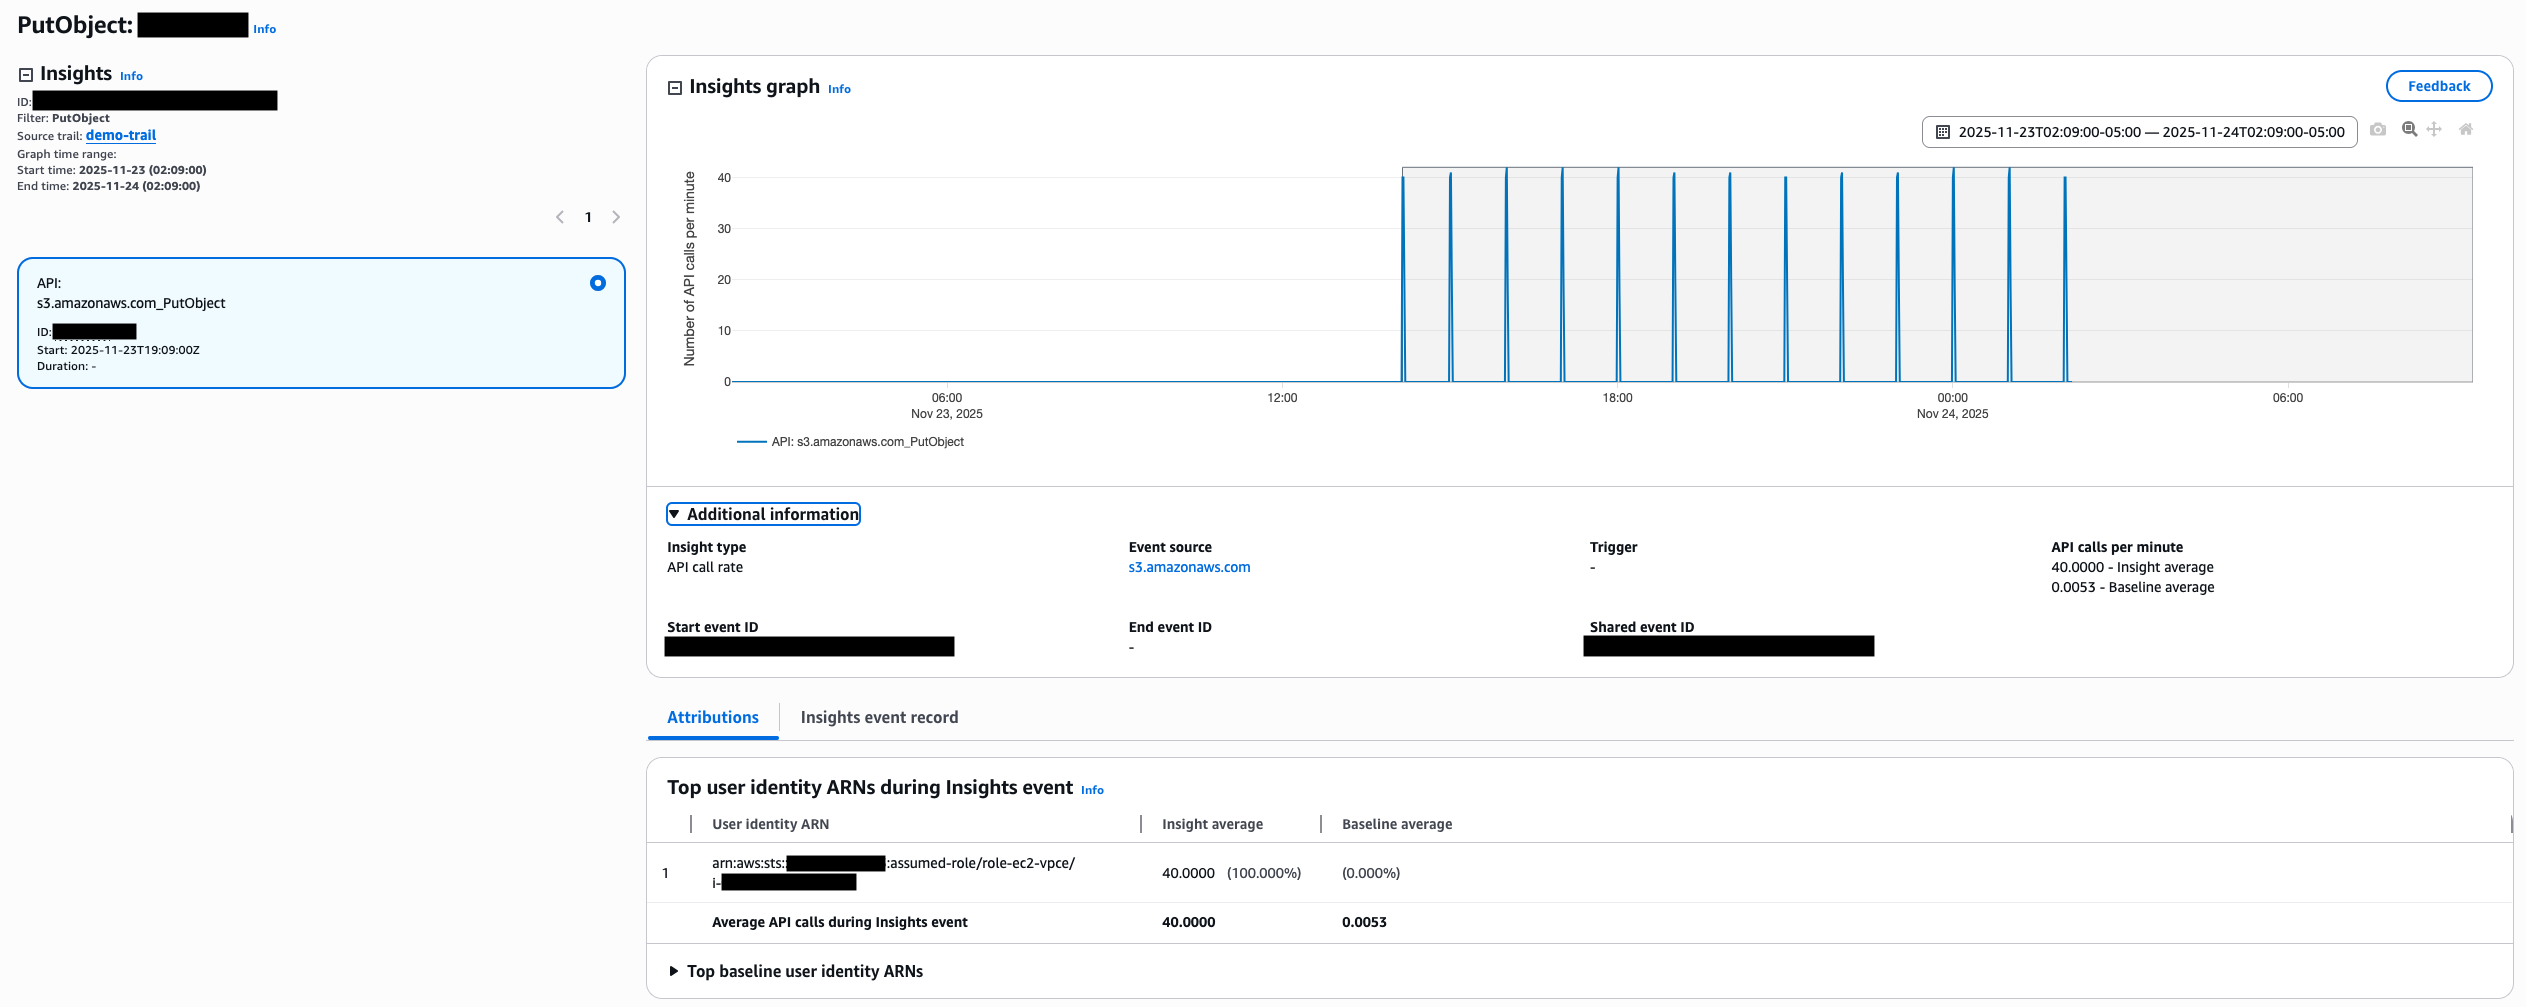
Figure 7: Insights events details
Additionally, you can set up alarms and notifications based on specific insights patterns using CloudWatch Metric Filters or Event Bridge Rules. For additional information on how this is setup please see the blog Leveraging AWS CloudTrail Insights for Proactive API Monitoring and Cost Optimization and Analyzing AWS CloudTrail in Amazon CloudWatch.
Cleanup
To prevent incurring additional charges, remove the CloudTrail insights and aggregated events configuration that were created during this walkthrough.
Conclusion
CloudTrail event aggregation and insights for data events introduce powerful new capabilities to CloudTrail that address different customer needs. CloudTrail Aggregated events offer a solution for customers who send CloudTrail data to downstream workflows, helping reduce data volume and associated costs while maintaining essential visibility. Separately, CloudTrail insights provides the clarity and context needed to identify anomalies and patterns, helping security and operations teams detect unusual activity without manual analysis. In this post, we demonstrated how to set up CloudTrail event aggregation to optimize your data processing pipeline and CloudTrail insights for data events to automatically detect unusual activity patterns and create actionable alerts using CloudWatch Metric Filters. To learn more about these new CloudTrail features and how they can enhance your security posture or optimize costs, please see the AWS CloudTrail documentation.