AWS Cloud Operations Blog
Find your logging gaps before they become compliance gaps with CloudTrail Data Event Coverage
AWS CloudTrail now includes a Data event coverage page in the AWS CloudTrail console, giving you a single view of how well your resources are covered by data event logging. CloudTrail records API activity across your AWS account for security auditing, compliance, and operational troubleshooting. Management events, the control-plane actions such as creating a bucket or attaching an IAM policy, are captured by default. Data events, the data-plane operations that such as reading an object from Amazon Simple Storage Service (Amazon S3), invoking an AWS Lambda function, querying an Amazon DynamoDB table, or calling an Amazon Bedrock model), are not. Without data event logging, you cannot see who accessed a sensitive file, which functions ran, or whether a table experienced unusual write activity.
Knowing where you stand has traditionally been the hard part. Which of the resources in your account even support data event logging? Of those, how many are actually covered? Answering those questions meant inspecting each trail’s event selectors, one trail at a time, one Region at a time, often across dozens of accounts. A security team responsible for an organization with hundreds of accounts had no single view of its data plane coverage posture. Compliance frameworks such as SOC 2, PCI DSS, and HIPAA now expect detailed data-plane audit trails, not just control-plane records, making that blind spot harder to justify. The Data event coverage page gives you:
- A coverage score. Your overall resource data event coverage as a percentage, broken down by service category such as Storage, Compute, Database, and Artificial Intelligence.
- A clear view of the gaps. Exactly which resources are covered and which are not, filterable by resource type or ARN, with a toggle between a single-account view and an organization-wide view.
- One-click remediation. Enable data events directly from the page, without navigating to individual trails.
In this post, we walk through what the Data event coverage page shows you, how to use it to discover resource types you may not have known were loggable, and why turning on data event logging per service category strengthens your security and compliance posture.
See your coverage at a glance
Open the CloudTrail console and choose Data event coverage in the left navigation. At the top of the page, three metrics frame your posture: your overall resource data event coverage score as a percentage, the total number of resources in your account that support data event logging (alongside those that do not), and the number of service categories those resources span. A donut chart breaks the resource count into covered and not covered, and a bar chart shows your coverage score per service category. In a single view, you can see whether your account is well covered or has work to do.
Below the summary, the page breaks your resources into service category cards: Storage, Database, Compute, Application Integration, Artificial Intelligence, Networking, Analytics, Security, and Management. Each card shows its own coverage score, resource count, and resource type count, with tabs to switch between an Overview, a Table, and a Chart view. You can drill into any category to see exactly which resources are covered and which are not, making it straightforward to spot the gaps that matter most to your organization (Figure 1).
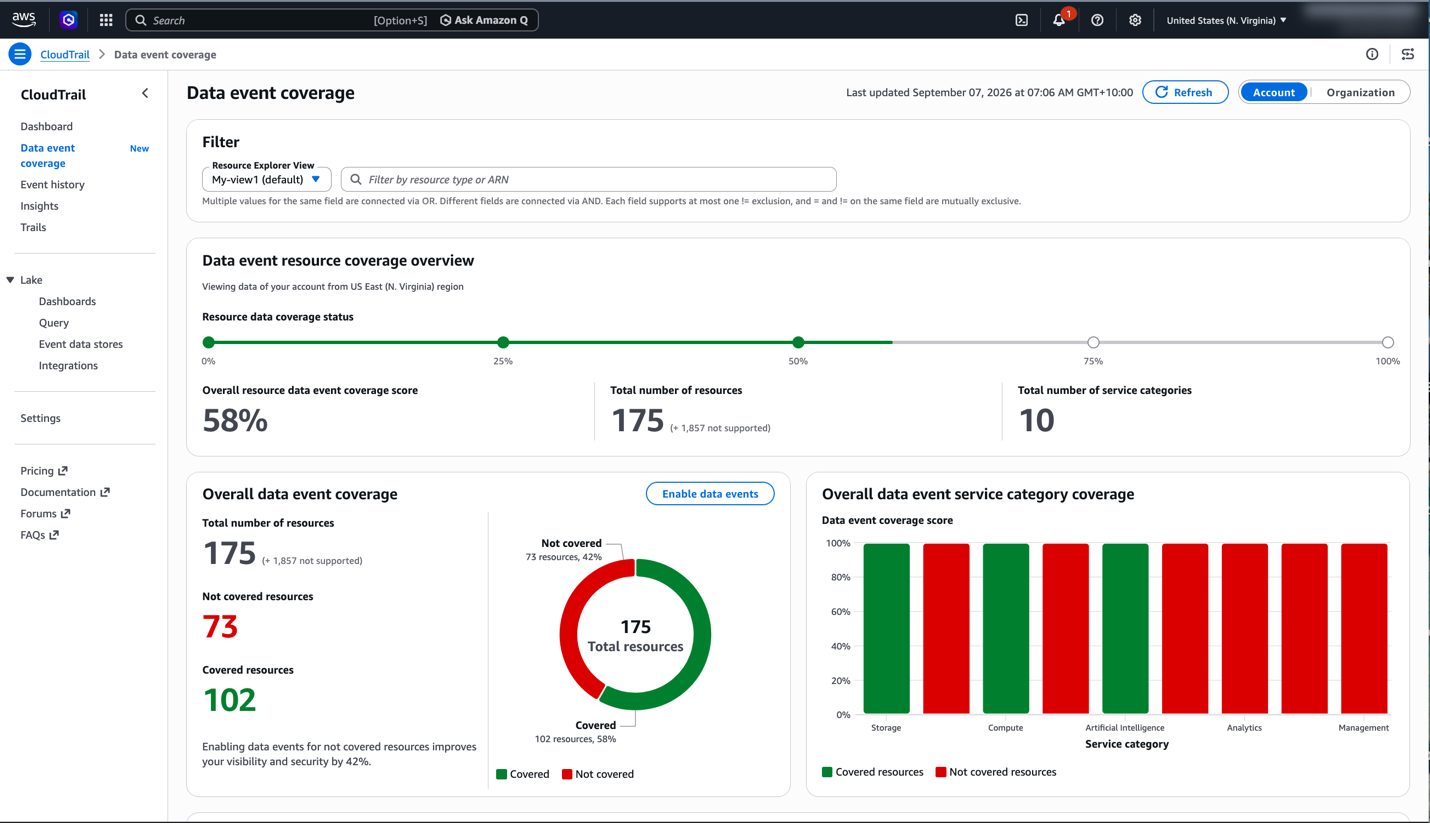
Figure 1. The Data event coverage page showing the overall coverage score, donut chart, service category bar chart, and category cards.
A single percentage tells you where you stand. Scroll down and every service category is broken out with its own score, resource count, and drill-down views. For a security team that previously had to open each trail’s event selectors and piece together coverage manually, this is the difference between guessing and knowing.
Discover resource types you didn’t know you could log
CloudTrail supports data event logging across dozens of AWS services, and the list keeps growing. The Data event coverage page makes this easy to explore: it shows every supported resource type in your account, including ones you may not have known were loggable.
The resource types span the service categories shown on the page. In Storage, you can log object-level operations on Amazon S3 buckets. In Compute, you can capture Lambda function invocations. In Database, you can track DynamoDB table operations. In Artificial Intelligence, you can log Amazon Bedrock model invocations. In Security, you can capture AWS Key Management Service (AWS KMS) key usage. Other categories, including Application Integration, Networking, Analytics, and Management, cover services you might not immediately associate with data events but that can be equally important to monitor (Figure 2.1 & 2.2).
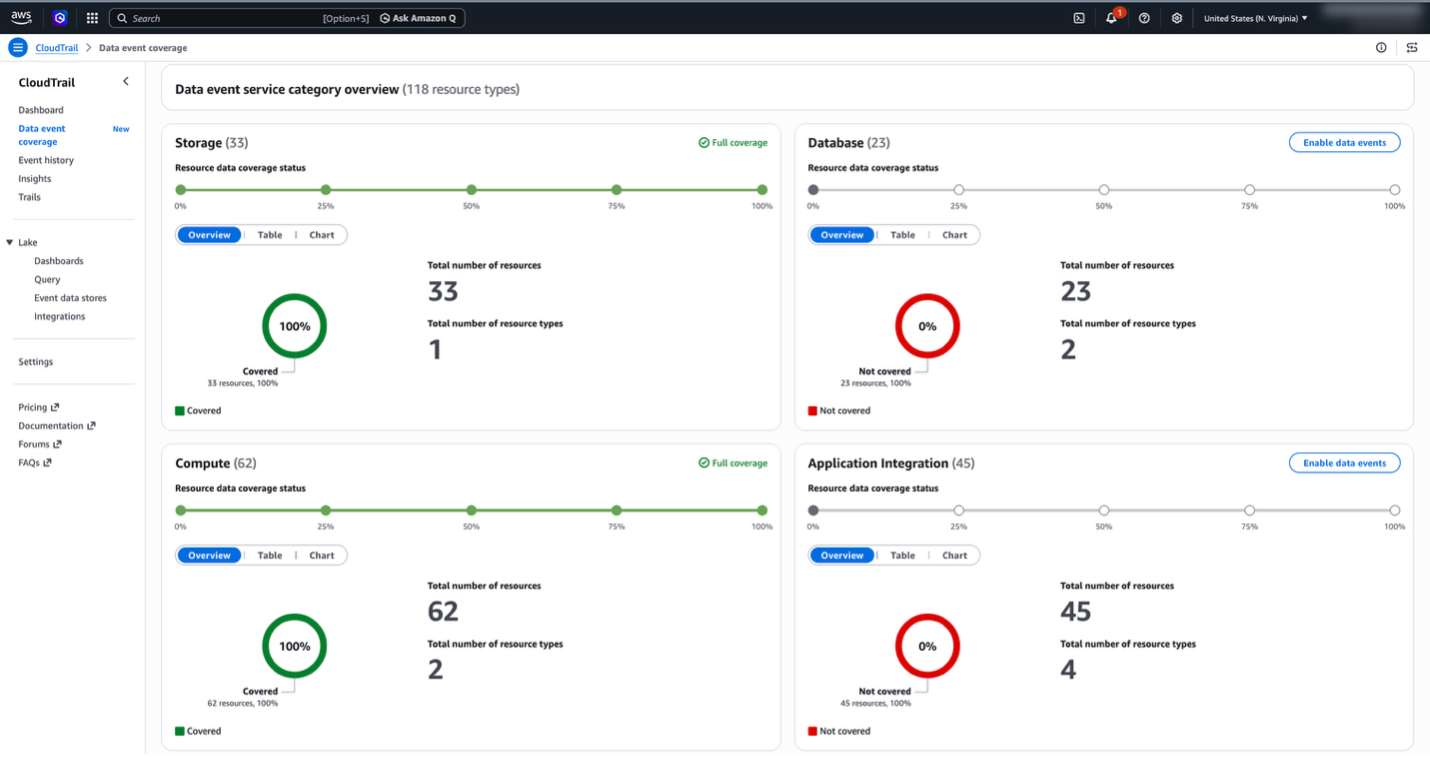
Figure 2.1 Storage, Compute, Database, and Application Integration category cards, showing full coverage alongside categories with gaps and an Enable data events button.
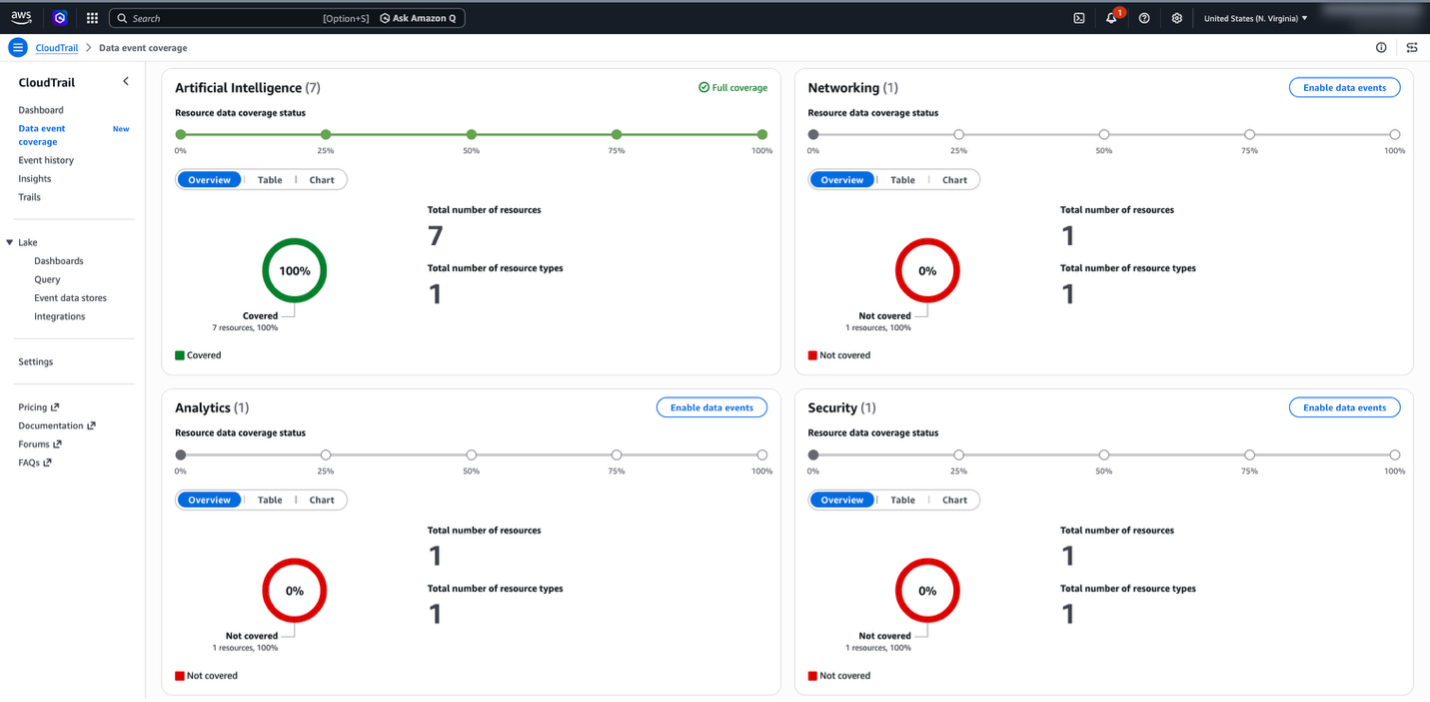
Figure 2.2 Artificial Intelligence, Networking, Analytics, and Security category cards, each showing its coverage score, resource count, and an Enable data events option for uncovered resources.
Each category carries a distinct benefit when logging is turned on. Enabling Storage data events gives you a full audit trail of who read, wrote, or deleted objects in your most sensitive Amazon S3 buckets, foundational for compliance. Enabling Compute data events lets you trace every Lambda function execution back to its caller, critical during incident response. Enabling Database data events surfaces DynamoDB read and write patterns that can reveal data exfiltration attempts. Enabling Artificial Intelligence data events gives you visibility into how Amazon Bedrock models are being called across your organization, an increasingly important governance requirement.
This discovery aspect becomes more valuable over time. As AWS adds support for new resource types, they appear on the Data event coverage page automatically. Rather than monitoring release notes, you can revisit the page periodically and spot new resource types that are ready to log.
Monitor coverage at the organization level
Most organizations run workloads across multiple AWS accounts and Regions. A development account might run in us-east-1 and a production account in eu-west-1. A shared services account could be in ap-southeast-1. Each has its own set of resources generating data events. With the Data event coverage page, you can manage coverage across all of them.
By default, the page shows coverage for the account you are signed in to. To see your entire organization, click the Organization toggle at the top of the page. A guided setup walks you through three prerequisites: your account must be a member of AWS Organizations, AWS Resource Explorer must be configured with organization-level aggregation, and you need an organization-scoped Resource Explorer view. The fastest way to complete these steps is Quick Setup for Resource Explorer, which configures multi-account search across your organization in a few steps. Once the prerequisites are in place, the page shows coverage across all member accounts and Regions in a single view, so you can identify which resource types are logged organization-wide and where gaps remain (Figure 3).
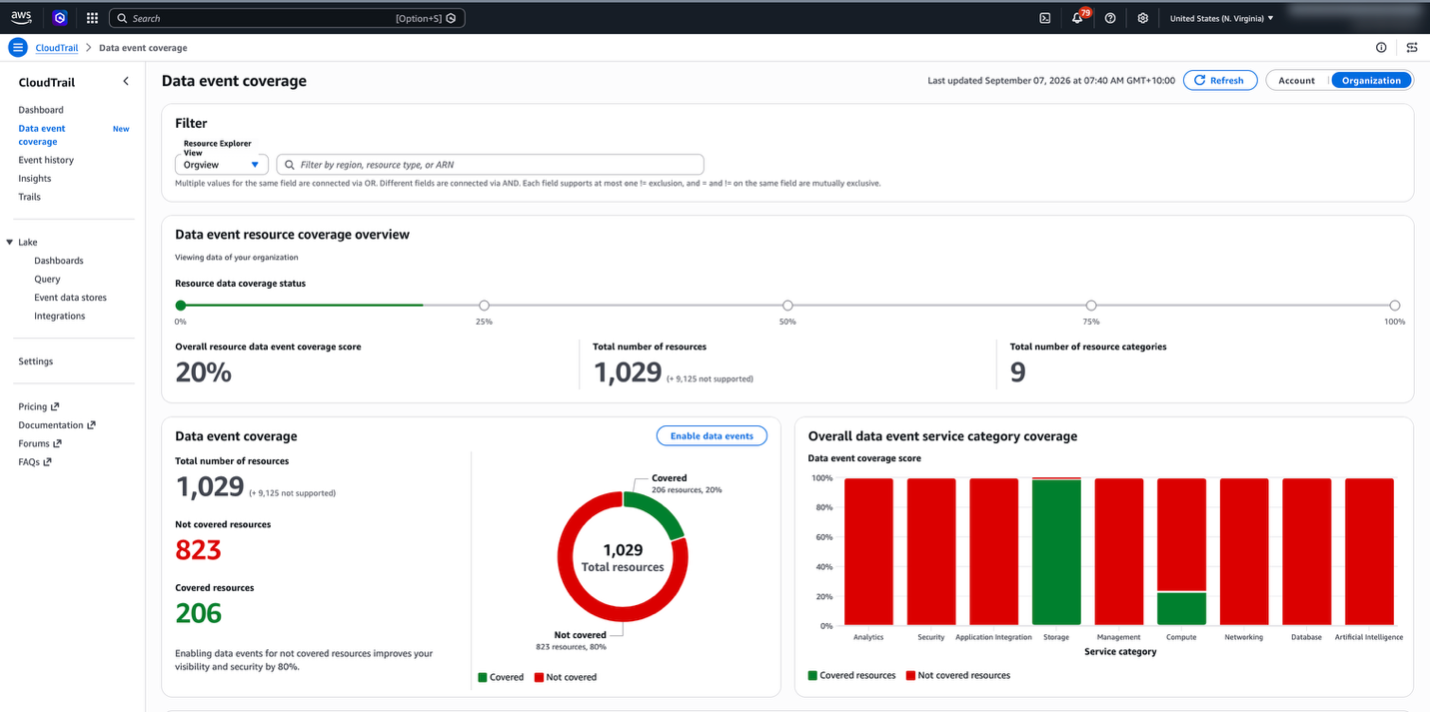
Figure 3. The Organization setup wizard showing the three prerequisites: AWS Organizations membership, Resource Explorer aggregation, and an organization-scoped view.
This centralized visibility is what makes the Data event coverage page practical at scale. A security team can define a baseline (for example, all production accounts must have Storage and Compute data events enabled, all accounts handling sensitive data must have Database and Security logging turned on) and use the page to verify that baseline is met. Gaps are visible immediately, not buried in per-trail configurations across dozens of accounts.
Close gaps directly from the console
Identifying a gap is the first step. Closing it quickly is the next. Every service category card on the Data event coverage page includes an Enable data events button. Click on it and a configuration panel opens with two steps. First, you select the resources you want to cover, either by checking individual resources from a searchable, paginated table or by selecting entire resource types at once. Second, you choose an existing CloudTrail destination (a trail or event data store) where the events should be delivered. A pricing notice reminds you that data event logging incurs additional charges.
Note: As of May 31, 2026, AWS CloudTrail Lake is no longer open to new customers. Existing customers can continue to use the service as normal. If you do not already have an event data store, you must select a trail as your destination. Confirm your selection, and your coverage score updates. (Figure 4)
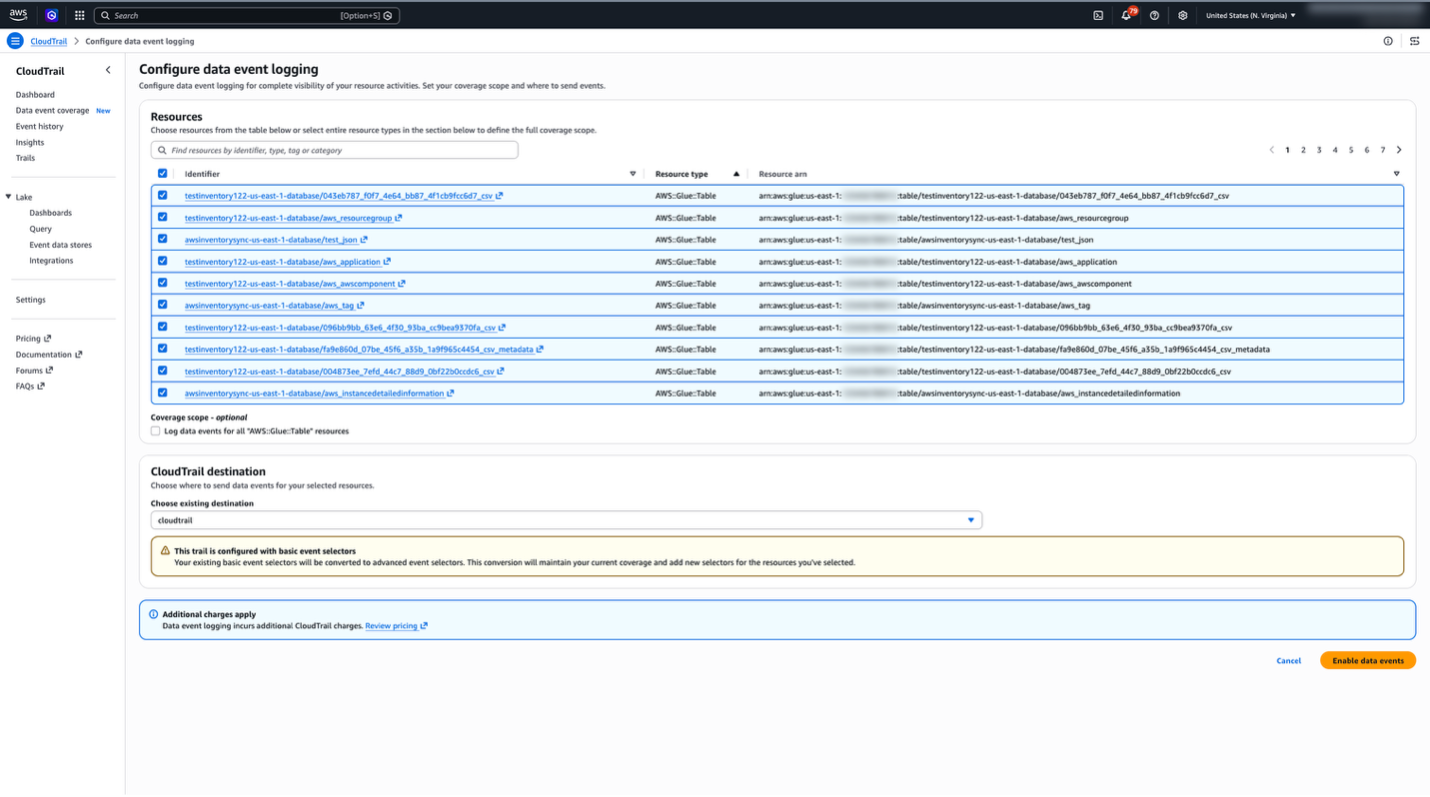
Figure 4. The Enable data events configuration panel showing resource selection and CloudTrail destination options.
This eliminates the context-switching that previously slowed down remediation. Before this page existed, closing a gap meant navigating to the specific trail, editing its event selectors, finding the right resource type in a dropdown, configuring the selector, and saving. For an organization managing dozens of trails across multiple accounts, that workflow did not scale. The Data event coverage page lets you spot a gap and close it in the same view, without leaving the page.
For teams that prefer infrastructure as code, the Data event coverage page serves as the audit layer: use it to validate that your CloudFormation or Terraform configurations are producing the expected coverage, and use the console flow for quick one-off fixes when you find something missing.
A few things worth noting
- Data events are billed separately. Enabling data event logging increases your CloudTrail costs proportionally to the volume of data-plane API calls in your account. The Enable data events panel includes a pricing reminder with a link to current rates. Use advanced event selectors to limit what you capture, and use AWS Budgets to set alerts.
- Advanced event selectors give you fine-grained control. You can filter by resource type, resource ARN, read or write operation type, and even exclude specific patterns. This lets you enable broad coverage while keeping costs manageable. If you need this level of granularity, configure your event selectors directly through the CloudTrail console or your Infrastructure as Code (IaC) tools (such as AWS CloudFormation or Terraform) rather than relying on the one-click enablement experience on the Data Event Coverage page.
- Start with your most critical resource types. You do not need to enable everything at once. Begin with S3 buckets holding sensitive data, production Lambda functions, and DynamoDB tables with customer records. Expand from there as your monitoring maturity grows.
- When you first open the Data Event Coverage page, it displays coverage for your current account and Region by default. To see organization-wide coverage, follow the steps in the Organization View section above.
- Pair with CloudTrail Insights. Once data events are flowing, enable Insights to automatically detect anomalies in data-plane activity, such as a sudden spike in DeleteObject calls or an unusual volume of Lambda invocations, without building custom detection rules.
- Review coverage periodically. AWS continues to add new resource types for data event logging. Revisit the Data event coverage page regularly to discover and enable logging for newly supported services.
- AWS Resource Explorer is required. To use the Data event coverage page, you need to index your resources with AWS Resource Explorer. You can do this from a single-account view or an organization-wide view. For single-account coverage, turn on Resource Explorer with an index in the Region you are viewing. You can use the Quick Setup option in the Resource Explorer console to create indexes in all active Regions and designate an aggregator index for cross-Region search. For organization-wide coverage, configure Resource Explorer with organization-level aggregation. Additionally, trusted access must be turned on between Resource Explorer and AWS Organizations. You also need an organization-scoped Resource Explorer view. If Resource Explorer is not set up, the Data event coverage page cannot discover your resources, and your coverage score will not reflect your actual environment.
Conclusion
The Data event coverage page in the AWS CloudTrail console gives you a clear picture of your data-plane logging posture: a coverage score across your resources, a breakdown by service category, and a clear view of where gaps exist. It works across accounts and at the organization level, surfaces resource types you may not have known were loggable, and lets you see your coverage at a glance, discover what is loggable, monitor at the organization level, and close gaps without leaving the page.
Open the CloudTrail console, choose Data event coverage, and see where you stand. Start with your most critical resource types, close the gaps you find, and expand from there. Your security and compliance posture improves with every resource type you bring under coverage. To learn more, see the AWS CloudTrail documentation on logging data events.