AWS Cloud Operations Blog
Simplifying Prometheus metrics collection across your AWS infrastructure
If you’re running services such as Amazon EC2 instances, Amazon Elastic Container Service (Amazon ECS) containers, and Amazon Managed Streaming for Apache Kafka (Amazon MSK) clusters in AWS, maintaining separate Prometheus servers for each environment creates significant operational burden. Managing scraper configurations, high availability, scaling, and security distracts you from building great applications.
AWS managed collector or Amazon Managed Service for Prometheus scraper helps eliminate this overhead. Instead of deploying and maintaining Prometheus servers in each environment, you can now use fully managed scrapers that collect Prometheus metrics from your Amazon VPC-connected resources and store them in your Amazon Managed Service for Prometheus workspace. This means you no longer need to manage collector availability, scaling, or configuration drift.
This post walks you through implementing AWS managed collectors across three common compute environments: Amazon EC2 instances, Amazon ECS workloads, and Amazon MSK clusters. The post demonstrates how a single managed service can replace multiple self-managed Prometheus deployments.
Prerequisites and setup
Before you begin, verify you have the following in place:
AWS Resources:
- An Amazon Managed Service for Prometheus workspace
- An Amazon VPC with private subnets across multiple Availability Zones
- IAM permissions to create scrapers and manage security groups
- Amazon Managed Grafana workspace (optional, for visualization)
Tools:
Note: The examples use the US West (Oregon) us-west-2 Region. You can adapt the commands and ARNs to your preferred Region. The AWS CLI commands use shell variables (for example, $SUBNET_ID_1, $SECURITY_GROUP_ID) as placeholders. Before running any command, verify that all variables are populated with valid values for your environment. Testing commands in a non-production account first is recommended.
Collecting metrics from Amazon EC2 instances
EC2 instances remain a popular choice for workloads requiring specific instance types or configurations. You can start by configuring the managed scraper to collect both application metrics and system-level metrics from EC2 instances. Here’s what the setup can look like:
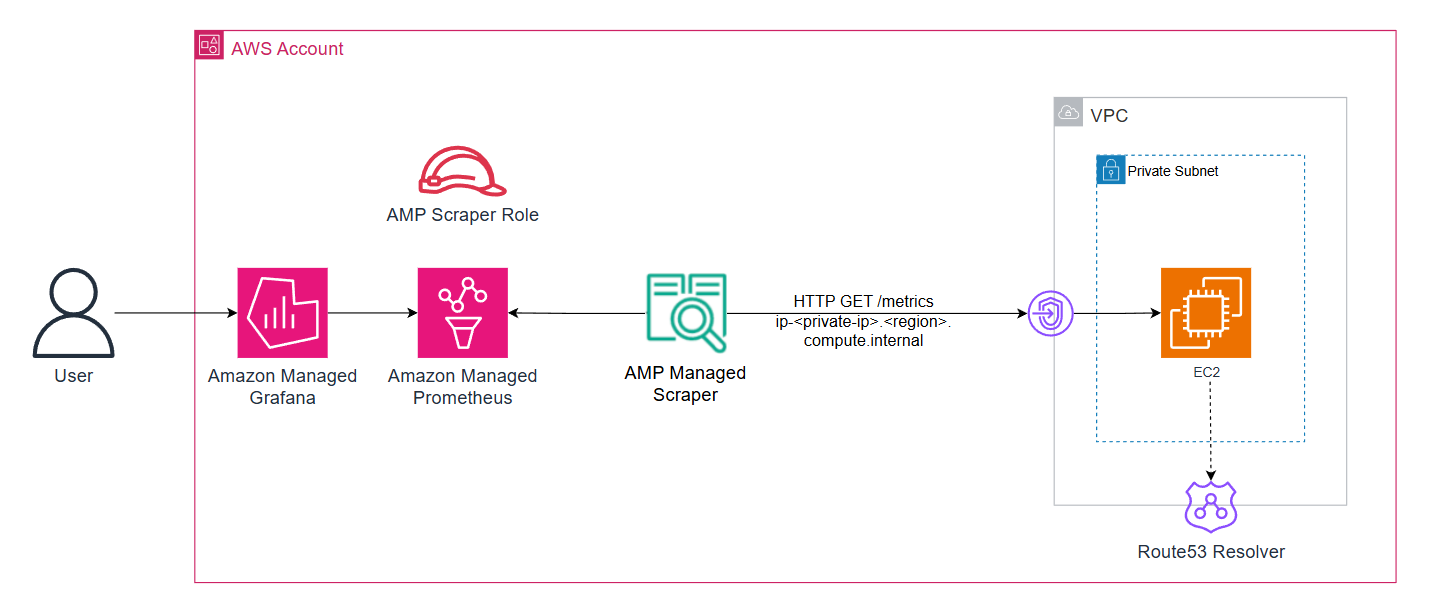
Figure 1: AWS managed-collector with workloads running on Amazon EC2 instances
1. Set up node exporter
This example uses Prometheus Node Exporter on an Amazon EC2 instance to expose system metrics in Prometheus format. Follow the installation instructions in the Prometheus Node Exporter documentation.
2. Create the AWS managed collector configuration
The managed scraper will collect metrics from both the Node Exporter (exposing metrics on the default port 9100) and the sample application metrics (exposed on port 8080) using the following configuration:
cat > /tmp/ec2-scraper.yml << EOF
global:
  scrape_interval: 30s
  scrape_timeout: 10s

scrape_configs:
  - job_name: 'ec2-metrics'
    static_configs:
      - targets:
          - ip-$IP_ADDRESS.us-west-2.compute.internal:8080
    metrics_path: '/metrics'
    relabel_configs:
      - source_labels: [__address__]
        target_label: instance
        replacement: 'ec2-metrics-instance-new'
      - target_label: service
        replacement: 'ec2-metrics'
      - target_label: environment
        replacement: 'dev'
    metric_relabel_configs:
      - source_labels: [__name__]
        regex: '.*'
        action: keep

  - job_name: ec2-node-exporter
    static_configs:
      - targets:
        - ip-$IP_ADDRESS.us-west-2.compute.internal:9100
EOF

CONFIG_BLOB=$(base64 -w 0 /tmp/ec2-scraper.yml)
The relabel_configs section placeholder can be modified to add consistent labels to your metrics, making it easier to query and filter across different services.
3. Deploy the managed scraper
aws amp create-scraper \
  --alias "ec2-payment-service-scraper" \
  --source '{
    "vpcConfiguration": {
      "subnetIds": ["$SUBNET_ID_1", "$SUBNET_ID_2"],
      "securityGroupIds": ["$SECURITY_GROUP_ID"]
    }
  }' \
  --destination '{
    "ampConfiguration": {
      "workspaceArn": "arn:aws:aps:us-west-2:ACCOUNT_ID:workspace/ws-WORKSPACE_ID"
    }
  }' \
  --scrape-configuration "{\"configurationBlob\":\"$CONFIG_BLOB\"}"
When you create a managed scraper, Amazon Managed Service for Prometheus automatically creates a service-linked role (AWSServiceRoleForAmazonPrometheusScraperInternal) that grants the scraper permissions to access your VPC resources and write to your workspace.
4. Validate EC2 metrics
Within minutes, you’ll see metrics flowing into the destination Amazon Managed Service for Prometheus workspace. You can verify this in the CloudWatch metrics console or by querying the workspace from Amazon Managed Grafana.
Query metrics for the ec2-metrics job:
{job="ec2-metrics"}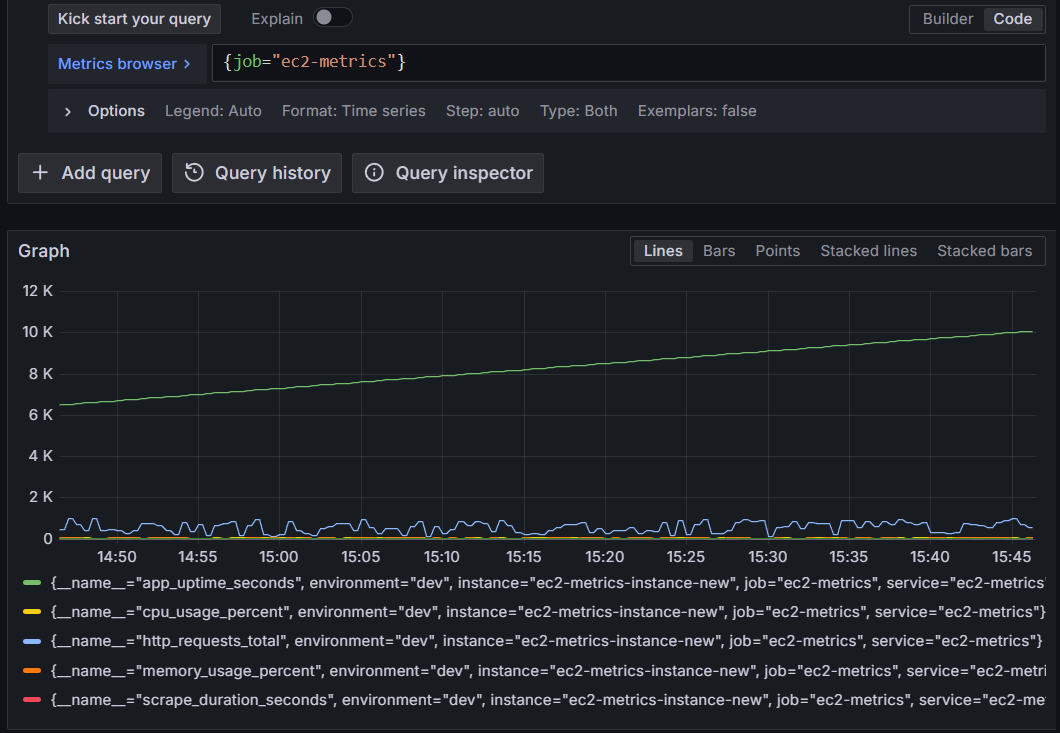
Figure 2: Querying Amazon Managed Service for Prometheus for EC2 metrics from the AWS-managed collector
Monitoring ECS workloads with dynamic service discovery
Amazon ECS tasks are ephemeral, IP addresses change as containers are replaced, and services scale dynamically. AWS Cloud Map service discovery addresses these challenges by maintaining DNS records for running tasks, which the managed scraper queries automatically.
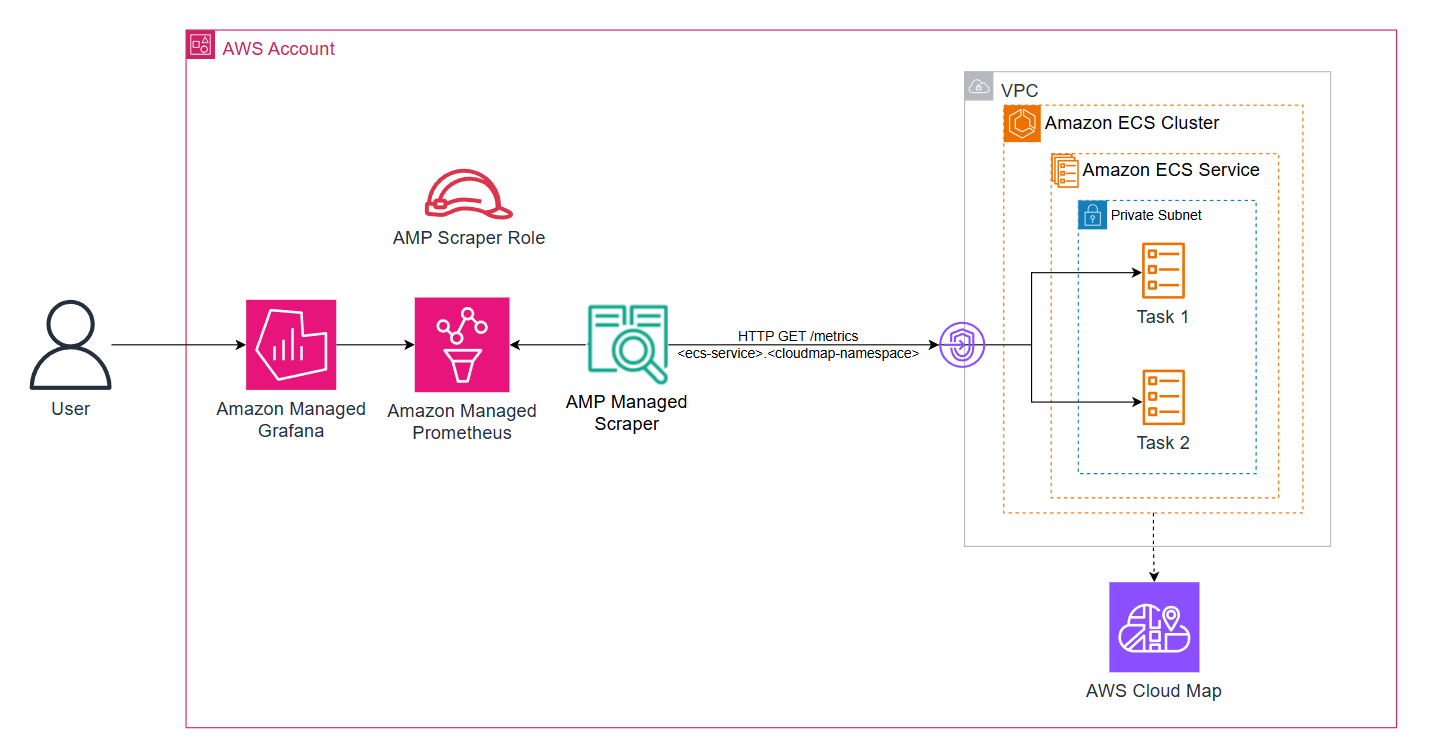
Figure 3: AWS managed-collector with workloads running on Amazon ECS
For this example, the payforadoption service from the AWS One Observability Workshop is used, which demonstrates a realistic microservice exposing Prometheus metrics.
1. Configure security groups
Confirm that the ECS task security group allows inbound traffic from the scraper:
aws ec2 authorize-security-group-ingress \
  --group-id $SECURITY_GROUP_ID \
  --ip-permissions IpProtocol=tcp,FromPort=80,ToPort=80,UserIdGroupPairs='[{GroupId=$SECURITY_GROUP_ID}]'
This creates a self-referencing rule, allowing resources within the same security group to communicate.
2. Create the AWS managed collector configuration
Create the DNS based scraper configuration:
cat > /tmp/ecs-scraper.yml << EOF
global:
  scrape_interval: 30s
  scrape_timeout: 10s

scrape_configs:
  - job_name: 'ecs-payforadoption'
    dns_sd_configs:
      - names: ['payforadoption-go.Workshop-space']
        type: A
        port: 80
    metrics_path: '/metrics'
    relabel_configs:
      - target_label: service_name
        replacement: 'payforadoption-go'
      - target_label: cloudmap_namespace
        replacement: 'Workshop-space'
      - target_label: environment
        replacement: 'production'
      - target_label: compute_platform
        replacement: 'ecs-fargate'
EOF

CONFIG_BLOB=$(base64 -w 0 /tmp/ecs-scraper.yml)
The dns_sd_configs section tells the scraper to query the DNS name payforadoption-go.Workshop-space and scrape all returned IP addresses.
3. Create the AWS managed collector
The deployment pattern remains the same as before:
aws amp create-scraper \
  --alias "ecs-payforadoption-scraper" \
  --source '{
    "vpcConfiguration": {
      "subnetIds": ["$SUBNET_ID_1", "$SUBNET_ID_2"],
      "securityGroupIds": ["$SECURITY_GROUP_ID"]
    }
  }' \
  --destination '{
    "ampConfiguration": {
      "workspaceArn": "arn:aws:aps:us-west-2:ACCOUNT_ID:workspace/ws-WORKSPACE_ID"
    }
  }' \
  --scrape-configuration "{\"configurationBlob\":\"$CONFIG_BLOB\"}"
When Amazon ECS replaces a task, the scraper picks up the changes on its next DNS query (typically every 30 seconds), supporting continuous metrics collection without manual intervention.
4. Validate Amazon ECS metrics
Run a query. For example, show the average requests per second to the ECS task over the last 5 minutes:
rate(payforadoption_requests_total[5m])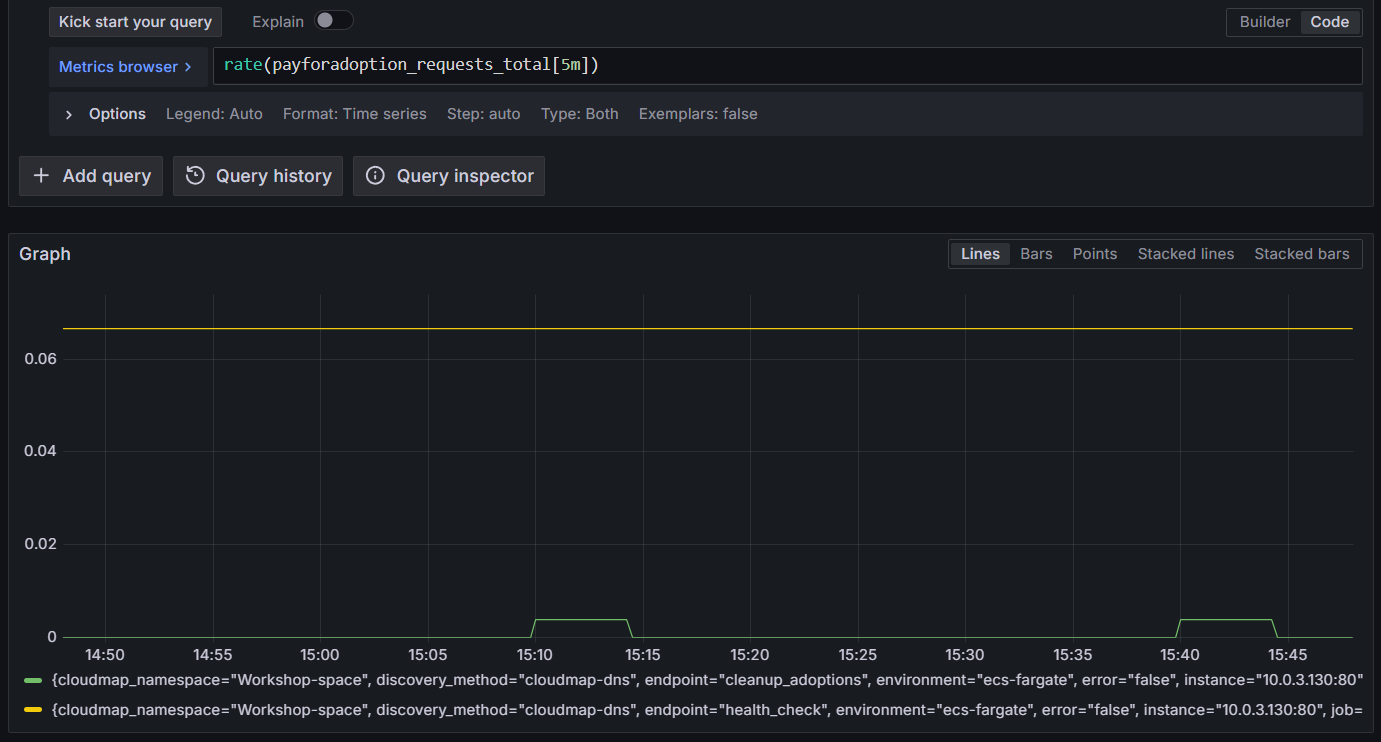
Figure 4: Querying Amazon Managed Service for Prometheus for ECS metrics
Collecting Prometheus metrics from Amazon MSK clusters
Monitoring Amazon MSK cluster health is critical for event-driven architectures. Amazon MSK clusters expose two types of metrics through Prometheus exporters when you enable OpenMonitoring: JMX Exporter for Kafka-specific metrics (topics, partitions, consumer lag) and Node Exporter for broker system metrics (CPU, memory, disk).
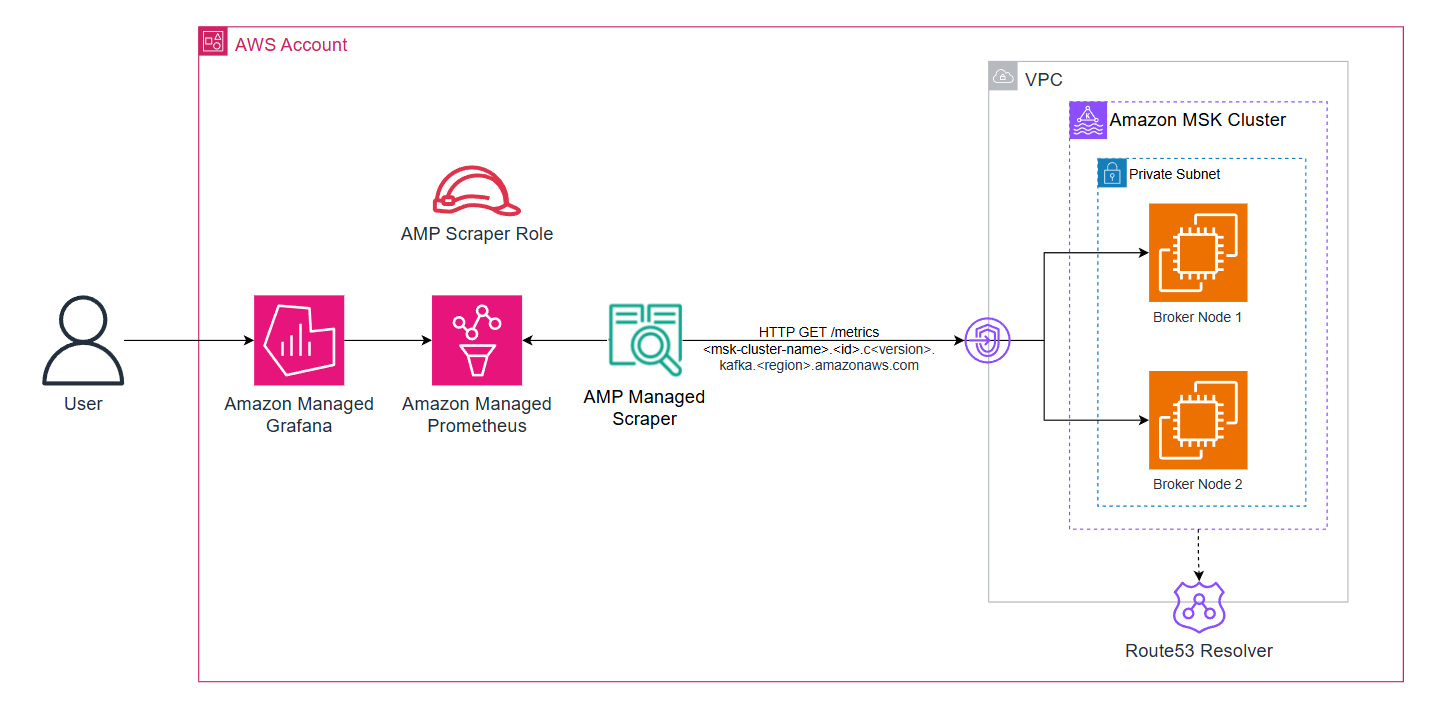
Figure 5: AWS managed-collector with workloads running on Amazon MSK
1. Enable OpenMonitoring on Amazon MSK clusters
The following command enables both exporters on all broker nodes. JMX Exporter listens on port 11001, and Node Exporter on port 11002:
aws kafka update-monitoring \
  --cluster-arn "arn:aws:kafka:REGION:ACCOUNT_ID:cluster/metrics-msk-cluster/CLUSTER_ID" \
  --current-version "CURRENT_VERSION" \
  --open-monitoring '{
    "Prometheus": {
      "JmxExporter": {"EnabledInBroker": true},
      "NodeExporter": {"EnabledInBroker": true}
    }
  }' \
  --enhanced-monitoring PER_TOPIC_PER_PARTITION
2. Deploy the scraper for Amazon MSK
Amazon MSK provides a cluster-level DNS name that resolves to all broker IPs. Using this for service discovery makes your monitoring resilient to broker replacements and cluster scaling.
Get your cluster DNS name (remove the broker-specific prefix like b-1. or b-2.):
CLUSTER_DNS="metricsmskcluster.xxxx.xxx.kafka.REGION.amazonaws.com"

cat > /tmp/msk-scraper.yml << EOF
global:
  scrape_interval: 30s
  external_labels:
    cluster_name: metrics-msk-cluster

scrape_configs:
  - job_name: msk-jmx
    scheme: http
    metrics_path: /metrics
    scrape_timeout: 10s
    dns_sd_configs:
      - names:
          - $CLUSTER_DNS
        type: A
        port: 11001
    relabel_configs:
      - source_labels: [__meta_dns_name]
        target_label: broker_dns
      - source_labels: [__address__]
        target_label: instance
      - target_label: compute_platform
        replacement: 'msk'

  - job_name: msk-node
    scheme: http
    metrics_path: /metrics
    scrape_timeout: 10s
    dns_sd_configs:
      - names:
          - CLUSTER_DNS
        type: A
        port: 11002
    relabel_configs:
      - source_labels: [__meta_dns_name]
        target_label: broker_dns
      - source_labels: [__address__]
        target_label: instance
      - target_label: compute_platform
        replacement: 'msk'
EOF

CONFIG_BLOB=$(base64 -w 0 /tmp/msk-scraper.yml)
3. Create the AWS managed collector
Amazon MSK brokers need to allow inbound traffic from the scraper on both exporter ports. You’ll then deploy the scraper configuration:
SCRAPER_SG=$(aws cloudformation describe-stacks \
  --stack-name msk-metrics-stack \
  --query 'Stacks[0].Outputs[?OutputKey==`PrometheusScraperSecurityGroupId`].OutputValue' \
  --output text)

aws amp create-scraper \
  --alias "msk-metrics-scraper" \
  --source "{\"vpcConfiguration\":{\"subnetIds\":[\"subnet-xxx\",\"subnet-yyy\"],\"securityGroupIds\":[\"$SCRAPER_SG\"]}}" \
  --destination "{\"ampConfiguration\":{\"workspaceArn\":\"arn:aws:aps:us-west-2:ACCOUNT_ID:workspace/ws-WORKSPACE_ID\"}}" \
  --scrape-configuration "{\"configurationBlob\":\"$CONFIG_BLOB\"}"
4. Verify Amazon MSK metrics
Within minutes, you start seeing consumer lag, partition counts, broker resource utilization, and other MSK metrics without managing any Prometheus infrastructure.
Run a query. For example, show the overall broker throughput across all topics using:
kafka_server_BrokerTopicMetrics_MeanRate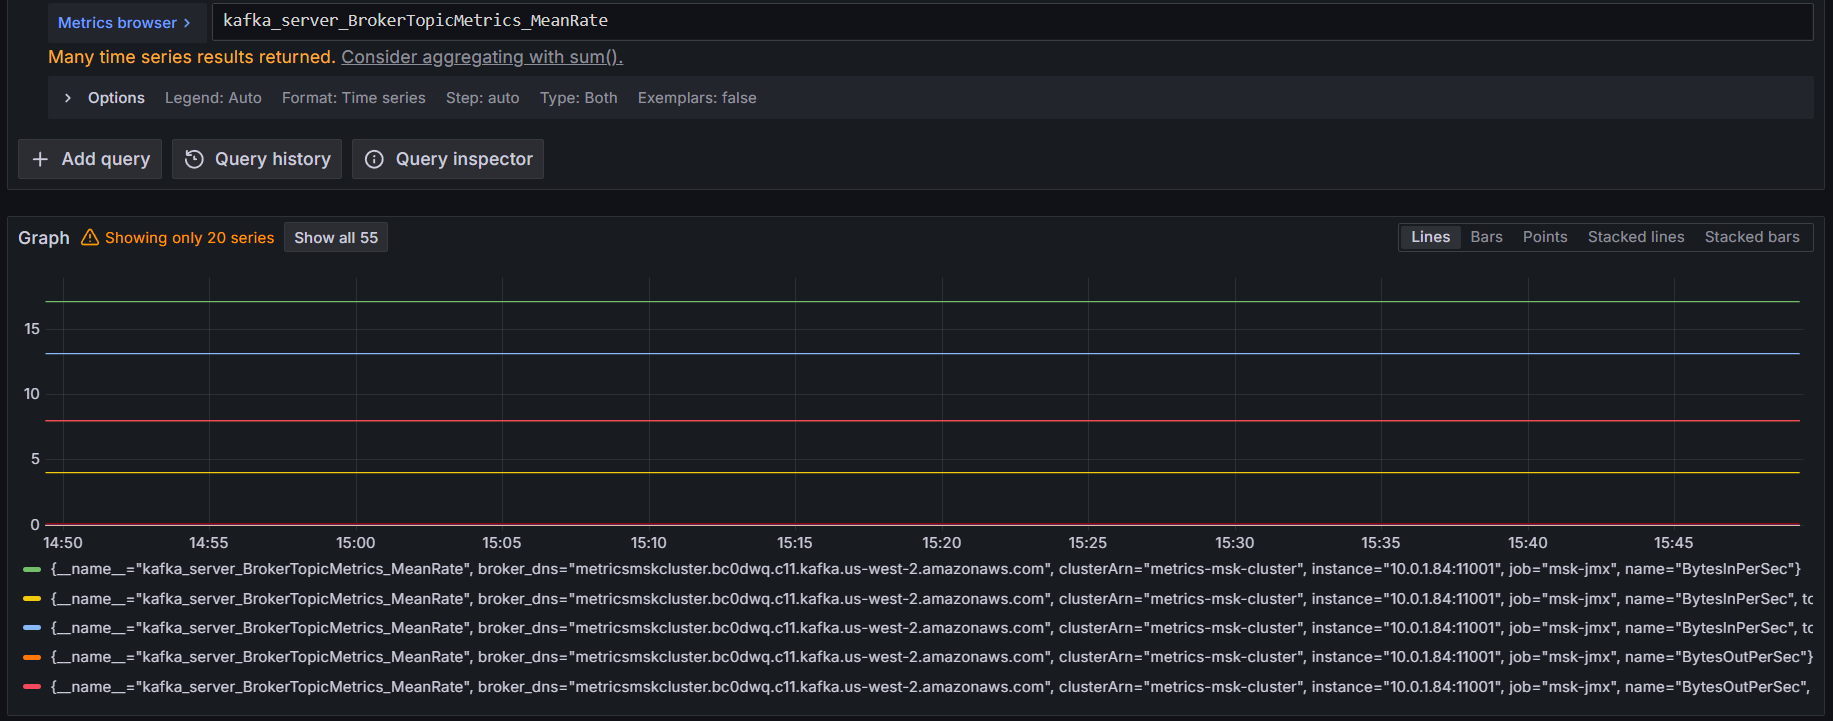
Figure 6: Querying Amazon Managed Service for Prometheus for Amazon MSK metrics
Bringing it all together
Now that you have metrics from EC2, ECS, and MSK, you can unify querying and alerting across your entire infrastructure. You can connect an Amazon Managed Grafana workspace to the Amazon Managed Service for Prometheus workspace as a data source and write PromQL queries that span all three compute platforms:
Query total request rate across all services:
sum(rate({__name__=~"http_requests_total|payforadoption_requests_total"}[5m])) by (environment, service)This aggregates HTTP request rates from the EC2 instance and ECS service, grouped by service and platform.
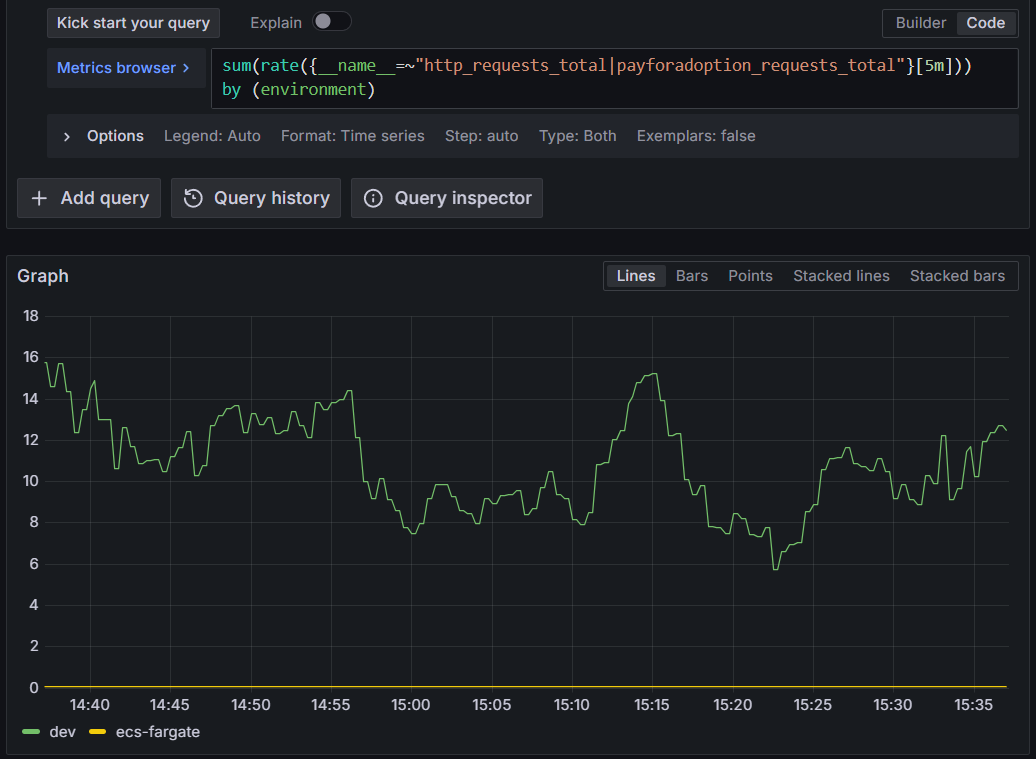
Figure 7: Querying Amazon Managed Service for Prometheus for total request rate across all services
Monitor CPU usage across compute types:
This query works identically for EC2 instances and MSK brokers since both expose Node Exporter metrics with the same naming convention.
100 - (avg by (instance, job) (rate(node_cpu_seconds_total{mode="idle"}[5m])) * 100)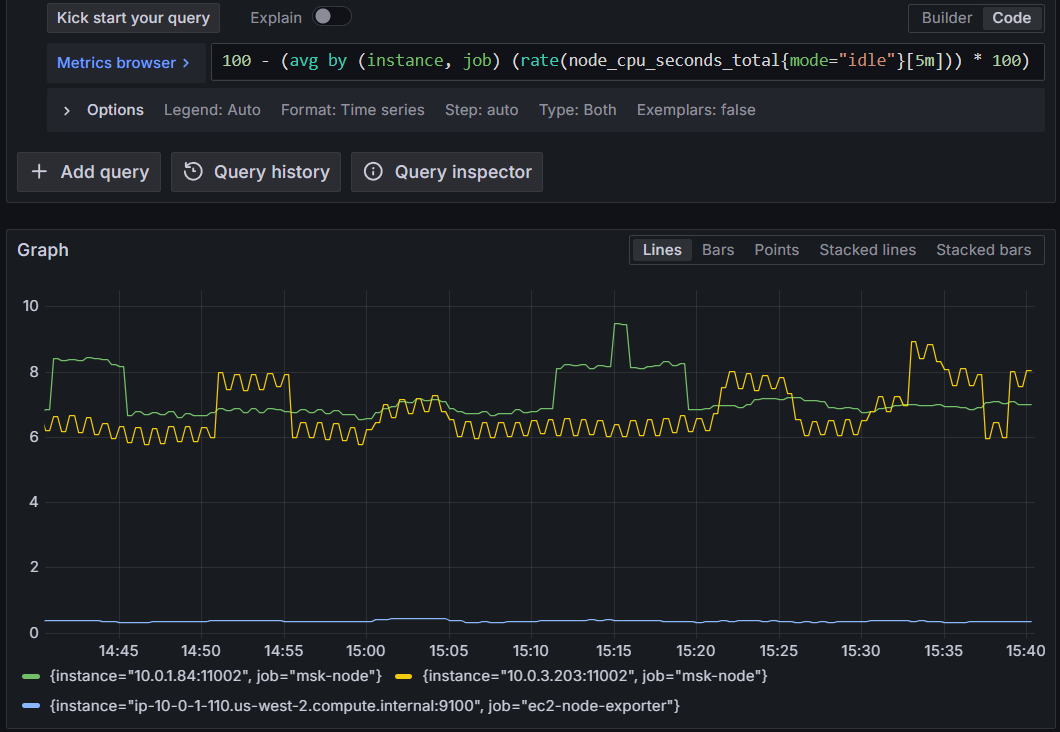
Figure 8: Querying Amazon Managed Service for Prometheus for CPU usage across all compute types
Track Kafka consumer lag for ECS consumers:
This helps you identify if your Amazon MSK consumers are keeping up with message production.
sum(kafka_consumer_group_ConsumerLagMetrics_Value) by (groupId, topic)Cross-service alerting
You can define alerts that span the infrastructure. For example, alert when consumer lag exceeds a threshold AND the consuming service’s error rate increases:
(
  sum(kafka_consumer_group_ConsumerLagMetrics_Value{topic="payment-processor"}) > 10000
  and
  rate(http_requests_total{service_name="payment-api",status=~"5.."}[5m]) > 0.01
)
Correlating Kafka metrics with application metrics can help you identify root causes faster and reduce mean time to resolution.
Security considerations
- Under the AWS Shared Responsibility Model, AWS manages the security of the managed scraper infrastructure while you are responsible for configuring secure access to your resources.
- Implement least privilege IAM policies. Each scraper assumes an IAM role. Follow the principle of least privilege by granting only the permissions needed:
{
  "Version": "2012-10-17",
  "Statement": [
    {
      "Effect": "Allow",
      "Action": [
        "aps:RemoteWrite"
      ],
      "Resource": "arn:aws:aps:us-west-2:ACCOUNT_ID:workspace/ws-WORKSPACE_ID"
    }
  ]
}- Restrict security group ingress to only the scraper’s security group on the specific exporter ports
- Deploy scrapers in private subnets and use VPC endpoints for Amazon Managed Service for Prometheus to keep traffic within your VPC
- Data sent from the scraper to the Amazon Managed Service for Prometheus workspace is encrypted in transit using TLS
- The scraper communicates with targets over your VPC’s private network. You can configure TLS on your exporters using scheme: https for additional protection
- Metrics stored in Amazon Managed Service for Prometheus are encrypted at rest by default. You can optionally use customer managed keys for additional control
- Enable scraper logging to Amazon CloudWatch Logs for auditing and troubleshooting
Best practices for production deployments
Based on real-world implementations, here are key best practices to ensure reliable, secure, and scalable metrics collection:
- For EC2 workloads, consider migrating from static targets to DNS-based service discovery using the dns_sd_configs directive in your scraper configuration and registering your EC2 instances in AWS Cloud Map.
- Deploy multiple scrapers when you have targets with different lifecycles, access patterns or security exposures for better isolation, security and operational flexibility
- Set appropriate scrape intervals to balance metrics granularity with cost and performance:
- 30 seconds: Good default for most application metrics
- 60 seconds: Sufficient for infrastructure metrics (CPU, memory)
- 90 seconds+: Non-production environments or low throughput applications
- Remember that halving your scrape interval doubles your ingestion cost
- Drop noisy metrics with relabel configurations
metric_relabel_configs:
  - source_labels: [__name__]
    regex: '.*_debug_.*'
    action: drop
Cleanup
To avoid incurring ongoing charges, delete the resources created during this walkthrough when they are no longer needed.
Remove the managed scrapers using the AWS CLI:
aws amp list-scrapers
aws amp delete-scraper --scraper-id $SCRAPER_ID
Additionally, delete the Amazon Managed Service for Prometheus workspace if it was created for testing purposes:
aws amp delete-workspace --workspace-id $WORKSPACE_IDIf you deployed supporting resources such as EC2 instances, ECS services, MSK clusters, security groups, or Amazon Managed Grafana workspaces specifically for this walkthrough, remove those as well to stop all associated costs.
Conclusion
This post walked through implementing Amazon Managed Service for Prometheus managed collector across three distinct compute environments — Amazon EC2, Amazon ECS, and Amazon MSK clusters — demonstrating how a single managed service can replace multiple self-managed Prometheus deployments. By using DNS-based service discovery, consistent labeling strategies, and unified querying in Grafana, you can build a comprehensive observability solution without the operational burden of managing scraper infrastructure.
The key benefits of this approach:
- Reduced operational overhead: No Prometheus servers to patch, scale, or monitor
- Automatic resilience: DNS-based discovery adapts to infrastructure changes automatically
- Unified observability: Query metrics across all compute platforms from a single interface
- Cost optimization: Consolidated billing and easy metric filtering reduce costs
- Security: Managed service handles infrastructure security while you control access policies
Whether you’re running a hybrid architecture across multiple compute types or planning to migrate between platforms, Amazon Managed Service for Prometheus managed collector provides the flexibility and reliability you need for production observability.
Next steps
Ready to implement this in your environment? Here are some resources to get started:
- Amazon Managed Service for Prometheus documentation
- AWS managed collectors API reference
- AWS One Observability Workshop – Hands-on labs
- Prometheus configuration best practices
- Amazon Managed Grafana documentation
Have questions or want to share your implementation? Leave a comment below or reach out to the AWS observability team through your account team.