AWS Cloud Operations Blog
Tag: Prometheus
Automating Amazon EC2 Instances Monitoring with Prometheus EC2 Service Discovery and AWS Distro for OpenTelemetry
Traditionally, scraping application Prometheus metrics required manual updates to a configuration file, posing challenges in dynamic AWS environments where Amazon EC2 instances are frequently created or terminated. This not only proves time consuming but also introduces the risk of configuration errors, lacking the agility necessary in dynamic environments. In this blog post, we will demonstrate […]
How to reduce Istio sidecar metric cardinality with Amazon Managed Service for Prometheus
The complexity of distributed systems has grown significantly, making monitoring and observability essential for application and infrastructure reliability. As organizations adopt microservice-based architectures and large-scale distributed systems, they face the challenge of managing an increasing volume of telemetry data, particularly high metric cardinality in systems like Prometheus. To address this, many are turning to service […]
Visualizing metrics across Amazon Managed Service for Prometheus workspaces using Amazon Managed Grafana
This post provides step-by-step instructions for aggregating and visualizing your Amazon Elastic Kubernetes Service (Amazon EKS) monitoring metrics using Amazon Managed Service for Prometheus and Amazon Managed Grafana. As part of this solution, promxy a Prometheus proxy, is deployed to enable a single Grafana data source to query multiple Prometheus workspaces. Please note that this […]
Viewing collectd statistics with Amazon Managed Service for Prometheus and Amazon Managed Service for Grafana
Monitoring systems are essential for a resilient solution. A popular tool to monitor Linux-based physical or virtual machines is collectd – a daemon to collect system and application performance metrics periodically. However, collectd doesn’t provide long-term storage for metrics, rich querying, visualization, or an alerting solution. The Amazon Managed Service for Prometheus is a serverless […]
Automating the installation and configuration of Prometheus using Systems Manager documents
As organizations migrate workloads to the cloud, they want to ensure their teams spend more time on tasks that move the organization forward and less time managing infrastructure. Installing patches and configuring software is what AWS calls undifferentiated heavy lifting, or the hard IT work that doesn’t add value to the mission of the organization. […]
Getting Started with Amazon Managed Service for Prometheus
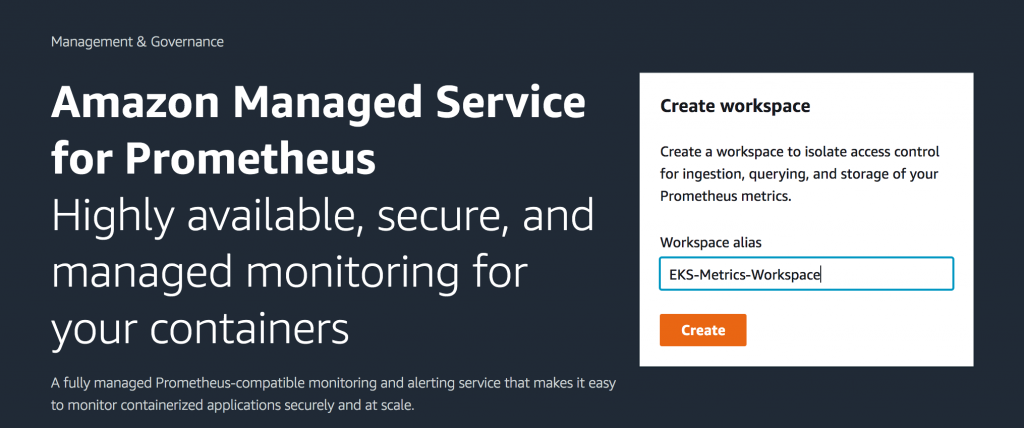
4/9/2021 – Updated the Prometheus server deployment setup part by removing the AWS SigV4 side-car proxy container. This is no longer needed as the Prometheus server now directly signs requests made to the AMP remote write API. Amazon Managed Service for Prometheus (AMP) is a Prometheus-compatible monitoring service for container infrastructure and application metrics for […]


