Networking & Content Delivery
How Amazon CloudFront delivered traffic for the FIFA World Cup 2026
When Spain broke the deadlock in extra time during the Final of the FIFA World Cup on July 19, tens of millions of streams surged at the same instant: replay requests, second-screen clips, viewers who had stepped away rushing back. At that moment, Amazon CloudFront was delivering over 117 Tbps of traffic for the FIFA World Cup across 40+ broadcasters on six continents. The largest live-streaming peak in CloudFront’s history, and not a single viewer knew it was happening, exactly how it should be.
The FIFA World Cup 2026, the first one hosted across the United States, Mexico, and Canada, was one of the most-watched live-streamed sporting events in history. Over five weeks, 104 matches across 6 continents and 54+ countries, CloudFront carried every minute.
A tournament of records
The traffic told the story of the bracket. The Americas drove the bulk of it, natural for a tournament hosted in the region, but this was a truly global audience. Fans in Tokyo tuned in for Japan’s group-stage surprise. Colombian viewers surged as their team advanced. Viewers in Auckland set alarms for 4am kickoffs.
Opening day drew 35 Tbps — already 52% above the 2022 FIFA World Cup Final peak of 23 Tbps — and by the time Germany played Curaçao three days later, the group stage peaked at 45 Tbps. Then the knockouts began, and each round brought new highs. 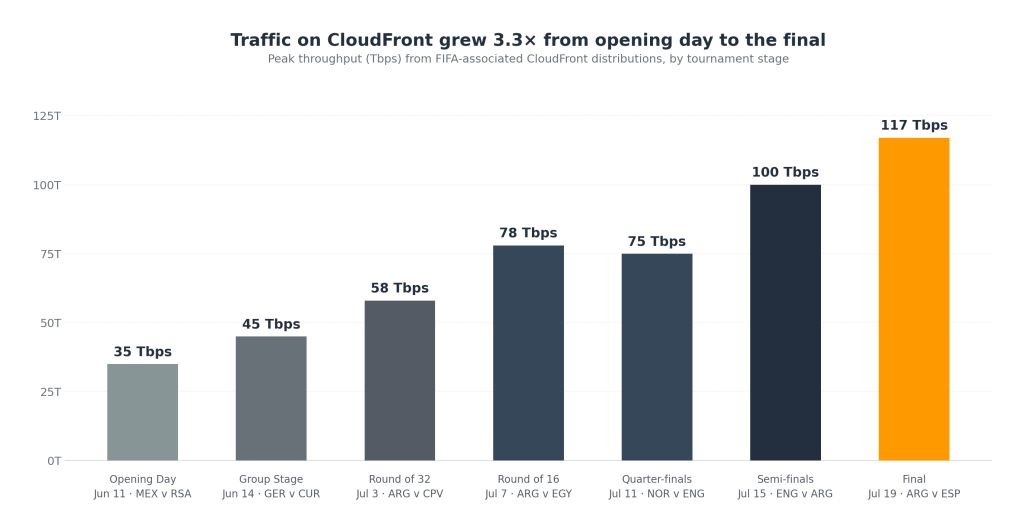
Nine matches exceeded 70 Tbps. The final between Argentina and Spain shattered the semi-final record by 17%. As teams were eliminated and audiences consolidated behind fewer matches, the load compounded, and CloudFront kept delivering.
How the world watched
Forty broadcasters ran forty different architectures. Peaks that overlapped, compounded, and surprised. The AWS Edge network carried all of it. That’s the bar for live sports delivery: holding quality at the exact moment millions of viewers lean forward at once. The goal, the penalty, the red card, and VAR (Video Assistant Referee) calls. CloudFront did just that; it held.
Previous World Cups were streamed in HD. This one was different. One of the world’s largest public broadcasters made the decision to deliver every match in full ultra-high definition, a first for any FIFA World Cup, and they chose CloudFront to carry the load.
One match, many screens
During the knockout rounds, Amazon CloudFront was simultaneously delivering low-latency HLS manifests with server-side ad insertion for viewers in São Paulo, Bogotá, and Lima. Full UHD segments at 25 Mbps per stream to 1.43 million concurrent viewers in the UK. Live streams to 11 countries for Prime Video. And 24 Tbps from a single US broadcaster alone. All on the same edge network, at the same moment. Each with different encoding ladders, DRM schemes, and origin architectures. That’s not a list of customers. That’s a multi-tenancy problem at a scale no other live event creates.
When Ferran Torres found the net in the 106th minute, 54 countries surged at once and as the match neared its end, traffic peaked at 21:57 UTC. The clock on the wall told a different story in each region, and so did the screen. In Los Angeles it was 2:57 PM on a Saturday afternoon: families gathered around living-room TVs, and Connected TV accounted for 65% of US traffic, with Roku leading at 20%. A few time zones away, it was primetime for big screen viewing in London at 10:57 PM and connected TVs led at 61%, with Samsung dominating at 26%. Connected TVs led at 55% with the German audience as well where it was 11:57 PM. Buenos Aires told a different story. At 6:57 PM on a peak Saturday evening, connected TV and mobile were nearly even across South America with Android TV leading in Argentina, Roku in Brazil. Half a world away in Hanoi, it was 4:57 AM Sunday. Dedicated fans set alarms and still watched on big screens: connected TV held at 74.5%, Samsung and LG splitting the ecosystem. Istanbul broke the pattern entirely. Just past midnight, viewers were awake but not on the couch. Personal screens, not social viewing. Turkey was the only market where desktop exceeded connected TV. Mobile led with 40%, desktop 34%, connected TV just 10%.

Resilience when it matters most
Live sports is unforgiving. When a goal goes in, there’s no second chance to deliver it. Either the stream works, or it doesn’t, and millions of people find out instantly.
The challenge isn’t just capacity. It’s simultaneous demand on shared paths. A goal scored sends millions of segment requests to the same peering links in the same second. A halftime whistle drops traffic sharply, then it floods back when the match resumes. Traffic shifts can occur unexpectedly. For example, on June 12, day two of the tournament, a third party CDN went down mid-game prompting a broadcaster to failover to CloudFront. CloudFront absorbed the failover, and the viewers just kept watching the game.
But no model predicted which teams would advance or more importantly what that means for traffic shifts. When Argentina took the pitch, Latin American broadcasters surged 2.4× their tournament average. England matches drove 3.7× more traffic from the UK. A Colombian broadcaster entered the group stage at 2.6 Tbps and one knockout draw later, 9.1 Tbps. Multiply that by 48 nations and a single-elimination bracket, and you have traffic that reshaped itself with every match result. The architecture had to absorb not just planned peaks, but emotional ones.
CloudFront’s automation handled this continuously: rebalancing delivery paths, shifting traffic toward available headroom, adapting as the audience moved with the game. Not a war room reacting to events but routine operation by design, keeping up with demand as traffic reshaped itself in real time. The system holding at kickoff was the same system holding at 117 Tbps in extra time. It kept optimizing.
That kind of readiness starts months before kickoff. Engineers across CloudFront, networking, unified operations, and media services modeled what five weeks of overlapping global matches would look like. Which regions would peak when, where simultaneous broadcaster load would be heaviest, how traffic would compound as teams were eliminated and audiences consolidated. The team pre-positioned capacity across the Americas, Western Europe, and Asia-Pacific, and raised concurrency limits proactively rather than reacting to demand.
Under the hood: the architecture behind the performance at peak
Delivering a live match at this scale demands more than throughput; it demands Quality of Experience at every decision point. Every layer of the stack must make the right call, independently, in milliseconds. Authenticate the viewer before the manifest loads. Place the segment in cache before the player requests it. Choose the delivery path with the lowest round-trip time, not just the shortest hop count. Absorb a bitrate switch from 720p to 4K UHD without introducing a rebuffer. When a path degrades mid-segment, failover before the player’s buffer runs dry, not after. Get any layer wrong, and the viewer misses the moment. Get them all right, at once, and the viewer just sees the match.
Here’s how CloudFront made that happen.
CloudFront’s edge network spans 750+ locations in major metros worldwide, but for live sports at this scale, “close” isn’t close enough. What made the difference during the World Cup was embedded PoPs, the 1,140+ points of presence deployed directly inside ISP networks. When a fan in Auckland pressed play at 4 AM, the segment was already inside their ISP, one hop away, not a trans-Pacific fetch from Sydney. In the US and Thailand, embedded PoPs served over 80% of match traffic, the bytes never needed to traverse a backbone link. That eliminated the peering congestion and latency spikes that compound when millions of viewers request the same segment at the same instant.
With content at the edge, the next challenge was controlling it. CloudFront Functions handled token validation and URL signing at sub-millisecond latency, authenticating viewers before a single byte left the edge network. CloudFront and AWS WAF helped ensure that threat actors and unauthorized traffic never reached origin by enforcing geo-restrictions and rate-limits at the edge.
CloudFront’s native origin failover routed around unhealthy packaging endpoints in milliseconds, invisible to the player. Origin Shield collapsed redundant cache-fill requests from hundreds of edge locations into a single fetch per segment per region, keeping origin load predictable even as viewership ramped 10–17× in the minutes before kickoff.
None of these layers operate in isolation. When embedded PoPs inside an ISP approached capacity, traffic management shifted new sessions to the nearest edge location before quality degraded, not after. When Origin Shield fulfilled a cache-fill for a new live segment, every edge location in that region had it available within milliseconds, eliminating redundant origin fetches. That’s what delivered 117 Tbps without a viewer noticing, not any one layer, but all of them, working together in concert.
The final whistle
The final between Argentina and Spain on July 19 in New Jersey capped the tournament at 117+ Tbps, CloudFront’s largest live-streaming moment ever. In 2022 the tournament peaked at 23 Tbps on CloudFront, in 2026 it peaked at 117 Tbps — more than 5× in a single World Cup cycle — and it felt just as routine. Five weeks. 104 matches, with viewers spread across 54 countries. Not even one had to think about the network underneath. They were too busy watching the game. That’s what infrastructure is supposed to do, disappear.
The next record is coming. If you’re planning a global live event and you want to know it’ll hold, get started with Amazon CloudFront.
About the authors

Bhagirath Gaonkar
Bhagirath is a Senior Product Manager at AWS based in San Francisco, where he brings over 15 years of experience to building scalable, secure content delivery products for Amazon CloudFront. Outside of the office, he is an avid horology enthusiast and an active pickleball player.

Abhimanyu Varshney
Abhimanyu Varshney is a Senior Enterprise Account Engineer specializing in Media Delivery at Amazon Web Services (AWS). In this role, he plays a crucial part in assisting customer with the successful delivery of large-scale events on Over The Top platform. Abhimanyu’s expertise lies in AWS Edge Services, where he focuses on guiding and supporting customers in adopting these cutting-edge technologies to enhance their security, performance, and scalability within the AWS environment.