Networking & Content Delivery
Introducing Amazon CloudWatch Metrics for AWS Direct Connect virtual interfaces
AWS Direct Connect (DX) recently launched support for virtual interface (VIF) metrics in Amazon CloudWatch. With this new enhancement, CloudWatch can now track metrics at the DX VIF level and provide greater insight into utilization. You can set up alarms based on metrics and trigger actions to remediate problems.
I’ve heard from many customers that they wanted greater visibility into traffic utilization when using multiple VIFs on the same connection – dedicated or hosted. I’m excited about this release as there is now a solution! In this post, I dig into this new functionality and how it compares to the prior capability.
Before VIF metrics
Before this launch it was possible to see aggregated metrics at the Direct Connect connection. However, it was not possible to view individual VIFs and determine throughput utilization. This is shown in the following screenshot.

In this case, a 10-Gbps DX connection has a transit VIF for AWS Transit Gateway connectivity, a public VIF for connectivity to public AWS resources, and a private VIF for connectivity to a VMware environment. Looking at the screenshot you can see that there was a bit of a spike in throughput, with up to 300-Mbps of traffic. Given connection only metrics, there is not an easy way to drill down and determine which VIF is the source of this traffic.
VIF-level metrics
Now that that there are VIF level metrics we see a new set of metrics in the CloudWatch console.

I can now dig in further to see which VIF is responsible for the traffic.

Here I can see that there are metrics for the VIF that resides within my DX account, but the numbers don’t add up! From the screenshot, you can see that the peak here is only around 8-Mbps. It turns out that the other VIFs are hosted VIFs and actually reside in a different account than the DX connection. Fortunately it is quite simple to share CloudWatch metrics across accounts.
Shared metrics
CloudWatch metrics can be viewed cross-region and cross-account. After setting up the cross-account access, I can see a drop-down in the console to view data from the shared account.

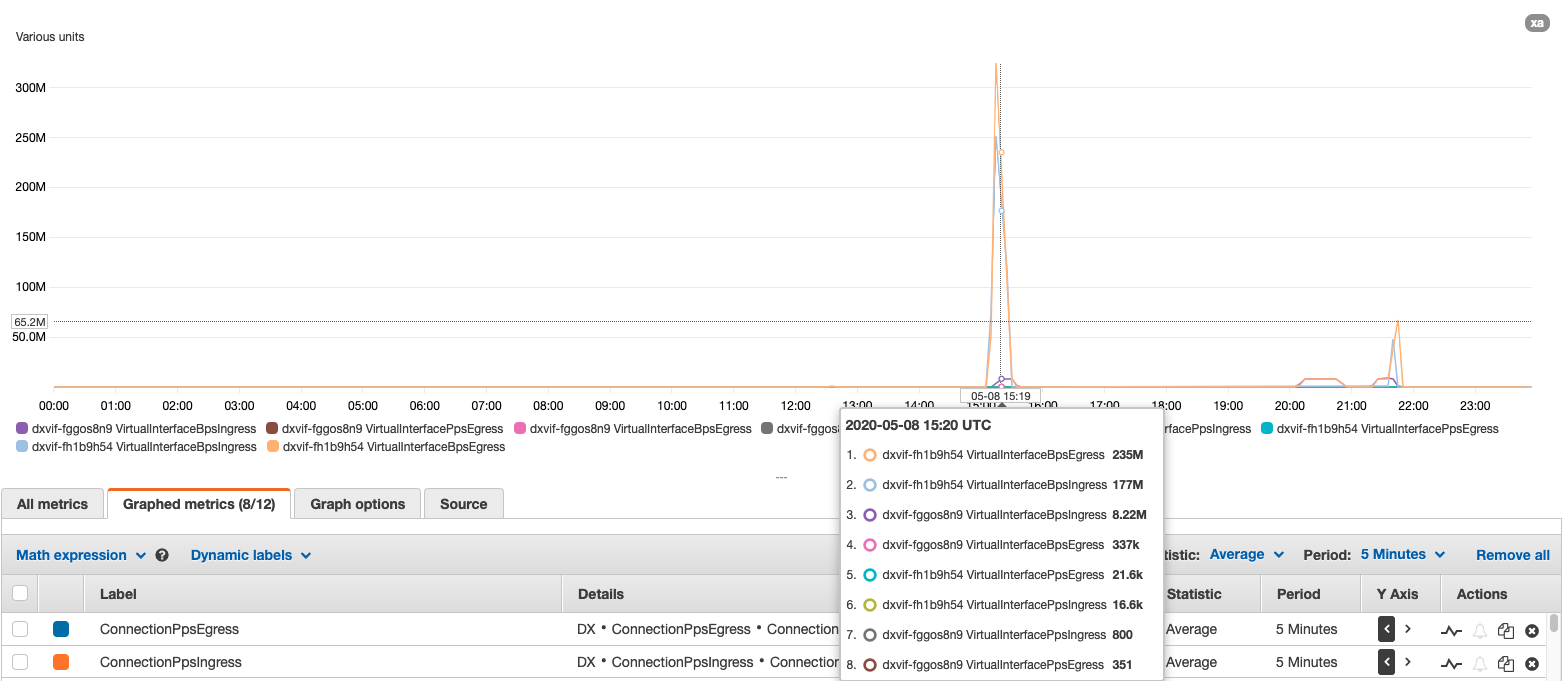
From the drop-down menu, I can select an account and view its metrics. I can graph these metrics alongside the VIF that exists within the DX account.

Now I can see the complete picture! It looks like the transit VIF in the shared account was primarily responsible for the spike in data. This is not too much of a surprise as I was running iperf to generate traffic for this testing, but none the less I am able to get a holistic view of my DX utilization. If I wanted to have a baseline of metrics in an ongoing basis, I could simply enable anomaly detection as show below.

Note that there is a fee if anomaly detection is enabled, so be sure to check the CloudWatch pricing page. I enabled this on a VIF metric for BpsEgress (bytes per second egress) as shown in the following image.

Once anomaly detection is enabled I can see that traffic spikes are outside the ordinary baseline for traffic. I also can see the expected rate of traffic.
Conclusion
In this post I showed how VIF CloudWatch metrics can be used and shared between accounts. For a full list of CloudWatch metrics supported by DX you can view the documentation. With this new capability even greater visibility into DX utilization is now possible!