Networking & Content Delivery
Streamline AWS Client VPN usage reporting with Amazon CloudWatch Logs Insights queries
AWS Client VPN is a managed client-based VPN service that enables you to securely access your Amazon Web Services (AWS) resources and resources in your on-premises network. Amazon CloudWatch Logs Insights allows you to interactively search and analyze your log data in Amazon CloudWatch Logs. You can perform queries to help you more efficiently and effectively respond to operational issues.
Monitoring and reporting on Client VPN service usage is crucial for understanding costs and network activity. This is especially important when using a full tunnel rather than split tunneling. However, generating custom usage reports can be time-consuming. This post shows how to use CloudWatch Logs Insights and AWS CloudFormation to automate the creation of pre-defined queries to generate the reports you need.
The challenge
Many users find it challenging to generate reports for their Client VPN service efficiently. Manually creating reports is time-intensive, especially when deploying to multiple AWS accounts. This process is often prone to errors, leading to potential inaccuracies and wasted resources.
Solution overview
In this post we guide you through implementing a consistent reporting process using CloudFormation. This solution reduces the risk of human error when deploying into multiple AWS accounts and streamlines the report generation process.
Users can use CloudFormation to implement a repeatable process for creating usage reports, thus reducing the risk of human error, as shown in the following figure.
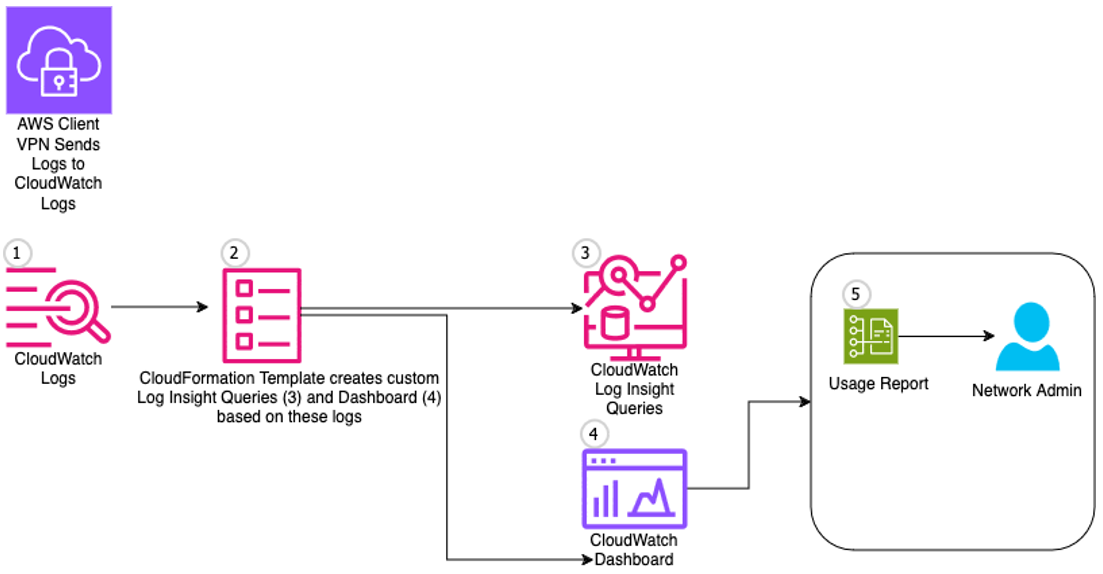
Figure 1: CloudFormation creating Log Insight reports solution architecture
Client VPN logs connection metrics in CloudWatch Logs. The user data for any given user’s connection is logged under the “connection-log-type”: “connection-reset” log, such as the Client VPN ID, username, common-name, ingress/egress bytes, and connection times. Our solution uses these logs as a rich data source for generating usage reports.
For users with enhanced security requirements, CloudWatch Logs supports the encryption of log data at rest using AWS Key Management Service (AWS KMS). This feature allows you to encrypt your log data with your own KMS keys, providing another layer of security for sensitive VPN usage information. More details on connection logging can be found in the documentation, such as the example connection log entry.
{
     "connection-log-type": "connection-reset",
     "connection-attempt-status": "NA",
     "connection-attempt-failure-reason": "NA",
     "connection-id": "cvpn-connection-0205ab4a2bEXAMPLE ",
     "client-vpn-endpoint-id": " cvpn-endpoint-0102bc4c2eEXAMPLE",
     "transport-protocol": "udp/tcp",
     "connection-last-update-time": "2021-02-09 14:18:52",
     "client-ip": "192.168.0.50",
     "common-name": "client1.company.com",
     "username": "username-xyz",
     "device-type": "mac/windows/linux",
     "device-ip": "123.124.125.126",
     "port": "12345",
     "ingress-bytes": "3766",
     "egress-bytes": "5177",
     "ingress-packets": "28",
     "egress-packets": "62",
     "connection-end-time": "2021-02-09 14:18:52",
     "connection-reset-status": "NA",
     "connection-duration-seconds": "65"
}
Consider the fields presented in the connection log entry JSON output. Depending on the type of query you want to run you can either filter the data based on these fields or aggregate the data based on these fields. In this example, we use the following fields:
| Field : | Example : |
| The Client VPN ID | “connection-id”: “cvpn-connection-0205ab4a2bEXAMPLE “ |
| Username (for Active Directory (AD) and Federated Auth) | “username”: “username-xyz” |
| Common-name (for Mutual Authentication) | “common-name”: “client1.company.com” |
| Ingress-bytes | “ingress-bytes”: “3766” |
| Egress-bytes | “egress-bytes”: “5177” |
| Connection start/end times | “connection-start-time”: “2021-02-09 14:17:47”,
“connection-end-time”: “2021-02-09 14:18:52” |
| Connection duration seconds | “connection-duration-seconds”: “65” |
We developed a CloudFormation template to create and persist helpful CloudWatch Logs Insights queries on a CloudWatch dashboard. The template provides queries for the following:
a. Total Usage per Client VPN Endpoint: Summarizes total usage statistics (connection count, data transfer, connection time, and unique users) for each VPN endpoint.
b. AD or SAML Auth Users Connection Duration: Shows detailed connection information for AD or SAML authenticated users, such as connection duration in minutes.
c. AD or SAML Auth Distinct Users Connection Duration: Aggregates connection statistics for distinct AD or SAML authenticated users.
d. AD or SAML Auth Distinct Users: Lists distinct AD or SAML authenticated users and their last used VPN endpoint.
e. AD or SAML Auth Total Usage Report: Provides a total usage summary for each AD or SAML authenticated user.
f. Mutual Auth Users Connection Duration: Shows detailed connection information for mutually authenticated users, such as connection duration in minutes.
g. Mutual Auth Distinct Users Connection Duration: Aggregates connection statistics for distinct mutually authenticated users.
h. Mutual Auth Distinct Users: Lists distinct mutually authenticated users and their last used VPN endpoint.
i. Mutual Auth Total Usage Report: Provides a total usage summary for each mutually authenticated user.
j. Mix Auth Users Connection Duration: Shows detailed connection information for all users (mixed authentication types), such as connection duration in minutes.
k. Mix Auth Distinct Users Connection Duration: Aggregates connection statistics for distinct users across all authentication types.
l. Mix Auth Distinct Users: Lists distinct users across all authentication types and their last used VPN endpoint.
m. Mix Auth Total Usage Report: Provides a total usage summary for each user across all authentication types.
You can deploy this template into your AWS account to make these queries viewable from the CloudWatch Logs Insights saved queries tab.
Prerequisites
The user deploying this CloudFormation template needs the following AWS Identity and Access Management (IAM) permissions:
{
  "Version": "2012-10-17",
  "Statement": [
    {
      "Effect": "Allow",
      "Action": [
        "cloudformation:CreateStack",
        "cloudformation:UpdateStack",
        "cloudformation:DeleteStack",
        "logs:PutQueryDefinition",
        "logs:DeleteQueryDefinition",
        "cloudwatch:PutDashboard",
        "cloudwatch:DeleteDashboards"
      ],
      "Resource": "*"
    }
  ]
}
Walkthrough
The following steps walk you through the solution.
1. Deploying the CloudFormation template
To get started, you can deploy the CloudFormation template in your AWS account. The template allows you to specify a folder name to organize the queries in the CloudWatch Logs Insights console.
a. Download the CloudFormation template onto your local machine.
b. Visit the CloudFormation console in the AWS Region where your prerequisite file systems are located.
c. Choose Create stack and then choose With new resources (standard).
d. On the Create stack page, choose Upload a template file and then choose the CloudFormation template, CloudWatch_Dashboard_ClientVPN.yml, previously downloaded.
e. Provide input for the following necessary parameters:
- Stack Name: The name of this stack.
- Folder: The folder to store the queries in, viewable from the CloudWatch Insights saved queries tab. The default value is aws-client-vpn.
- ClientVPNLogGroup: Name of the Client VPN CloudWatch Log Group. In this post we use the log group named “aws/aws-client-vpn/prod/”
Log group structure example:
/aws/client-vpn
  |- /prod
    |- /AD-log-stream-endpoint-1234abca
      |- connection-logs
    | - /SAML-log-stream-endpoint-1234abcb
      |- connection-logs
    | - /MutualAuth-log-stream-endpoint-1234abcc
      |- connection-logs
To make the sample queries and dashboards easy to manage, we recommend that you use a common CloudWatch Log Group with an individual Log Stream per endpoint type if you have multiple endpoints with different authentication methods. This approach is shown in the Log Group structure example.
f. Choose Next on the Configure stack options page.
g. Choose Submit on the Review and create page.
h. The stack deploys in approximately ten seconds. In the CloudFormation console, wait for the stack to have a status of CREATE_COMPLETE. Then, choose your stack and the Outputs tab.
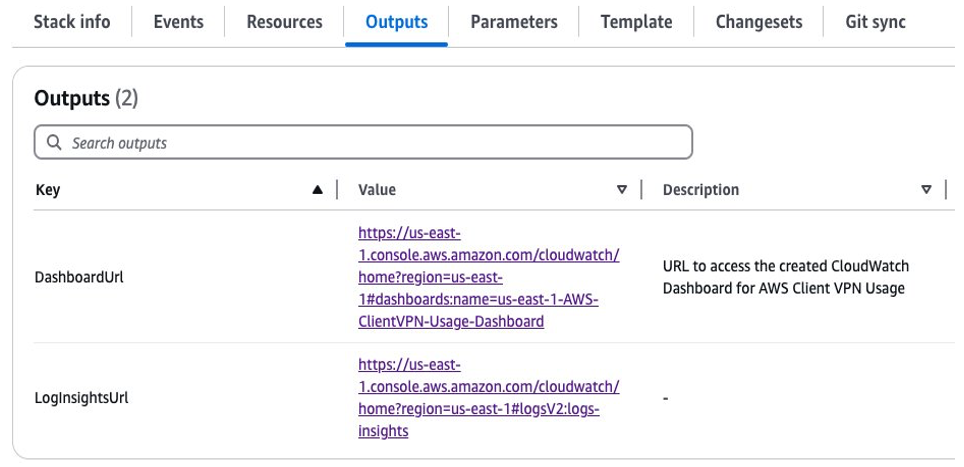
Figure 2: CloudFormation Outputs Tab Link to Log Insights console
Choose the link under the Value column that takes you to the Log Insights console, as shown in the preceding figure.
2. Using the queries
When this is deployed, you can find the persisted queries in the CloudWatch Logs Insights console under the specified folder (aws-client-vpn). From there you can run and customize the queries to generate your needed reports, as shown in Figure 3.
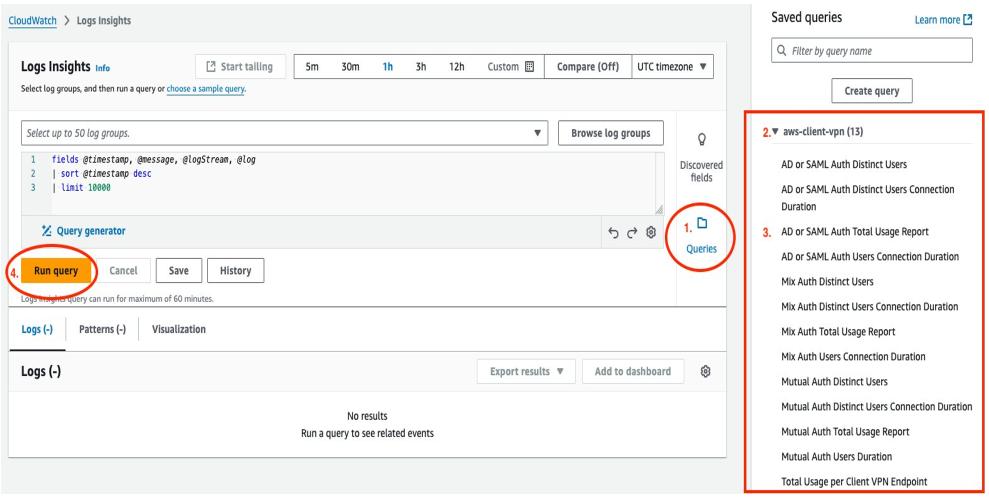
Figure 3: CloudWatch Log Insights Console showing saved Client VPN queries
3. Using the dashboard
The newly created CloudWatch dashboard provides a comprehensive view of your Client VPN usage patterns. The following steps show how to make the most of it.
Accessing the dashboard
After deploying the CloudFormation stack, find the DashboardUrl in the Outputs section, as shown in Figure 2. Choose this link to open your dashboard directly.
Understanding the layout
The dashboard is organized into several widgets, each representing a different aspect of VPN usage. They are arranged from top to bottom, covering total usage, authentication-specific metrics, and user-specific data, as shown in Figure 4.
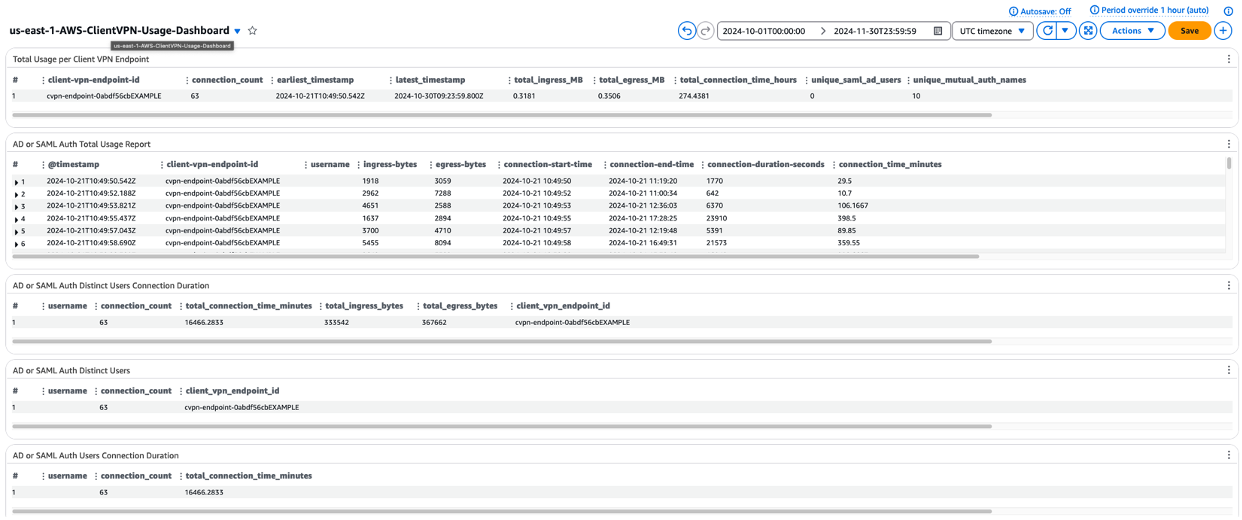
Figure 4: CloudWatch dashboard showing AD or SAML Auth Total Usage Report
Interpreting the data
Total Usage per Client VPN Endpoint: This top widget gives you an overview of usage across all of your VPN endpoints. Look for patterns in data transfer and connection times, as shown in Figure 5.
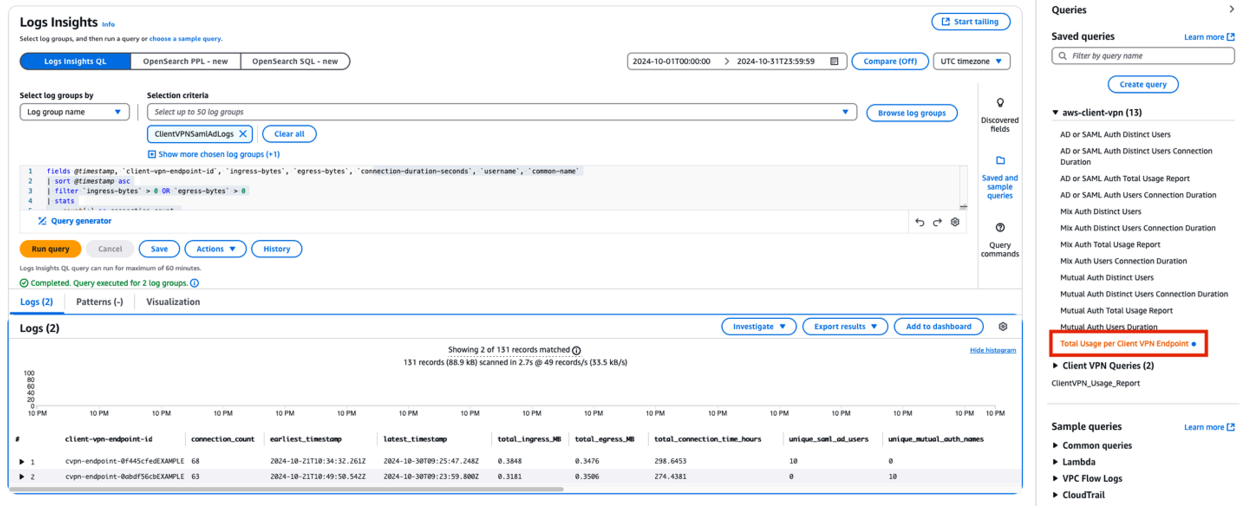
Figure 5: CloudWatch Log Insights console showing Total Usage Per VPN Endpoint
Authentication-Specific Reports: Separate sections for AD/SAML, Mutual Auth, and Mixed Auth provide insights into usage patterns for different authentication methods, as shown in Figure 6.
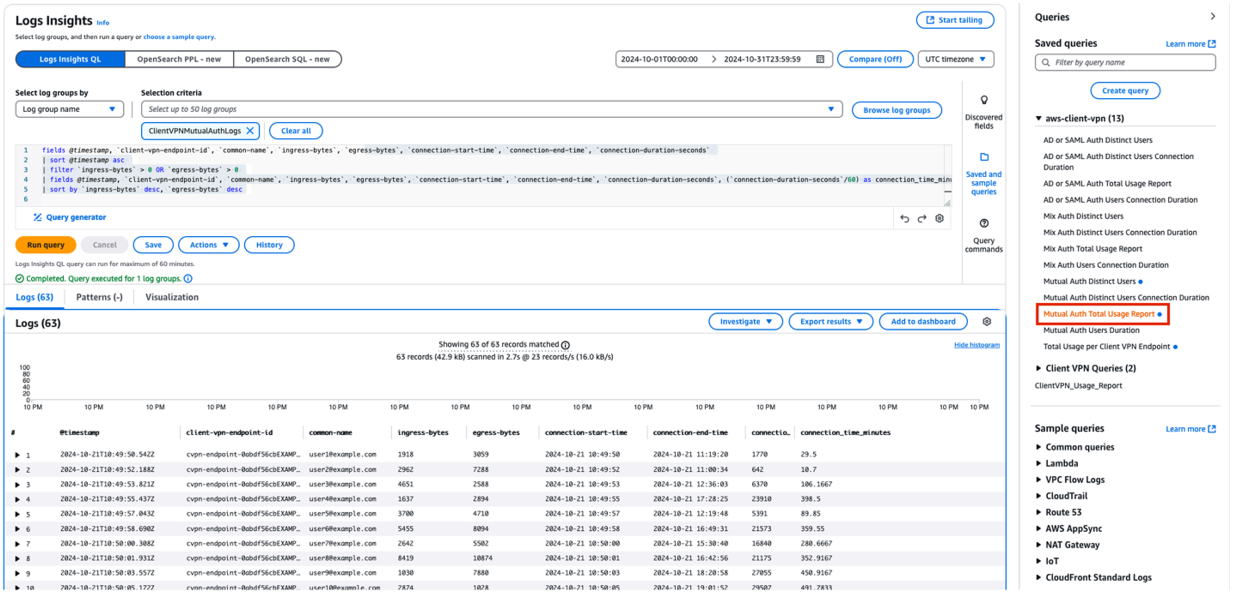
Figure 6: CloudWatch Log Insights console showing Mutual Auth Total Usage
Distinct Users: These widgets help you track the number of unique users and their usage patterns, which is crucial for capacity planning and security audits, as shown in Figure 7.
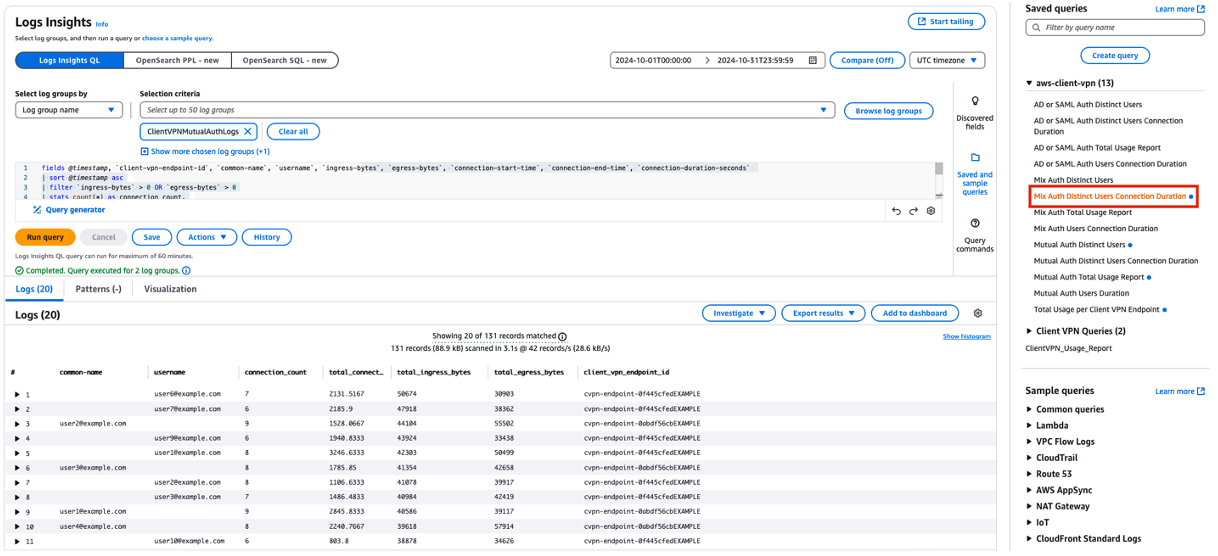
Figure 7: CloudWatch Log Insights console showing Mixed Auth Distinct Users Connection Duration
Using time range controls
At the top of the dashboard, use the time range selector (1h, 3h, 1d, 1w, and custom) to adjust the period for which you’re viewing data, as shown in Figure 8. This is helpful for analyzing trends over time or investigating specific incidents.
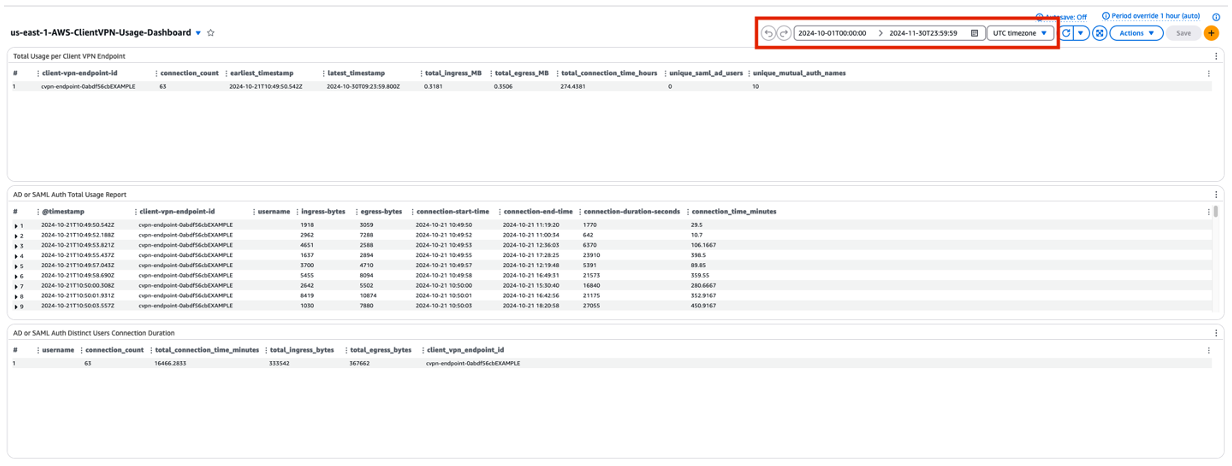
Figure 8: CloudWatch dashboard console showing Client VPN Queries
Setting up alerts
Although CloudWatch Alarms isn’t directly part of the dashboard, consider setting it up based on the metrics you see. For example, you might want to be alerted if the number of unique users exceeds a certain threshold.
Regular review
Review this dashboard regularly. Look for the following:
- Unusual spikes in data transfer or connection counts
- Changes in the ratio of different authentication methods
- Growth trends in user counts or connection duration
Regularly engaging with this dashboard provides valuable insights into your VPN usage patterns, aiding decisions about capacity, security, and user experience.
This dashboard is a starting point. As you become more familiar with your VPN usage patterns, feel free to modify the queries or add new widgets to better suit your specific monitoring needs.
Security best practices
Access control: Limit access to the CloudWatch dashboard and Logs Insights queries to only those who need it for operational purposes. Use IAM to implement least-privilege access.
The IAM role used by the dashboard and queries needs the following permissions:
{
  "Version": "2012-10-17",
  "Statement": [
    {
      "Effect": "Allow",
      "Action": [
        "logs:StartQuery",
        "logs:GetQueryResults",
        "logs:GetLogEvents",
        "logs:FilterLogEvents",
        "logs:DescribeLogGroups",
        "logs:DescribeLogStreams"
      ],
      "Resource": [
        "arn:aws:logs:*:*:log-group:/aws/aws-client-vpn/*:*"
      ]
    },
    {
      "Effect": "Allow",
      "Action": [
        "cloudwatch:GetDashboard",
        "cloudwatch:GetMetricData",
        "cloudwatch:ListDashboards"
      ],
      "Resource": "*"
    }
  ]
}
Resource restrictions: Consider restricting the log group access to specific VPN endpoints by specifying exact Amazon Resource Names (ARNs) in the IAM policy instead of using wildcards.
Data privacy: The dashboard and queries may contain sensitive information about VPN usage patterns and user identities. Implement appropriate controls to protect this data:
- Use AWS Organizations SCPs to restrict access to specific accounts
- Enable AWS CloudTrail to monitor and audit dashboard access
- Consider implementing more tags for resource-based access control
Compliance: If you’re operating in regulated environments, then make sure that the retention and access patterns for VPN logging data align with your compliance requirements.
Regular reviews: Periodically review access permissions and remove unnecessary access to maintain security posture.
Remember to replace the log group ARN in the IAM policies with your specific log group ARNs and adjust the permissions based on your organization’s security requirements and compliance needs.
Next steps
- Explore advanced query customizations for specific reporting needs.
- Integrate these reports into your regular network monitoring processes.
- Consider automating actions based on the reports using AWS Lambda and Amazon EventBridge.
Conclusion
Using these Amazon CloudWatch Logs Insights queries and AWS CloudFormation allows you to quickly generate AWS Client VPN usage reports without building them from scratch. This solution streamlines the reporting process, saves time, and reduces errors when redeployed in other AWS accounts.
We encourage you to try out the CloudFormation template.
About the authors

Calvin Bock
Calvin is a Senior Cloud Support Engineer at AWS, based in Cape Town, South Africa. He specializes in AWS networking and serves as a subject matter expert in VPN, VPC, Transit Gateway, CloudWAN, and Direct Connect. Calvin works closely with customers to troubleshoot complex networking challenges and architect robust, scalable network solutions on AWS. Through his deep technical expertise and hands-on approach, he enables organizations to optimize their cloud networking infrastructure and achieve reliable, secure connectivity.

Peter-John Morgenrood
Peter-John is a Senior Specialist Solutions Architect for Migration and Modernization at AWS, based in Amsterdam. He partners with enterprise customers across Northern Europe to architect and implement complex cloud transformation initiatives, specializing in Windows and VMware workloads, Amazon AppStream 2.0, and Amazon FSx for Windows File Server. Combining deep technical expertise with a consultative approach, Peter-John enables organizations to accelerate their digital transformation and maximize the benefits of AWS services.