Networking & Content Delivery
Visualizing network performance of your AWS Cloud workloads with Network Flow Monitor
AWS launched Network Flow Monitor at re:Invent on December 1st, 2024, a new Amazon CloudWatch Network Monitoring feature that offers network performance monitoring across AWS managed services. With Network Flow Monitor, you can get near real-time visibility into network traffic between compute resources (Amazon Elastic Compute Cloud (Amazon EC2) and Amazon Elastic Kubernetes Service (Amazon EKS)) and AWS services, such as Amazon S3 and Amazon DynamoDB, as well as AWS infrastructure. This collected data can help you identify and resolve network issues for your application more quickly by reducing troubleshooting time for your cloud environment.
Observability challenges with cloud networks
When applications experience high latency, network issues are often the first suspected cause, whether in cloud or on-premises environments. As many of you may already know, traditional network monitoring tools provide limited visibility into AWS network infrastructure and its network performance between AWS managed services. This can extend troubleshooting processes and impact both mean time to detect (MTTD) and mean time to recovery (MTTR).
CloudWatch performance monitoring features
Network Flow Monitor allows CloudWatch to provide comprehensive observability services for both Network Monitoring and Application Performance Monitoring (APM), as shown in the following figure.

Figure 1. CloudWatch Application Performance Monitoring and Network Monitoring features
Network Flow Monitor uses lightweight agents that you install on your resources to collect performance metrics directly from actual workload traffic for near real-time monitoring. Network Flow Monitor tracks critical network metrics, such as data transferred, retransmissions, retransmission timeouts, and round-trip time.
Furthermore, a standout feature of a flow monitor is the network health indicator (NHI). NHI enables you to determine whether a network degradation is caused by AWS infrastructure problems or not. When network latency occurs, this indicator is invaluable to help you attribute the cause of the issue, so that you can focus your troubleshooting efforts effectively.
The CloudWatch Network Monitoring suite provides a range of network performance features. To learn more, see the Using Internet Monitor or Using Network Synthetic Monitor documentation.
The following sections describe how to use Network Flow Monitor to visualize network performance through an example scenario.
Example monitoring scenario
In this section we observe an example of two EC2 instances in different VPCs, in the same region, connected with AWS Transit Gateway.
Currently, Network Flow Monitor doesn’t include cross-Region support.
For our example, we’ve installed an agent on an EC2 instance, test-instance-1, in VPC 1, to provide network performance data. We’ve also built an Apache web server on a second EC2 instance, test-instance-2, in VPC2. Furthermore, we have enabled the httpd service, as shown in the following figure. In the next section we describe how to install agents in detail.

Figure 2. Example of an inter-VPC network monitoring setup for Network Flow Monitor
Unlike active monitoring solutions, Network Flow Monitor provides ongoing passive monitoring, which analyzes actual user traffic between workloads. We’ve created test traffic from test-instance-1, with the agent installed, to test-instance-2, the Apache web server, as shown in the following figure.
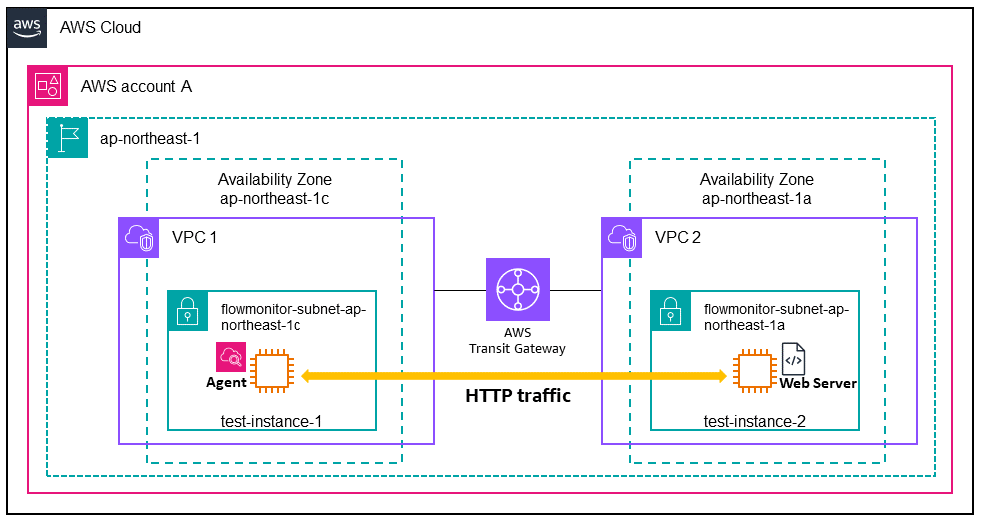
Figure 3. Agent collects data for HTTP traffic flows between an instance in VPC 1 and a web server in VPC 2
Agents don’t have access to the payload of your TCP connections. Agents receive only what is called the bpf_sock_ops structure from the Linux kernel. This structure provides the local and remote IP addresses, and the local and remote TCP ports, as well as counters and round-trip times.
Network Flow Monitor setup
In this section we walk through setting up Network Flow Monitor based on our example scenario. To set up Network Flow Monitor to view performance metrics for network flow, do the following:
- Enable Network Flow Monitor
- Install Network Flow Monitor agents
- Review network flows in Workload insights
- Create one or more flow monitors
Step 1: Enable Network Flow Monitor
Before we can use Network Flow Monitor, we must enable the necessary permissions to send data to CloudWatch and to map our network connections. When you navigate to Network Flow Monitor in the console for the first time, you’re prompted to enable the feature, as shown in the following figure.

Figure 4. Enabling Network Flow Monitor
Enabling Network Flow Monitor sets up the permissions and creates your monitoring scope. Currently, the monitoring scope is the AWS account you’re signed in with. For more information, see Enable Network Flow Monitor. You only need to enable the feature the first time that you choose the feature in a Region.
Wait for a short time (up to 30 minutes) while Network Flow Monitor grants permission to use the necessary service-linked roles with your account, and sets up monitoring scope for your AWS account.
Step 2: Install Network Flow Monitor agents
When you install agents on your instances, you must also set permissions for the agents so that they can send data to the Network Flow Monitor backend. This is the data that enables you to monitor network performance. There are specific requirements for the Linux versions that you can use on your instances, which are listed in the Amazon CloudWatch documentation.
You can install agents on EC2 instances, self-managed Kubernetes instances, or Amazon EKS. In this post, we follow the steps described in Install and manage agents for EC2 instances in the AWS documentation. For more information about installing agents with Kubernetes or Amazon EKS, see Install Network Flow Monitor agents on instances.
To enable the correct permissions, the EC2 instances running agents must use a role with the policy CloudWatchNetworkFlowMonitorAgentPublishPolicy, as shown in the following figure.

Figure 5. Attaching Network Flow Monitor policy to the role of the target instance
We recommend that you add the permissions before you install agents on the EC2 instances. If an instance doesn’t have an role, create a new role and attach the policy mentioned previously.
Next we install the agents in the instances. To install the agents, we use AWS Systems Manager Agent, a feature of AWS System Manager. Before you begin installing agents, make sure that each instance is running Systems Manager Agent. For more information, see Working with Systems Manager Agent.
To install agents on EC2 instances, do the following:
- In the Console, open the AWS Systems Manager console.
- Under Node Tools, choose Distributor.
- Under Owned by Amazon, locate the Network Flow Monitor package: AmazonCloudWatchNetworkFlowMonitorAgent.
- Choose the package, and then choose Install one time or Install on schedule, as shown in the following figure.

Figure 6. In Systems Manager, choose the Network Flow Monitor agent package
- Choose the EC2 instances on which to install agents. For our example, we choose only test-instance-1, as shown in the following figure. However, if you want to install agents on multiple instances, it can be more efficient to choose instances based on tags or resource groups.

Figure 7. In Systems Manager, choose the instances on which to install agents
- Finally, choose Run to start the agent installation.
After the installation successfully completes, you should see a command status message, as shown in the following figure.

Figure 8. Successful agent installation on target instance
Step 3: Review network flows in Workload insights
After you enable Network Flow Monitor and install the agents, you can review the network flow performance data in the console. We recommend that you start with console visualizations to understand your workloads’ trends and traffic patterns.
In the CloudWatch console, under Network Monitoring, choose Flow monitors. Then, on the Workload insights tab, you can review top contributor network flows. You can identify which flows you want to monitor in more detail. This information is displayed in the figure below. For more details, see Evaluate network flows with workload insights.

Figure 9. Network flow data in CloudWatch
To deep dive into specific network flows, you can create a monitor, which can be done in one of two ways. You can choose network flows in Top contributors, then choose Create monitor. Or, you can choose Create monitor, and then specify individual local and remote resources to monitor the network flows between, as described in Step 4.
Step 4: Create a flow monitor
To get started creating a monitor, in the Network Flow Monitor console choose Create monitor, as shown in the following figure.

Figure 10. Creating a monitor in Network Flow Monitor
When you create a monitor, we recommend that you complete all steps at once, as you won’t be able to save any work to continue later.
Follow the steps in the create monitor flow. For our example, we’ll provide the following information for the monitor.
- For Monitor name, we choose monitor-ap-northeast-1c-1a, as shown in the following figure.

Figure 11. Specify a name for the flow monitor
- For Local resources, specify the types of network flows that you want to monitor, then choose specific options for each one. The types of local resources that Network Flow Monitor supports are: Subnet, VPC, or Availability Zone. For our example, we select the subnet where the instance resides, flowmonitor-subnet-ap-northeast-1c, as shown in the following figure.

Figure 12. Choose one or more local resources for the flow monitor
- For Remote resources, choose Everywhere or Select remote resources. If you choose Everywhere, the monitor includes all network flows that originate from the selected local resources. Otherwise, you can choose specific remote resources to monitor. With this option, you can choose one or more resources in subnets, VPCs, Availability Zones (AZs), or AWS services, such as Amazon S3 and DynamoDB.
For our example, we specify one subnet as the remote resource hosting our web server, flowmonitor-subnet-ap-northeast-1a, as shown in the following figure. Choosing one local resource and one remote resource allows our monitor to include information for the network flows between just these two resources.

Figure 13. Choose remote resources for the flow monitor
- Choose Next, and then review the configuration for the monitor.
- Choose Create monitor.
After you create the monitor, wait up to 30 minutes for Network Flow Monitor to begin collecting and aggregating data.
Visualizing Network Flow Monitor metrics
After you create a monitor, Network Flow Monitor begins publishing end-to-end performance metrics, as well as a network health indicator for network degradation issues. You can visualize the information for a monitor in the Network Flow Monitor console, or you can find the metrics in the CloudWatch metrics, under the custom namespace, AWS/NetworkFlowMonitor.
For our example, we look in the Network Flow Monitor console to see the performance data for our monitor. On the Monitors tab, we choose the monitor, monitor-ap-northeast-1c-1a, as shown in the following figure.

Figure 14. Viewing performance data in a flow monitor
To get an overall view of the network flows for the monitor, we check out the Overview tab, as shown in the following figure.

Figure 15. Visualizing performance metrics on the Overview tab for the monitor
Next, go to the Historical explorer tab to see more detailed metrics for monitored network flows. For example, when there’s performance degradation, the topology feature displays all components in the network path, with service icons and resource IDs. As shown in the following figure, this visualization helps you identify top contributors for each performance metric and bucket pairs in the specified time frame for recovery actions.

Figure 16. Visualizing network flow topologies for a degradation issue
Resources clean-up
After concluding your Network Flow Monitor evaluation, promptly remove all test monitors and provisional resources. This helps your organization avoid unnecessary expenditures while maintaining efficient resource management.
Conclusion
In this post, we introduced Network Flow Monitor, a new observability feature of Amazon CloudWatch Network Monitoring that provides near real-time visibility of network performance for workloads between compute instances and AWS services. Using the range of metrics and information that flow monitors provide, you can quickly analyze and act on network performance degradation for your cloud workloads, and minimize troubleshooting time.
Learn more about Network Flow Monitor
Now that we’ve shared an overview of the benefits of Network Flow Monitor, check out the following additional information for details:
- To learn more about pricing, visit the CloudWatch pricing page.
- Flow Monitor is currently available in 17 AWS Regions. For a complete list, see the documentation.
- For details and technical guidance about Network Flow Monitor, see the technical documentation.
About the authors

Hiroki Fujii
Hiroki is a Senior Technical Account Manager based out of Singapore. Prior to joining AWS, he had over 10 years of experience in designing, building, and operating on-premises networks, including data centers, campus networks, and backbone networks. Outside of work, he loves working out, golfing, and exploring new countries and cultures with his wonderful family.

Vishwas Puttasubbappa
Vishwas is a Principal Product Manager Technical in AWS Networking. He has been working in the networking space for the past 20 years, designing and building networks and networking products. Outside of work, he enjoys spending most of his time with his family.