AWS Open Source Blog
Validating OpenTelemetry Configuration Files with the otel-config-validator
OpenTelemetry provides open source APIs, libraries, and agents to collect distributed traces and metrics for application monitoring. The AWS Distro for OpenTelemetry (ADOT) provides a secure production-ready distribution of OpenTelemetry (OTel) that allows for instrumentation and collecting of metrics and traces.
The ADOT collector can be used to collect and export telemetry data. Within the collector, observability pipelines are defined using a YAML configuration file.
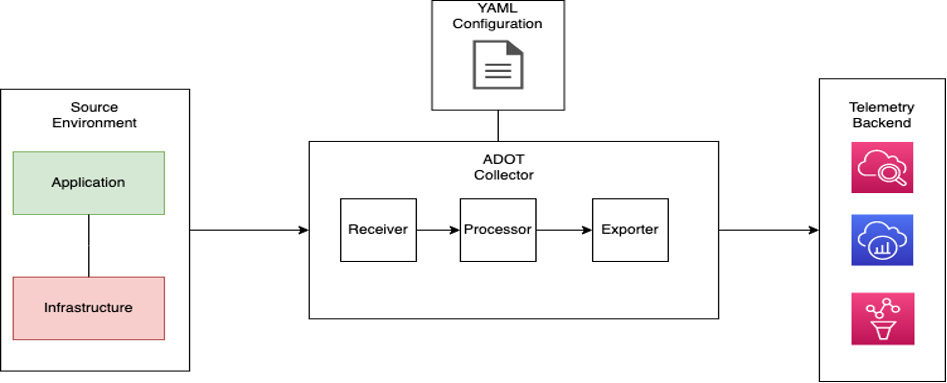
This figure shows a typical architecture for collecting and exporting telemetry using ADOT. The ADOT collector has a number of components to select from that support common observability patterns. For example, the ADOT collector could be configured with a ‘prometheusreceiver’ component to collect Prometheus metrics, and a ‘prometheusremotewriteexporter’ component to export the metrics to a supported backend such as Amazon Managed Service for Prometheus.
When creating an observability pipeline with various different components, there is a potential for syntactic error in the YAML file which would prevent your pipeline from operating effectively. Having a telemetry pipeline non-functional may cause gaps in observability that can lead to application downtime.
As part of an ongoing partnership between the ADOT team and observability provider Lightstep, an open source OTEL configuration validator has been created by Lightstep that supports all ADOT components. The goal of the validator is to assist with error-checking OTEL configuration files during development so potential mis-configurations can be addressed before causing issues. The project, released under the Apache-2.0 license, can be found on GitHub with full source code and usage instructions. In this blog post, we will show an example of how you can use the otel-config-validator in both GUI mode and CLI mode to validate an OpenTelemetry config file.
Usage
The validator has two possible modes of operation.
- A WebAssembly GUI that you can compile and view in the local browser.
- A CLI tool you can use in the terminal.
Local GUI
You can build and deploy the validator as a WebAssembly application for GUI interaction:
Open up a local terminal and run the following:
Once built and running, the application looks like this:

There are a few example configurations provided and you can paste in your own OTel configuration YAML to validate.
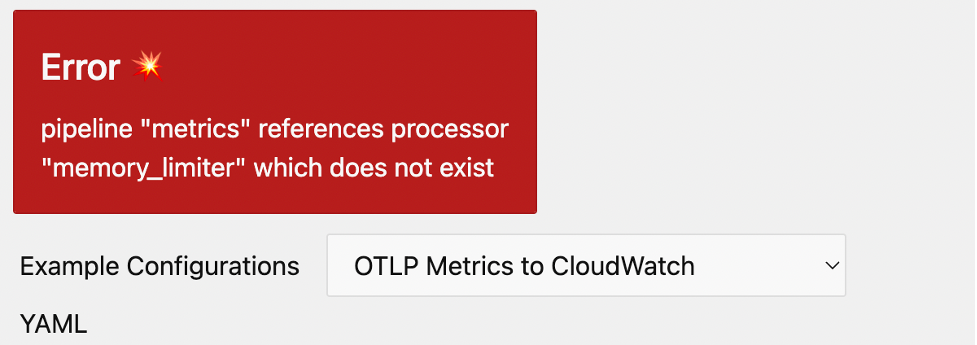
If you use an invalid configuration the error will be displayed. Here is an example of an incorrect configuration. In this configuration we try to build a pipeline using a memory_limiter processor component, but that component is not defined as a processor:
This YAML configuration would be flagged by the validator as in this screenshot, which shows the error message displayed when validating an incorrect YAML configuration:
If we correct the YAML to include the memory_limiter in the config, we will no longer get the error and our pipeline will now be able to build correctly for telemetry export:
The application confirms that the config is now valid:

Command Line
The second method of deployment and operation for the validator is as a command-line utility. Building and running would look like this:
The following commands should be run in your local terminal. Be sure to substitute ‘/path/to/config’ with the full path of the OTel configuration file you are trying to validate.
Output:
The CLI can be installed and used within development environments like AWS Cloud9 or Visual Studio Code to run validations against OTel configs before they are checked into a repository.
Conclusion
In this blog post we described how you can validate OpenTelemetry configuration files using Lightstep’s OpenTelemetry validator. Users of Amazon Distro for OpenTelemetry can take advantage of this as the validator supports all ADOT components. Using this tool, you can have greater operational insight into the validity of your OpenTelemetry configurations. Catching errors before pipeline build time allows for a reliable OTel deployment and less time spent troubleshooting configuration errors. Feedback and contributions to the otel-config-validator are appreciated and welcomed.