AWS Open Source Blog
The Sumo Logic integration with Amazon EKS
Amazon Elastic Kubernetes Service (Amazon EKS) makes it easy to deploy, manage, and scale containerized applications using Kubernetes on AWS.
In this post, we’ll provide an overview on how Sumo Logic’s integration with Amazon EKS works using the open source tools Helm, Fluent Bit, Fluentd, Prometheus, and Falco, and how to use it to:
- Monitor the health of clusters, pod, and control plane component’s health.
- Determine resource bottlenecks, scaling needs, and availability.
- Correlate and investigate errors across containers.
- Respond and remediate the root cause of application failures from infrastructure to application.
Sumo Logic is an AWS Partner Network (APN) Advanced Technology Partner with AWS competencies in Security, Data and Analytics, and DevOps. Sumo Logic helps organizations gain better real-time visibility into their IT infrastructure. Sumo Logic integrates with many cloud as well as on-prem services, making it simple and easy to aggregate data across different services, giving users a full view of their operational, business, and security analytics.
EKS logs and metrics collection setup and app installation
The basic steps to configure Sumo Logic logs and metrics integration are:
- Install and configure the Sumo Logic collection using open source technologies to collect logs and metrics.
- Install the Sumo Logic Kubernetes application to visualize the logs and define alerts.
Install and configure the Sumo Logic collection to collect logs and metrics
Sumo Logic leverages open source technologies Helm, Fluent Bit, Fluentd, Prometheus, and Falco to collect logs and metrics information from EKS clusters.
Figure 1 provides an overview of the collection process:
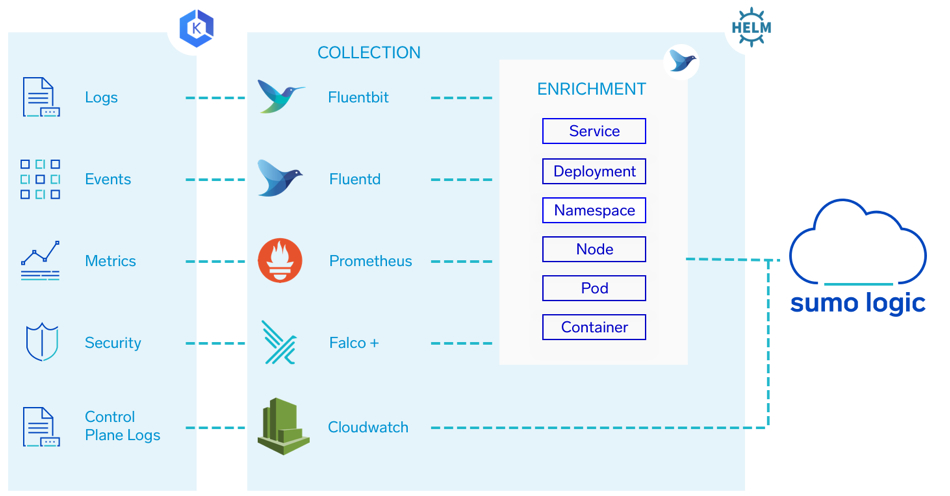
Figure 1: Sumo Logic EKS Integration
- Setup, collection, and enrichment: The entire collection process can be set up with a single Helm chart. Helm is an open source tool that uses a packaging format called charts. A chart is a collection of files that describe a related set of Kubernetes resources. A single chart might be used to deploy something simple, like a memcached pod, or something complex, like a full web app stack with HTTP servers, databases, caches, and so on. Fluent Bit, Fluentd, Prometheus, and Falco are deployed throughout the cluster to collect log, metric, event, and security data. Below is a brief description of each component.
- Fluentd is an open source data collector for the unified logging layer. Fluentd allows you to unify data collection and consumption for better use and understanding of data. Fluentd is written in a combination of C language and Ruby, and requires very few system resources. The vanilla instance runs on 30-40MB of memory and can process 13,000 events/second/core.
- If you have tighter memory requirements (-450kb), try using Fluent Bit, the lightweight forwarder for Fluentd. It includes multiple Fluentd plugins that parse and format the metrics and enrich them with metadata. Data is enriched — tagged — with details about where in the cluster it originated; the service, deployment, namespace, node, pod, container, and their labels. It then forwards logs and metrics to an HTTP source on a hosted collector. Fluent Bit is an open source and multi-platform log processor and forwarder which allows you to collect data/logs from different sources, unify and send them to multiple destinations. It’s fully compatible with Docker and Kubernetes environments. Fluent Bit is deployed on each node. It collects and forwards the container logs to Fluentd Deployment.
- Fluentd deployment forwards events to an HTTP source on a hosted collector.
- Prometheus is an open-source systems monitoring and alerting toolkit. Most Prometheus components are written in Go, making them easy to build and deploy as static binaries. It scrapes the metrics exposed by the node-exporter add-on for Kubernetes and the kube-state-metrics component, and writes metrics to a port on the Fluentd deployment.
- Falco is a behavioral activity monitoring agent that is open source and comes with native support for containers. Falco lets you define highly granular rules to check for activities involving file and network activity, process execution, IPC, and much more, using a flexible syntax. Falco will notify you when these rules are violated. Falco is deployed on each node. It monitors the cluster, its worker nodes, and running containers for suspicious activity and generates security alerts which are collected by Fluent Bit.
- Control plane logs – Amazon EKS control plane logging provides audit and diagnostic logs directly from the Amazon EKS control plane to Amazon CloudWatch logs in your account. These logs are forwarded to Sumo Logic using AWS Lambda. To set up the EKS control plane collection, follow the steps in Sumo Logic’s documentation to Configure CloudWatch log collection.
Install the Sumo Logic Kubernetes application to visualize the logs and define alerts
Once you have configured the collection, the Sumo Logic app for Amazon EKS can be installed and alerts can be configured. For additional details, please see the instructions on how to Install the Amazon EKS – Control Plane App and view the Dashboards.
The Explore and App dashboards
Now that we’ve seen how to set up collection and install the app, let’s look at how to efficiently explore Kubernetes hierarchies and get insights through dashboards.
Explore provides a visual map of the hierarchy of your Kubernetes environment through which you can navigate in an intuitive manner. You can filter the display to focus on deployments, nodes, services, or namespace.

Figure 2: Explore the dashboard
As you can see in the image below, once you select a node, deployment, service, or namespace on the left, you will be able to visualize the health and performance related to that entity on the right. For example, if we choose the Kubernetes Namespace View on the left and select the EKS cluster, we will then be able to select the Kubernetes – Cluster Overview dashboard on the right for a high-level view of the health and performance of the cluster as shown:
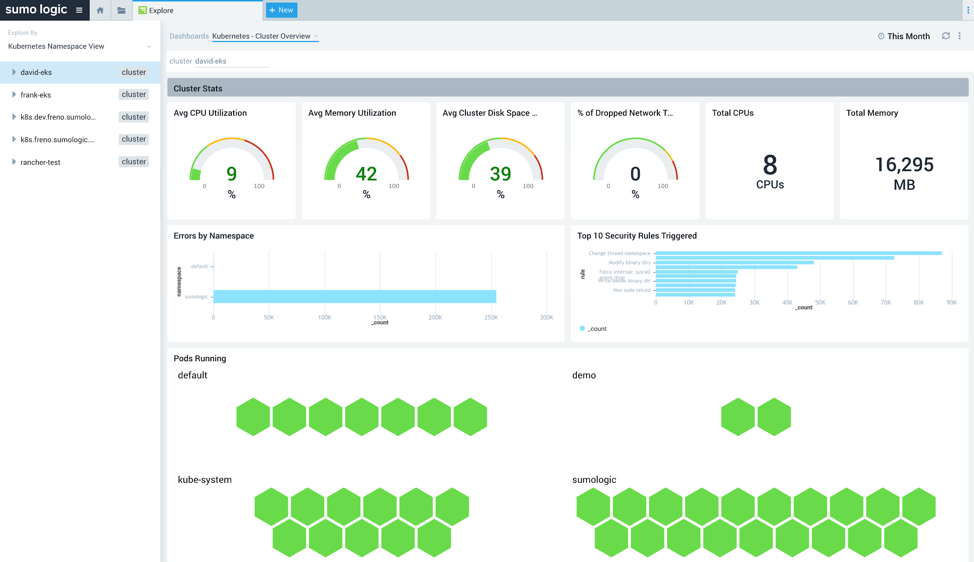
Figure 3: EKS Cluster Overview
At the cluster level there are a number of dashboards available to monitor and troubleshoot EKS control plane components. The EKS API Server Audit Overview dashboard (Figure 4) can be used to get insights on the Kubernetes Audit server such as reasons for request failures, URLs with the most failures, and more.
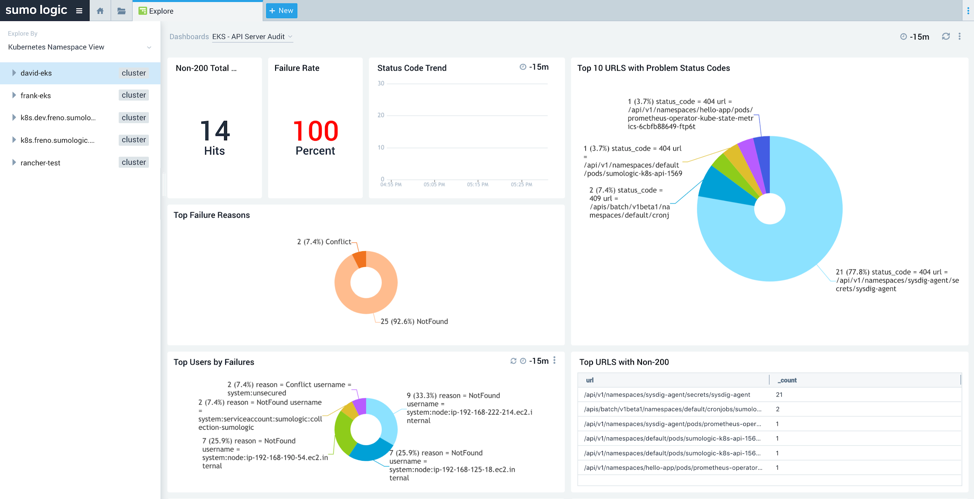
Figure 4: EKS API Server Audit Overview
The EKS controller manager dashboard (Figure 5), also available at the cluster level, provides visibility into the core control loops for Kubernetes. Using this dashboard, you can easily review resource modifications, scaling operations, severity trends, and more.
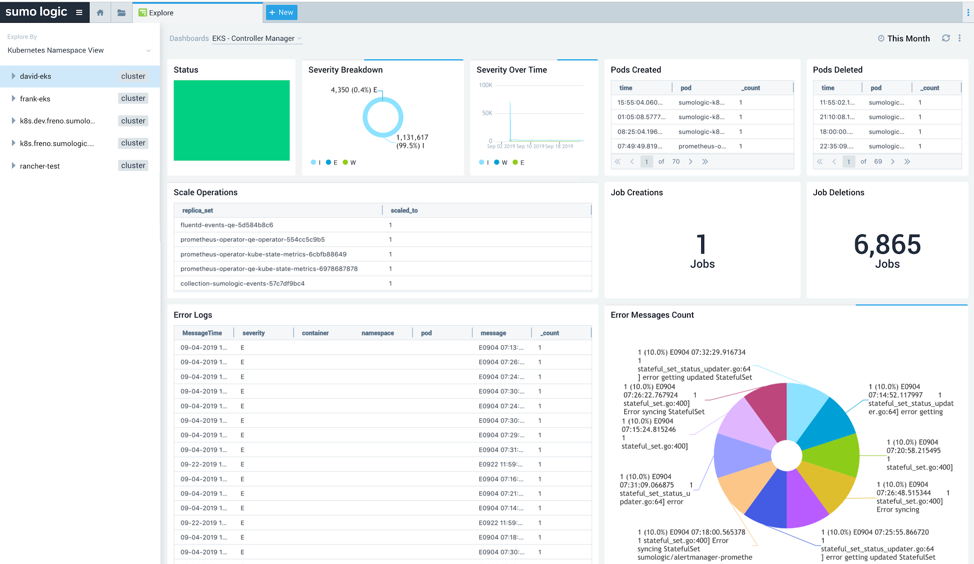
Figure 5: EKS Controller Manager
Troubleshoot with the Explore and App dashboards
Step 1: Analyzing the cluster
The health and resource utilization of all components running on a cluster is shown on the Cluster Overview dashboard. Any spikes in the resource usage, errors, security rules violations, or failed components can be easily identified to determine configuration issues or overall administration issues that need to be addressed.
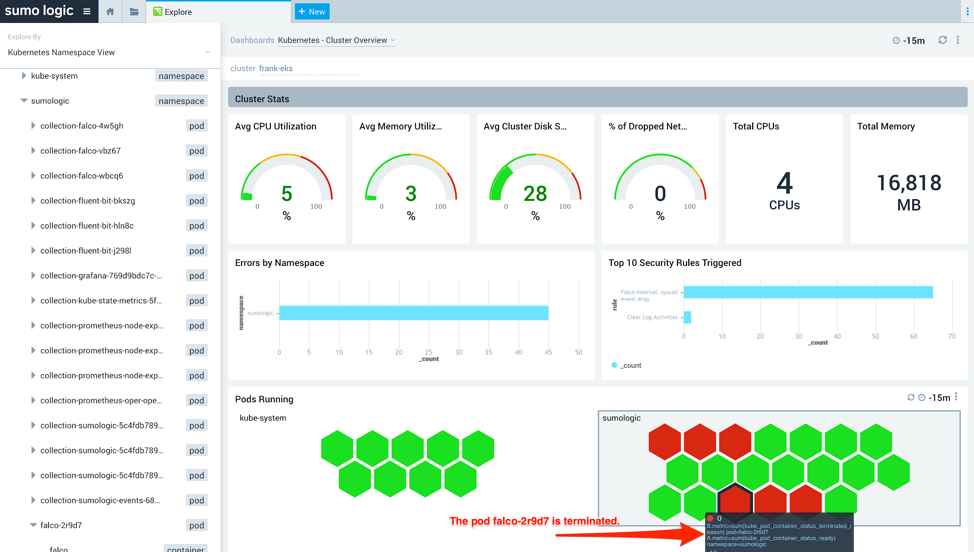
Figure 6: Analyzing an EKS cluster using the Cluster Overview dashboard
As you can see in Figure 6, the pod falco-2r9d7 is not behaving correctly and has been terminated.
Step 2: Exploring a namespace
To get to the root cause of an issue with an EKS cluster, investigate the namespace by selecting kube-system in the navigation panel and switching to the Namespace Overview dashboard. This dashboard provides information on pods running in the deployment, failed pods, errors, CPU and memory usage, file system usage, terminated and waiting pods and containers. Figure 7 highlights the problem with a pod where the pod keeps failing and gets restarted:
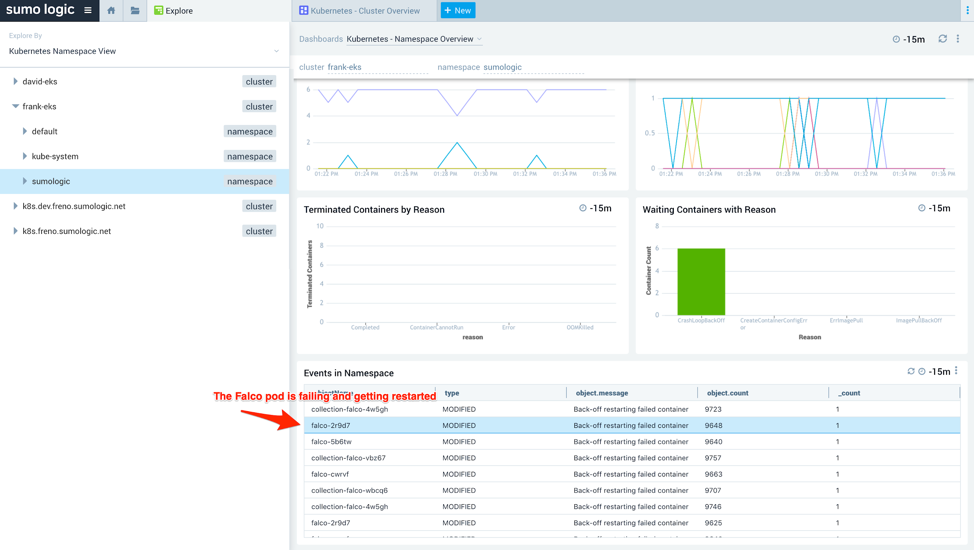
Figure 7: Namespace overview
Step 3: Drilling down into a pod and container
Once a pod with problems has been identified, you can drill down into the pod dashboard for more granular data. You can see in Figure 8 that the falco-2r9d7 pod is in CrashLoopBackOff:
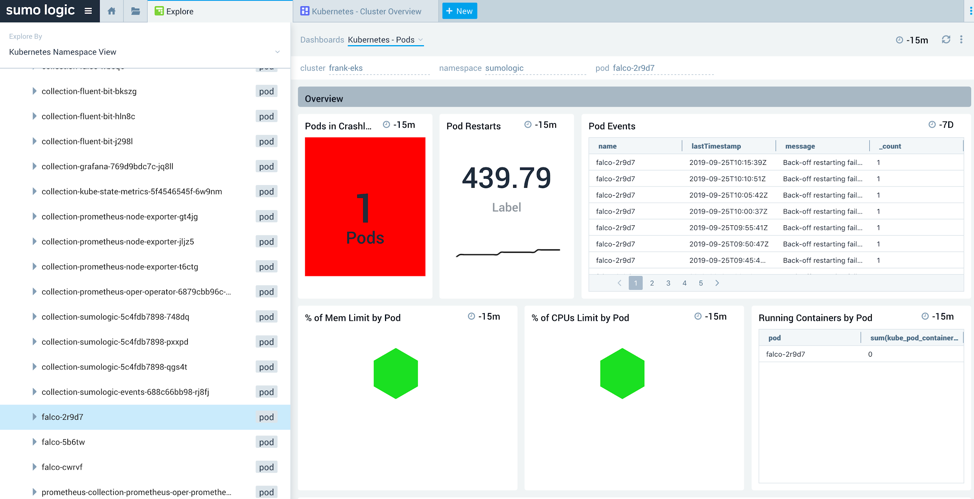
Figure 8 : Pods running on an EKS cluster
You can further drill down to the container level to determine the exact error. In this case, as you can see below, the container is not able to download an image:
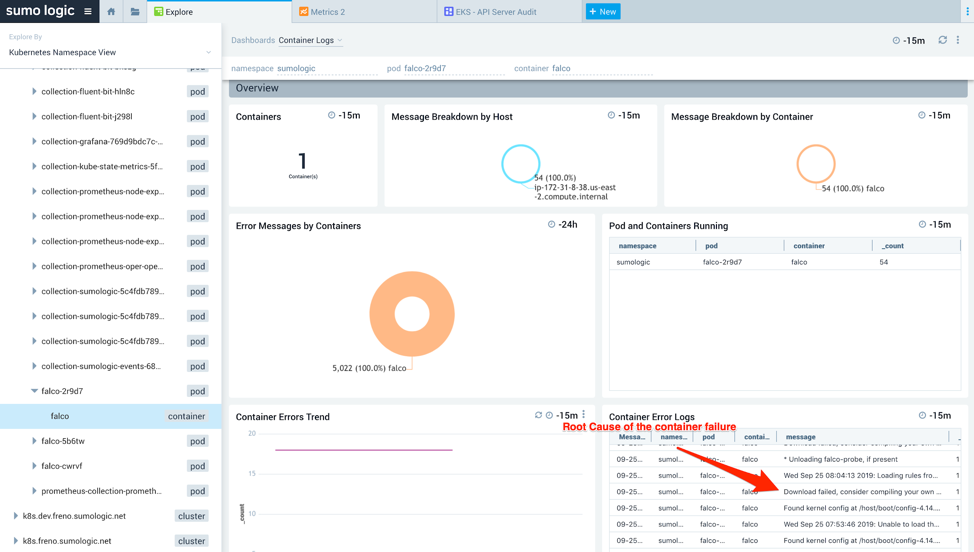
Figure 9: Container logs
Step 4: Drilling down into logs and metric search
Once the pod and the container exhibiting problems are identified, you can use the log overlay feature to correlate metrics performance with the logs responsible for this behavior. By clicking on the vertical band, you can narrow down to a particular interval associated with the metric and see the relevant log messages:
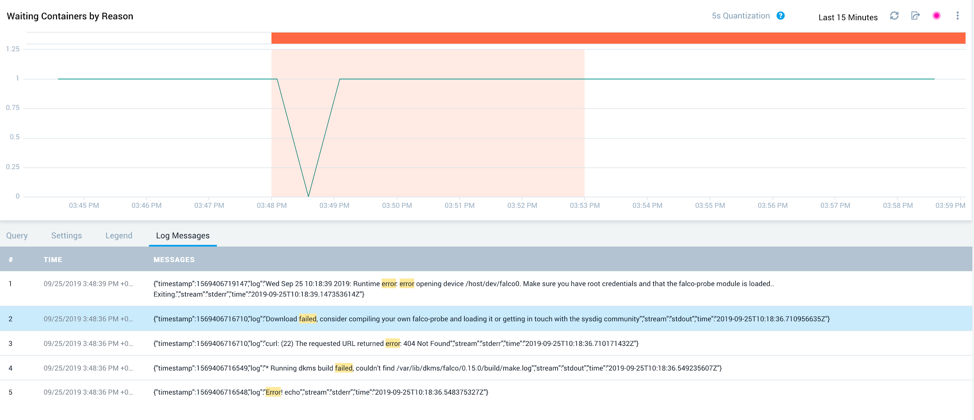
Figure 10: Logs and metrics overlay
The above screenshot shows the logs overlay with the full error details i.e. “Download failed, the requested URL returned error. 404 Not Found.” With this information, you can take corrective action.
Cleanup
To avoid incurring future charges to your AWS accounts, delete the resources created in your AWS account for this project. You can simply delete the EKS cluster and delete the Sumo Logic free trial you created by going to Administration > Account in th. Sumo Logic web page. At the bottom of the page, under the section Delete this Organization from Sumo Logic?, click Delete Org. In the dialog Delete This Organization from Sumo Logic?, enter DELETE to confirm. Click Delete Org.
Summary
In this post, we have shown an overview of how the Sumo Logic integration with Amazon EKS works so you can:
- Collect logs and metrics from Amazon EKS using open source tools Fluentd, Fluent Bit, Helm, Prometheus, and Falco.
- Use the Explorer functionality to review and troubleshoot EKS clusters.
- Use Sumo Logic dashboards and searches to investigate root causes and remediate issues.
Next steps
To get started, check out the Sumo Logic Kubernetes help doc. If you don’t yet have a Sumo Logic account, you can sign up for a free trial.
For more security and devSecOps-focused reads, check out the Sumo Logic blog.

Arun Patyal
Arun Patyal is a senior integration engineer at Sumo Logic with over 12 years of experience in developing and integrating applications. Previously, Arun was a professional services consultant at Saba Software Inc. Arun graduated from I2IT- Pune, India with a master’s degree in Advanced Software Technology. His interests outside of work include trekking, traveling and helping stray dogs
The content and opinions in this post are those of the third-party author and AWS is not responsible for the content or accuracy of this post.