AWS for SAP
SAP HANA monitoring: A serverless approach using Amazon CloudWatch
Introduction
In a previous blog post, we demonstrated, how to monitor SAP NetWeaver ABAP-based environments through Amazon CloudWatch. It provides an easy way to monitor SAP workloads at the application level and allows you to tailor monitoring dashboards as well as alarms to your own requirements. In this blog post, we will complement this solution by providing the same serverless approach based on Amazon CloudWatch and AWS Lambda for SAP HANA.
This approach enables customers to effectively monitor SAP HANA environments at a low cost without the need to deploy or manage any servers or agents. The solution can be deployed seamlessly and in minutes with the AWS Serverless Application Repository or AWS CloudFormation. It uses the custom metric capability and new embedded log format feature inside CloudWatch. This allows you to easily publish your own metrics, such as SAP HANA database-level performance data, and create thresholds and alarms in CloudWatch.
Architecture
The following architecture diagram shows the monitoring setup that gets deployed with AWS CloudFormation.
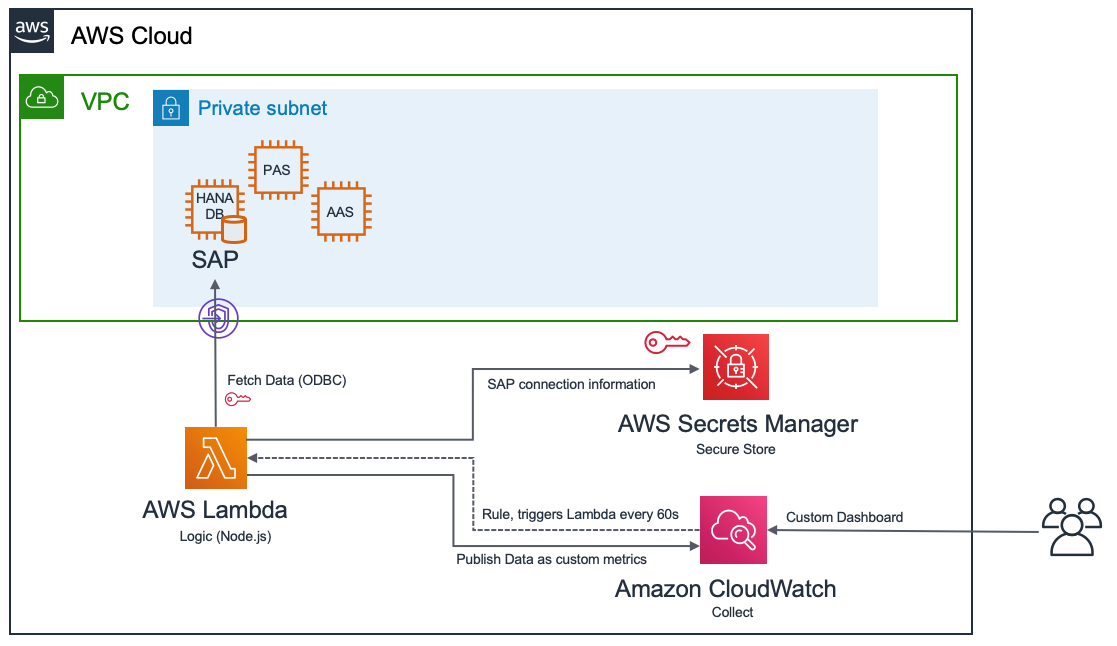
The generated Amazon CloudWatch rule triggers a NodeJS-based Lambda function every minute and executes multiple SQL statements to the SAP HANA database through the official SAP HANA Client Library. The connectivity is established by adding the Lambda function to your existing Amazon Virtual Private Cloud (VPC).
The SAP HANA credentials and connection information are stored securely inside AWS Secrets Manager and read on-demand to establish connectivity. The Lambda function extracts the SAP HANA database level metrics, adds the respective custom namespace, and pushes it to CloudWatch. Users can then create their own custom dashboards inside CloudWatch.
Setting it up
Prerequisites
- SAP HANA >= 1.0 SPS 12
- SAP HANA Monitoring user and password – see “Step 1”
- Amazon VPC security group(s) allowing inbound/outbound traffic on port 3<instanceID>13 or 3<instanceID>15, so that the Lambda function can connect via the private subnet to the SAP HANA database to be monitored.
- For Production systems, make sure to enable CloudWatch detailed monitoring according to SAP note 1656250.
Step 1: Create an SAP user for monitoring (HANA Studio)
Please refer to the step-by-step guide and maintained list of required authorizations.
Step 2: Deploy the solution (AWS console)
For most AWS Regions, you can easily deploy the solution with the AWS Serverless Application Repository (Example AWS Region Frankfurt) by searching for sap-monitor-hana. Make sure to tick Show apps that create custom IAM roles.
If this is not available in your Region, please deploy it manually by running the following AWS CloudFormation template.

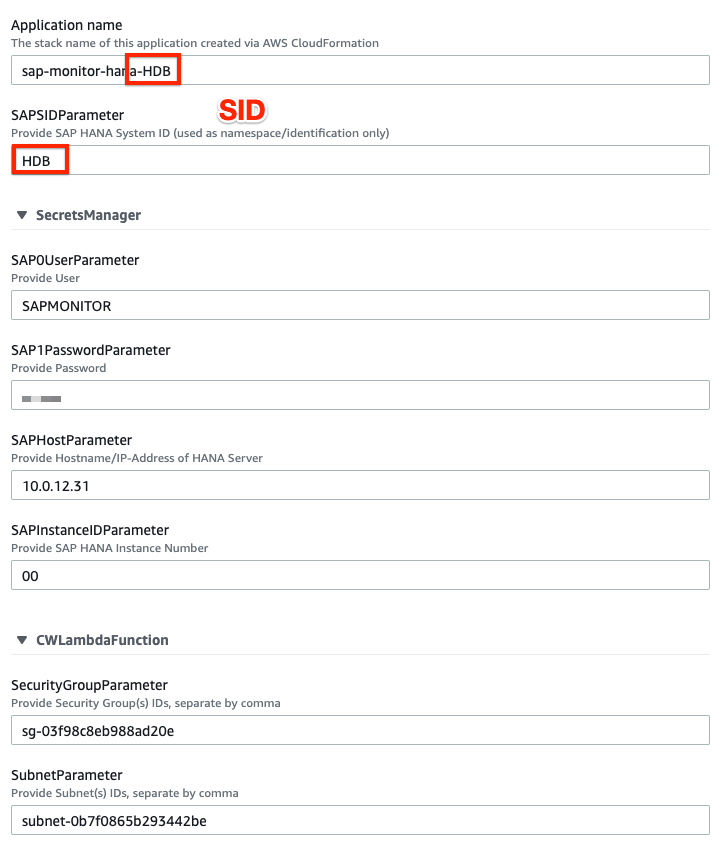
Carefully fill out all the necessary details, such as the SAP HANA ID, host/IP-Address, Instance ID, DB user and password, and the security group and subnet of your target VPC. Compare your inputs also with the respective Amazon Elastic Compute Cloud (Amazon EC2) settings for your SAP HANA server.
Note: You have to deploy a single instance of this application per SAP HANA database if multiple systems will be monitored.
Refer to the troubleshooting guide if you have issues with this step.
Step 4: Test the function (console)
Open the Lambda console, select sap-monitor-hana-<SID> and choose Test. In the Configure test event page, choose Create new test event and enter {“refresh”:true}:

Hit Test. The expected output is shown below:

Refer to the troubleshooting guide if you have issues with this step.
Step 5: Enable the scheduler (console)
Open the CloudWatch console. In the navigation pane, choose Rules. Select the rule sap-monitor-hana-<SID> and choose Enable as Actions, so that it runs periodically:

Step 6: Create a dashboard (console)
Open the CloudWatch console. In the navigation pane, choose Metrics. Under Custom Namespaces, you should now find your custom metrics, arranged by SID. You can select any metric and preview its output.

Navigate to Dashboards and press Create dashboard to set up a new custom dashboard. Choose Add widget and select the respective custom metrics from the list. Make sure to match the granularity and period. Don’t forget to hit Save.
The resulting dashboard can look as follows:


Note: A dashboard template (XML format) can be found here. Make sure to adjust HANA ID (“HDB”) as well as AWS region (“eu-central-1”) before importing (CloudWatch Dashboard → Actions → View/edit source).
Step 7: Create alarms
You can now create alarms and receive notifications once the desired thresholds are exceeded.
Start with a simple alarm to monitor the sap-monitor itself, by selecting the Lambda metric Errors for function sap-monitor-hana-<SID> as follows:

If you set up a corresponding Amazon Simple Notification Service (Amazon SNS) topic, you can choose to be notified via email when the monitoring is failing. Proceed with other alarms for metrics, that you like to closely pay attention to.
Performance considerations
With a total query runtime of less than 2 seconds and a polling frequency of 1 minute, the overhead of this solution can be considered negligible. This can also be closely monitored through the lambda runtime metric as well as lambda function logs (SQL statement level).
Cost considerations
As an example, for a single SAP HANA system, the estimated cost is 15 USD per month per SID without considering any free tiers. Costs are mainly driven by the number of custom metrics. To limit the stored log data and reduce the cost in the long run, make sure to also reduce the retention period for /aws/lambda/sap-monitor-hana-<SID> to one week.
Captured metrics
A full list of currently captured metrics and their importance can be found in the GitHub repository. If you also like to monitor other OS-related metrics such as free hard disk space, you can also deploy the CloudWatch Agent on top.
Contribute
The solution is provided as is, but we very much encourage you to use our GitHub repository to report any bugs, collect further related ideas or even contribute back as a developer.
Conclusion
This blog post shows you a way to monitor SAP HANA databases with Amazon CloudWatch. It also provides an out-of-the box solution with a baseline of SAP HANA metrics that can be deployed through the AWS Serverless Application Repository and AWS CloudFormation. It has been shown that the database credentials are stored securely inside AWS Secrets Manager. Access to the SAP HANA system is well-defined and can be easily disabled on demand. The source code is publicly available and can also be extended.
Now you have an easy way of monitoring SAP HANA and can tailor the monitoring dashboards as well as alarms to your own requirements. I hope that you found this blog post useful. Please don’t hesitate to contact us with your comments or questions.