AWS for SAP
SAP monitoring: A serverless approach using Amazon CloudWatch
With more than 5000 active AWS customers running SAP on AWS, we see customers run SAP workloads on a diverse set of SAP releases and versions. Most customers are working with SAP NetWeaver ABAP-based environments composed of one or more application servers and a database. SAP customers often use third-party commercial solutions, such as SAP Solution Manager Focus Run or Avantra, to monitor SAP applications holistically and at scale.
In this blog post, we share an alternative, serverless approach based on Amazon CloudWatch and AWS Lambda. This approach enables customers to effectively monitor SAP ABAP-based environments at a low cost without the need to deploy or manage any servers or agents. The solution can be deployed seamlessly and in minutes with the AWS Serverless Application Repository or AWS CloudFormation. It uses the custom metric capability and new embedded log format feature inside CloudWatch. This allows you to easily publish your own metrics, such as SAP application-level performance data, and create thresholds and alarms in CloudWatch.
Architecture
The following architecture diagram shows the monitoring setup that gets deployed with AWS CloudFormation. The Lambda layer “sapjco” for the SAP Java Connector (JCo) needs to be created manually beforehand.

The generated Amazon CloudWatch rule triggers a Java-based Lambda function every minute and performs multiple Remote Function Calls (RFC) to the SAP system through the official SAP JCo Library, served as Lambda layer. The connectivity is created by adding the Lambda to your existing Amazon Virtual Private Cloud (VPC) using also the latest improvements on networking for AWS Lambda.
The SAP RFC credentials and connection information are stored securely inside AWS Secrets Manager and read on-demand to establish connectivity. The Lambda function extracts the SAP application level metrics, adds the respective custom namespace, and pushes it to CloudWatch. Users can then create their own custom dashboards inside CloudWatch.
Setting it up
Prerequisites
- SAP NetWeaver ABAP 740 or higher (ECC, S4, BW, …)
- SAP Component ST-PI Release 740 SP 08 or higher.
- SAP statistical records enabled (transaction codes stad / st03). If not active by default, please check SAP note 2369736.
- SAP RFC user and password – see “Step 1.”
- SAP S-User to download SAP Java Connector – see “Step 2.”
- Amazon VPC security group(s) allowing inbound/outbound traffic on port 33<instanceID>, so that the Lambda function can connect via the private subnet to the SAP system to be monitored – see also previous section “Architecture.”
- For Production systems, make sure to enable CloudWatch detailed monitoring according to SAP note 1656250.
Step 1: Create an SAP user for monitoring (SAPGUI)
Please refer to the step-by-step guide and maintained list of required authorizations.
Step 2: Create a Lambda layer for SAP JCo (console)
This activity only has to be done once, regardless of any subsequent deployments.
Please refer to the step-by-step guide.
Step 3: Deploy the solution (console)
For most AWS Regions, you can easily deploy the solution with the AWS Serverless Application Repository by searching for sap-monitor. Make sure to tick Show apps that create custom IAM roles.
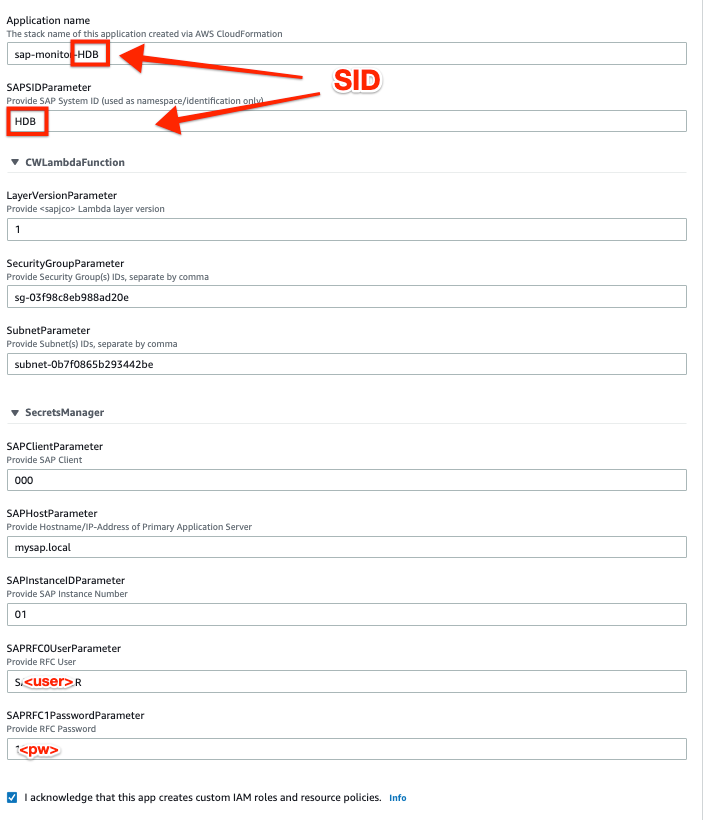
If this is not available in your Region, please deploy it manually by running the following AWS CloudFormation template.

Carefully fill out all the necessary details, such as the SAP System ID, client, host/IP-Address, instanceID, RFC user and password, and the security group and subnet of your target VPC. Compare your inputs also with the respective Amazon Elastic Compute Cloud (Amazon EC2) settings for your SAP primary application server.
Note: You have to deploy a single instance of this application per SAP System ID if multiple systems will be monitored.
Refer to the troubleshooting guide if you have issues with this step.
If you want to start /SDF/SMON yourself, instead of automatically through the monitor, check the documentation for manual scheduling.
Step 4: Test the function (console)
Open the Lambda console, select sap-monitor-<SID> and choose Test. In the Configure test event page, choose Create new test event and enter {“refresh”:true}:

Hit Test. The expected output is shown below:

Refer to the troubleshooting guide if you have issues with this step.
Step 5: Enable the scheduler (console)
Open the CloudWatch console. In the navigation pane, choose Rules. Select the rule sap-monitor-<SID> and choose Enable as Actions, so that it runs periodically:

Step 6: Create a dashboard (console)
Open the CloudWatch console. In the navigation pane, choose Metrics. Under Custom Namespaces, you should now find your custom metrics, arranged by SID. You can select any metric and preview its output.

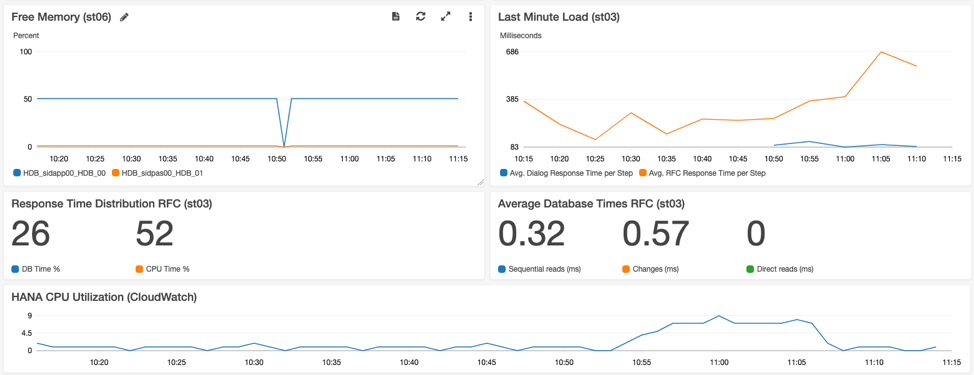
Navigate to Dashboards and press Create dashboard to set up a new custom dashboard. Choose Add widget and select the respective custom metrics from the list. Make sure to match the granularity and period. Don’t forget to hit Save.
The resulting dashboards can look as follows.

CloudWatch also allows you to embed graphs into your webpage.
Step 7: Create alarms
You can now create alarms and receive notifications once the desired thresholds are exceeded.
Start with a simple alarm to monitor the sap-monitor itself, by selecting the Lambda metric Errors for function sap-monitor-<SID> as follows.

If you set up a corresponding Amazon Simple Notification Service (Amazon SNS) topic, you can choose to be notified via email when the monitoring is failing. Proceed with other alarms for metrics, that you like to closely pay attention to.
Performance considerations
We are currently using two techniques to query the SAP system regularly and collect insights.
- One minute interval for /SDF/SMON data with a 30s granularity (scheduled daily on demand):
According to SAP, CPU and memory overhead on the SAP system required by /SDF/SMON is negligible and can be safely run in production. - Five minute interval for st03 “last-minute load”:
SAP statistical records (stad) and related aggregation (st03) are usually enabled by default (if not check SAP note 2369736). They are the foundation of any SAP monitoring, especially for SAP GoingLive Check, SAP EarlyWatch Alert and SAP Solution Manager.
Cost considerations
As an example, for a single SAP system with two application servers , the estimated cost is 16 USD per month per SID without considering any free tiers.
To limit the stored log data and reduce the cost in the long run, make sure to also reduce the retention period for /aws/lambda/sap-monitor-<SID> to one week.
Captured metrics
A full list of currently captured metrics and their importance can be found in the GitHub repository.
If you also like to monitor other OS-related metrics such as free hard disk space, you can also deploy the CloudWatch Agent on top.
Contribute
Although we provide this solution as is and without a warranty of any kind, we encourage you to use our GitHub repository to report bugs, collect ideas, and contribute back.
Conclusion
This blog post shows you a way to monitor SAP ABAP-based systems with Amazon CloudWatch. It also provides an out-of-the box solution with a baseline of SAP application metrics that can be deployed through the AWS Serverless Application Repository and AWS CloudFormation. It has been shown that the SAP credentials are stored securely inside AWS Secrets Manager. Access to the SAP system is well-defined and can be easily disabled on demand. The source code is publicly available and can also be extended.
Now you have an easy way of monitoring of SAP systems and can tailor the monitoring dashboards as well as alarms to your own requirements.
I hope that you found this blog post useful. Please don’t hesitate to contact us with your comments or questions.