AWS News Blog
S3 Storage Management Update – Analytics, Object Tagging, Inventory, and Metrics
Today I would like to tell you about four S3 features that will give you detailed insights into your storage and your access patterns. You can see what and how much you are storing, how it is being used, and you can make informed decisions about the use of S3 storage classes as a result. These features will be of value to everyone who uses S3, whether they have tens, thousands, millions, or billions of objects in their buckets. Here’s an overview:
S3 Analytics – You can analyze the storage and retrieval patterns for your objects and use the results to choose the most appropriate storage class. You can inspect the results of the analysis from within the S3 Console, or you can load them into your favorite BI tool and dive deep. Either way, you now have the means to gain a deep understanding of your storage patterns and to see how they relate to usage and growth.
S3 Object Tagging – You can associate multiple key-value pairs (tags) with each of your S3 objects, with ability to change them at any time. The tags can be used to manage and control access, set up S3 Lifecycle policies, customize the S3 Analytics, and filter the CloudWatch metrics. You can think of the bucket as a data lake, and use tags to create a taxonomy of the objects within the lake. This is more flexible than using the bucket and a prefix, and allows you to make semantic-style changes without renaming, moving, or copying objects.
S3 Inventory – You can speed up your business workflows and your big data jobs using S3 Inventory. This feature provides you with a CSV-formatted flat-file representation of the contents of all or part (as identified by a prefix) of a bucket, on a daily or weekly basis.
S3 CloudWatch Metrics – You can improve the performance of your S3-powered applications by monitoring and alarming on 13 new Amazon CloudWatch metrics.
Let’s dive in…
S3 Analytics
As an S3 user, you have your choice of three storage classes (Standard, Standard – Infrequent Access, and Glacier) and the ability to use S3’s Object Lifecycle Management feature to indicate when objects should be either expired or transitioned to Standard – Infrequent Access or Glacier.
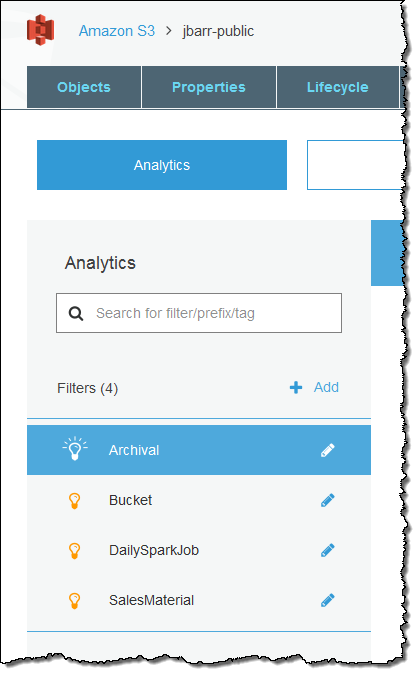
The S3 Analytics feature gives you the information that you need to have in order to choose between Standard and Standard – Infrequent Access for your objects. Because many customers store several different types or categories of information in a single bucket for ease of processing, you have the ability to run the analytics on subsets (defined by a common prefix or tag value) of the objects in a bucket. Each subset is defined by a filter; each bucket can have up to 1000 filters. Here are the filters on my jbarr-public bucket:
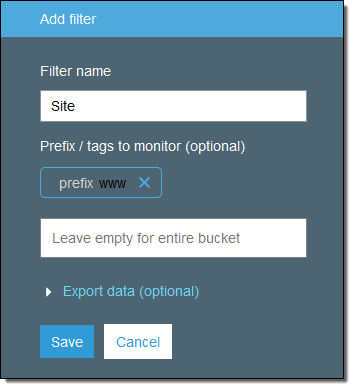
Here’s how I define a simple filter that analyzes objects that are prefixed with www:
I could choose to filter by tag name and value instead. Here’s how I would analyze objects that have a tag named type with the value page:

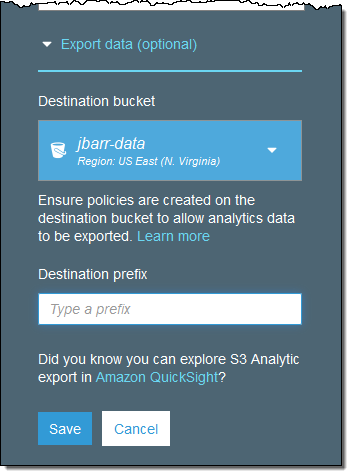
Each filter can have at most one prefix, along with any desired number of tags. I can also choose to have the analytics exported to a file each day:
Once one or more filters are in place, the analytics are run on a daily basis and I can view them by simply clicking on the filter. For example, here’s what I see when I click on my Archival filter:
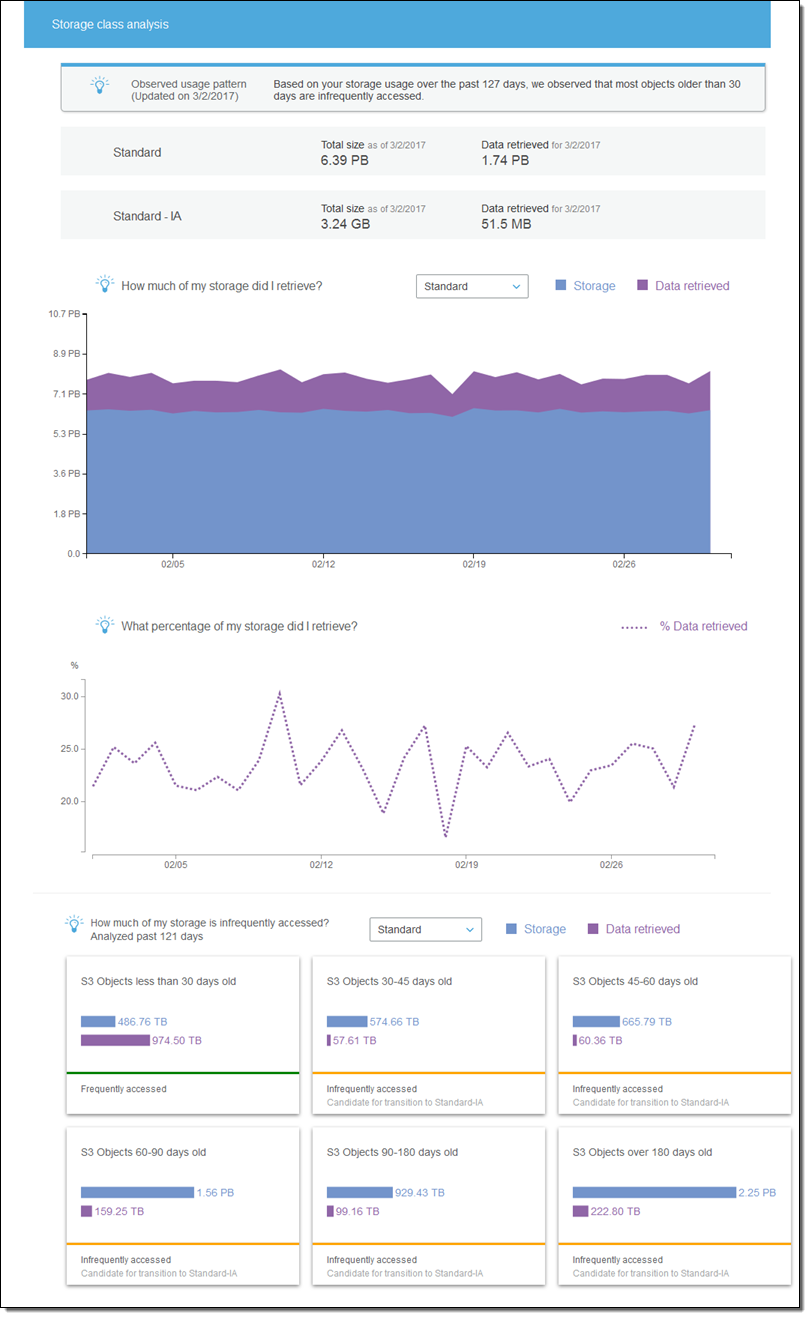
There’s a lot of good information in this analysis! I can see that:
- Looking back 127 days, most of my objects that are older than 30 days are accessed infrequently. I can save money by creating a Lifecycle rule that will transition these objects to Standard – Infrequent Access storage.
- At this point, the majority (6.39 PB) of my storage is in Standard storage; just a tiny fraction (3.24 GB) is in Standard – Infrequent Access storage (I don’t actually have that much data in my bucket! The S3 team was kind enough to load up my account with some test metrics that were, shall we say, very generous).
- Over the 127 day observation period, between 16% and 30% of the Standard storage was retrieved on a per-day basis.
- Objects between 30-45 days old, 45-60 days old, 60-90 days old, 90-180 days old, and over 180 days old are all infrequently accessed and good candidates for Standard – Infrequent Access storage.
You can set up storage class analysis from the Console, the CLI, or through the S3 APIs.
To learn more, read S3 Storage Class Analysis.
S3 Object Tagging
Tags supplement the existing location-based S3 object management model (buckets and prefixes) with the ability to manage storage based on what the object represents. For example, you can tag objects with the name of a department and then construct IAM policies that grant access based on the tag. This gives you a lot of flexibility , including the ability to effect changes by simply altering tags.
You can create, update, or delete them during any part of the object’s life cycle. Tags can be referenced in IAM policies, S3 Lifecycle policies, and in the Storage Analytics filters that I just showed you. Each object can have up to ten tags and each version of an object has a distinct set of tags. You can use tags to manage the expiration of objects via a lifecycle policy and you can set up CloudWatch metrics that reflect the activity around a particular tag.
The Properties page for each object displays the current set of tags and allows me to edit them:
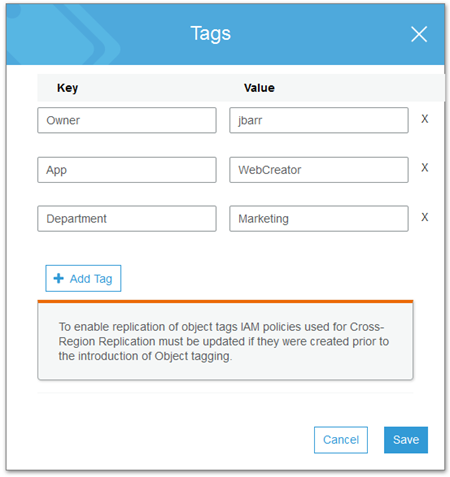
You can also set up and access tags from the CLI or through the S3 APIs. When you use either of these two methods, you must always work in terms of the full tag set. For example, if an object has four tags and you want to add a fifth one, you must read the current set, add the new one, and then update the entire set.
Tags can be replicated across regions via Cross-Region Replication, but your IAM policy on the source side must enable the s3:GetObjectVersionTagging and s3:ReplicateTags actions.
Tags cost $0.01 per 10,000 tags per month. Requests that add or update tags (PUT and GET, respectively) are charged at the usual rates.
To learn more, read about S3 Object Tagging.
S3 Inventory
S3’s LIST operation is synchronous, and returns up to 1000 objects at a time, along with a key that can be used to initiate a second LIST that picks up where the first one leaves off. While this works well for small to medium-sized buckets and single-threaded programs, it can be challenging to use in conjunction with huge buckets or multiple threads.
The S3 team told me that many of our customers store tens or hundreds of millions of objects in a single bucket, and that buckets with a billion or more objects are not unusual. These buckets are often processed daily or weekly as part of a larger workflow and can benefit from a more direct way to gain access to the list of objects in a bucket.
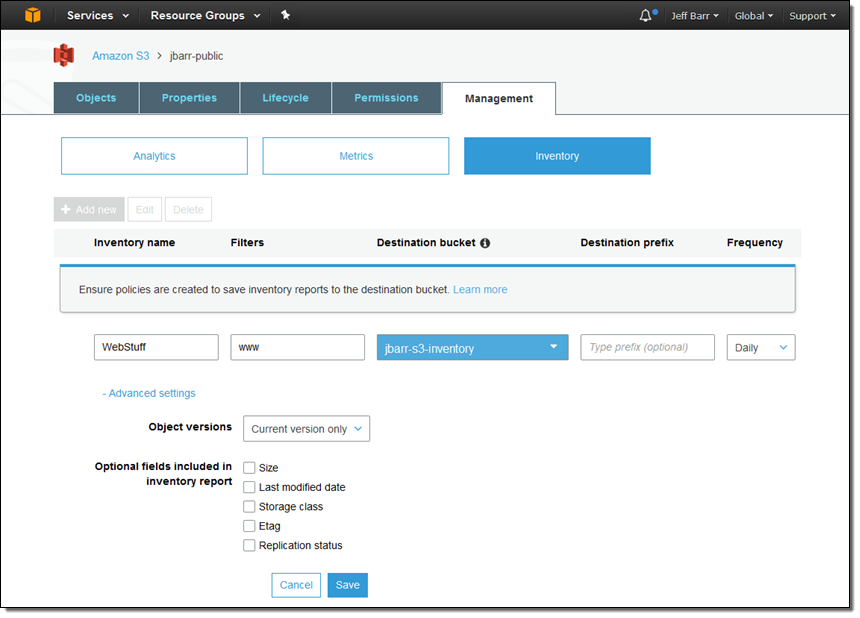
With S3 Inventory, you can now arrange to receive daily or weekly inventory reports for any of your buckets. You can use a prefix to filter the report and you can choose to include optional fields such as size, storage class, and replication status. Reports can be sent to an S3 bucket in your account or (with proper permission settings) in another account.
Here’s how I request a daily inventory report called WebStuff, for all objects that start with www:
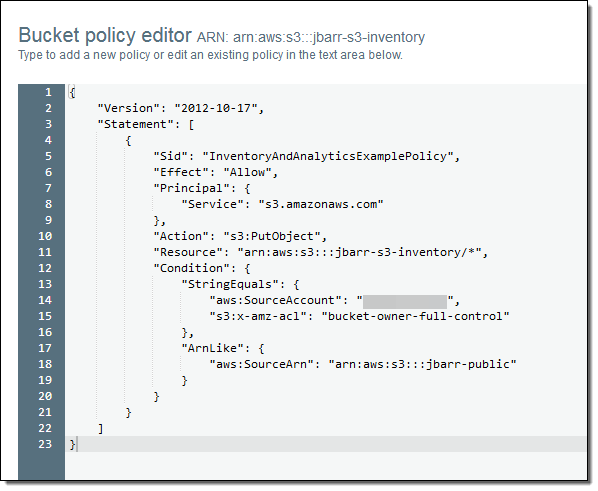
I also need to give S3 permission to write to the destination bucket (jbarr-s3-inventory). Here’s the policy that I used (see Granting Permission for Amazon S3 Inventory and Amazon S3 Analytics to learn more):
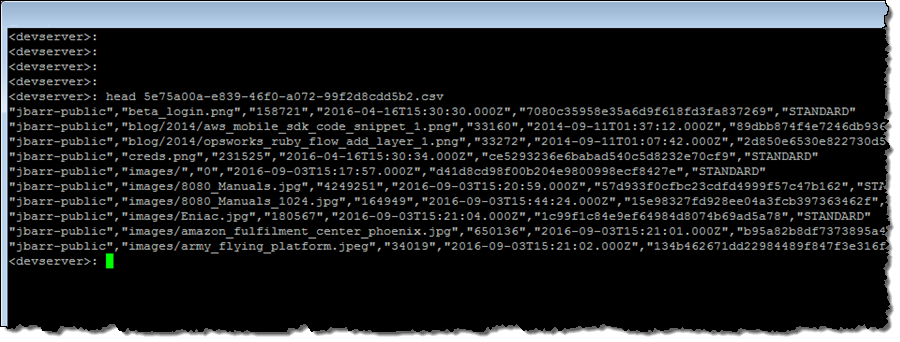
The inventory mechanism creates three files: a manifest, a checksum for the manifest, and a data file. The manifest contains the location of the data file along with a checksum for it:
Here’s what the data file looks like after it has been unzipped:
If you are using the inventory reports to power your daily or weekly processing workflow, don’t forget about S3 Notifications! The checksum file is written after the other two, so you can safely use it to get things moving. Also, don’t forget to use a lifecycle policy to manage your collection of inventory files since they will accumulate over time.
As an added bonus, using daily or weekly reports can save you up to 50%, when compared to multiple LIST operations. To learn more about this feature, read about S3 Storage Inventory.
S3 CloudWatch Metrics
S3 can now publish storage, request, and data transfer metrics to CloudWatch. The storage metrics are reported daily and are available at no extra cost. The request and data transfer metrics are available at one minute intervals (after some processing latency) and are billed at the standard CloudWatch rate. As is the case for the S3 Analytics, the CloudWatch metrics can be collected and reported for an entire bucket or for a subset selected via prefix or tags.
Here is the full set of metrics:
| Storage | Requests | Data Transfer |
|
|
|
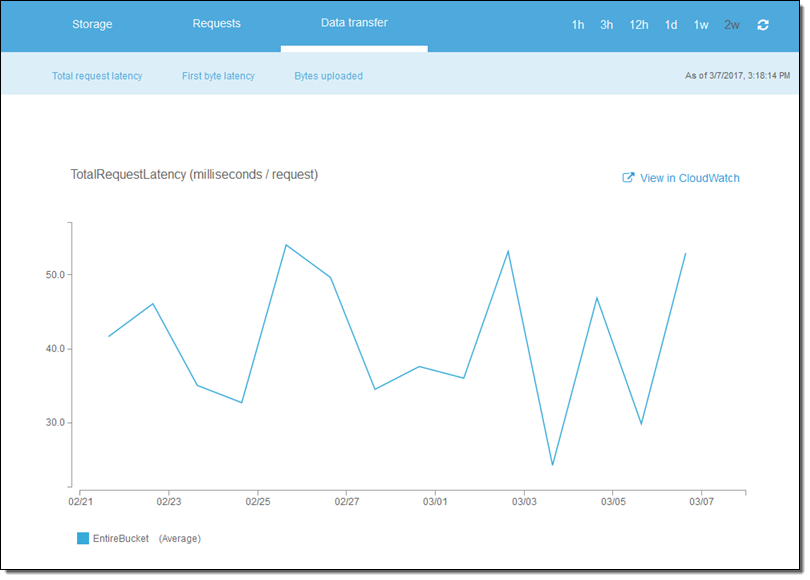
The metrics are available within the S3 and CloudWatch consoles. Here’s what the Total Request Latency looks like in the S3 Console for my bucket:
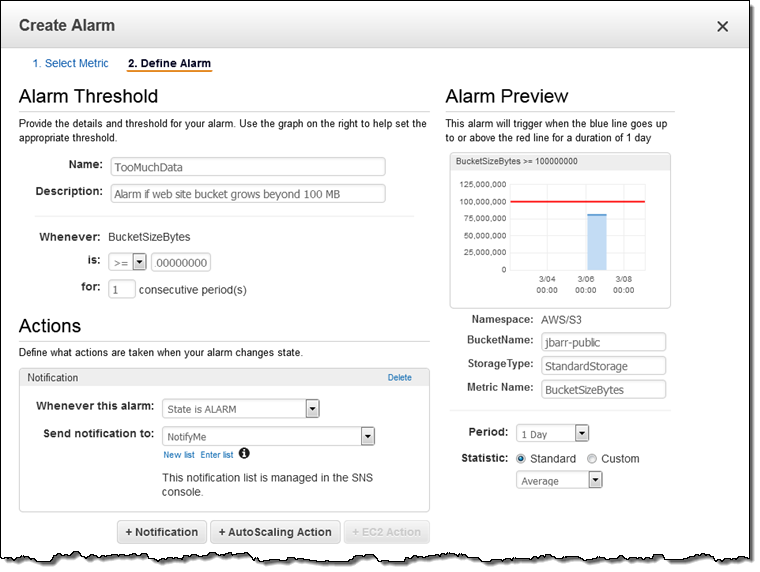
I can also click on View in CloudWatch and set CloudWatch alarms for any desired metric. Perhaps I want to be notified if my bucket grows beyond 100 MB:
To learn more, read How Do I Configure Request Metrics for an S3 Bucket?
Available Now
You have had access to these features since late last year!. They are accessible through the updated S3 Console, which also includes many other new features (watch Introduction to the New Amazon S3 Console to learn more).
— Jeff;