- AWS Solutions Library
- Guidance for Equipment Analytics on AWS
Guidance for Equipment Analytics on AWS
Overview
How it works
Overview
The architecture diagrams for this Guidance are comprised of a suite of three modules: A) Data ingestion, B) Data streaming, processing & machine learning, and C) Data visualization and notifications. This diagram provides a conceptual overview of each module and its interdependencies.
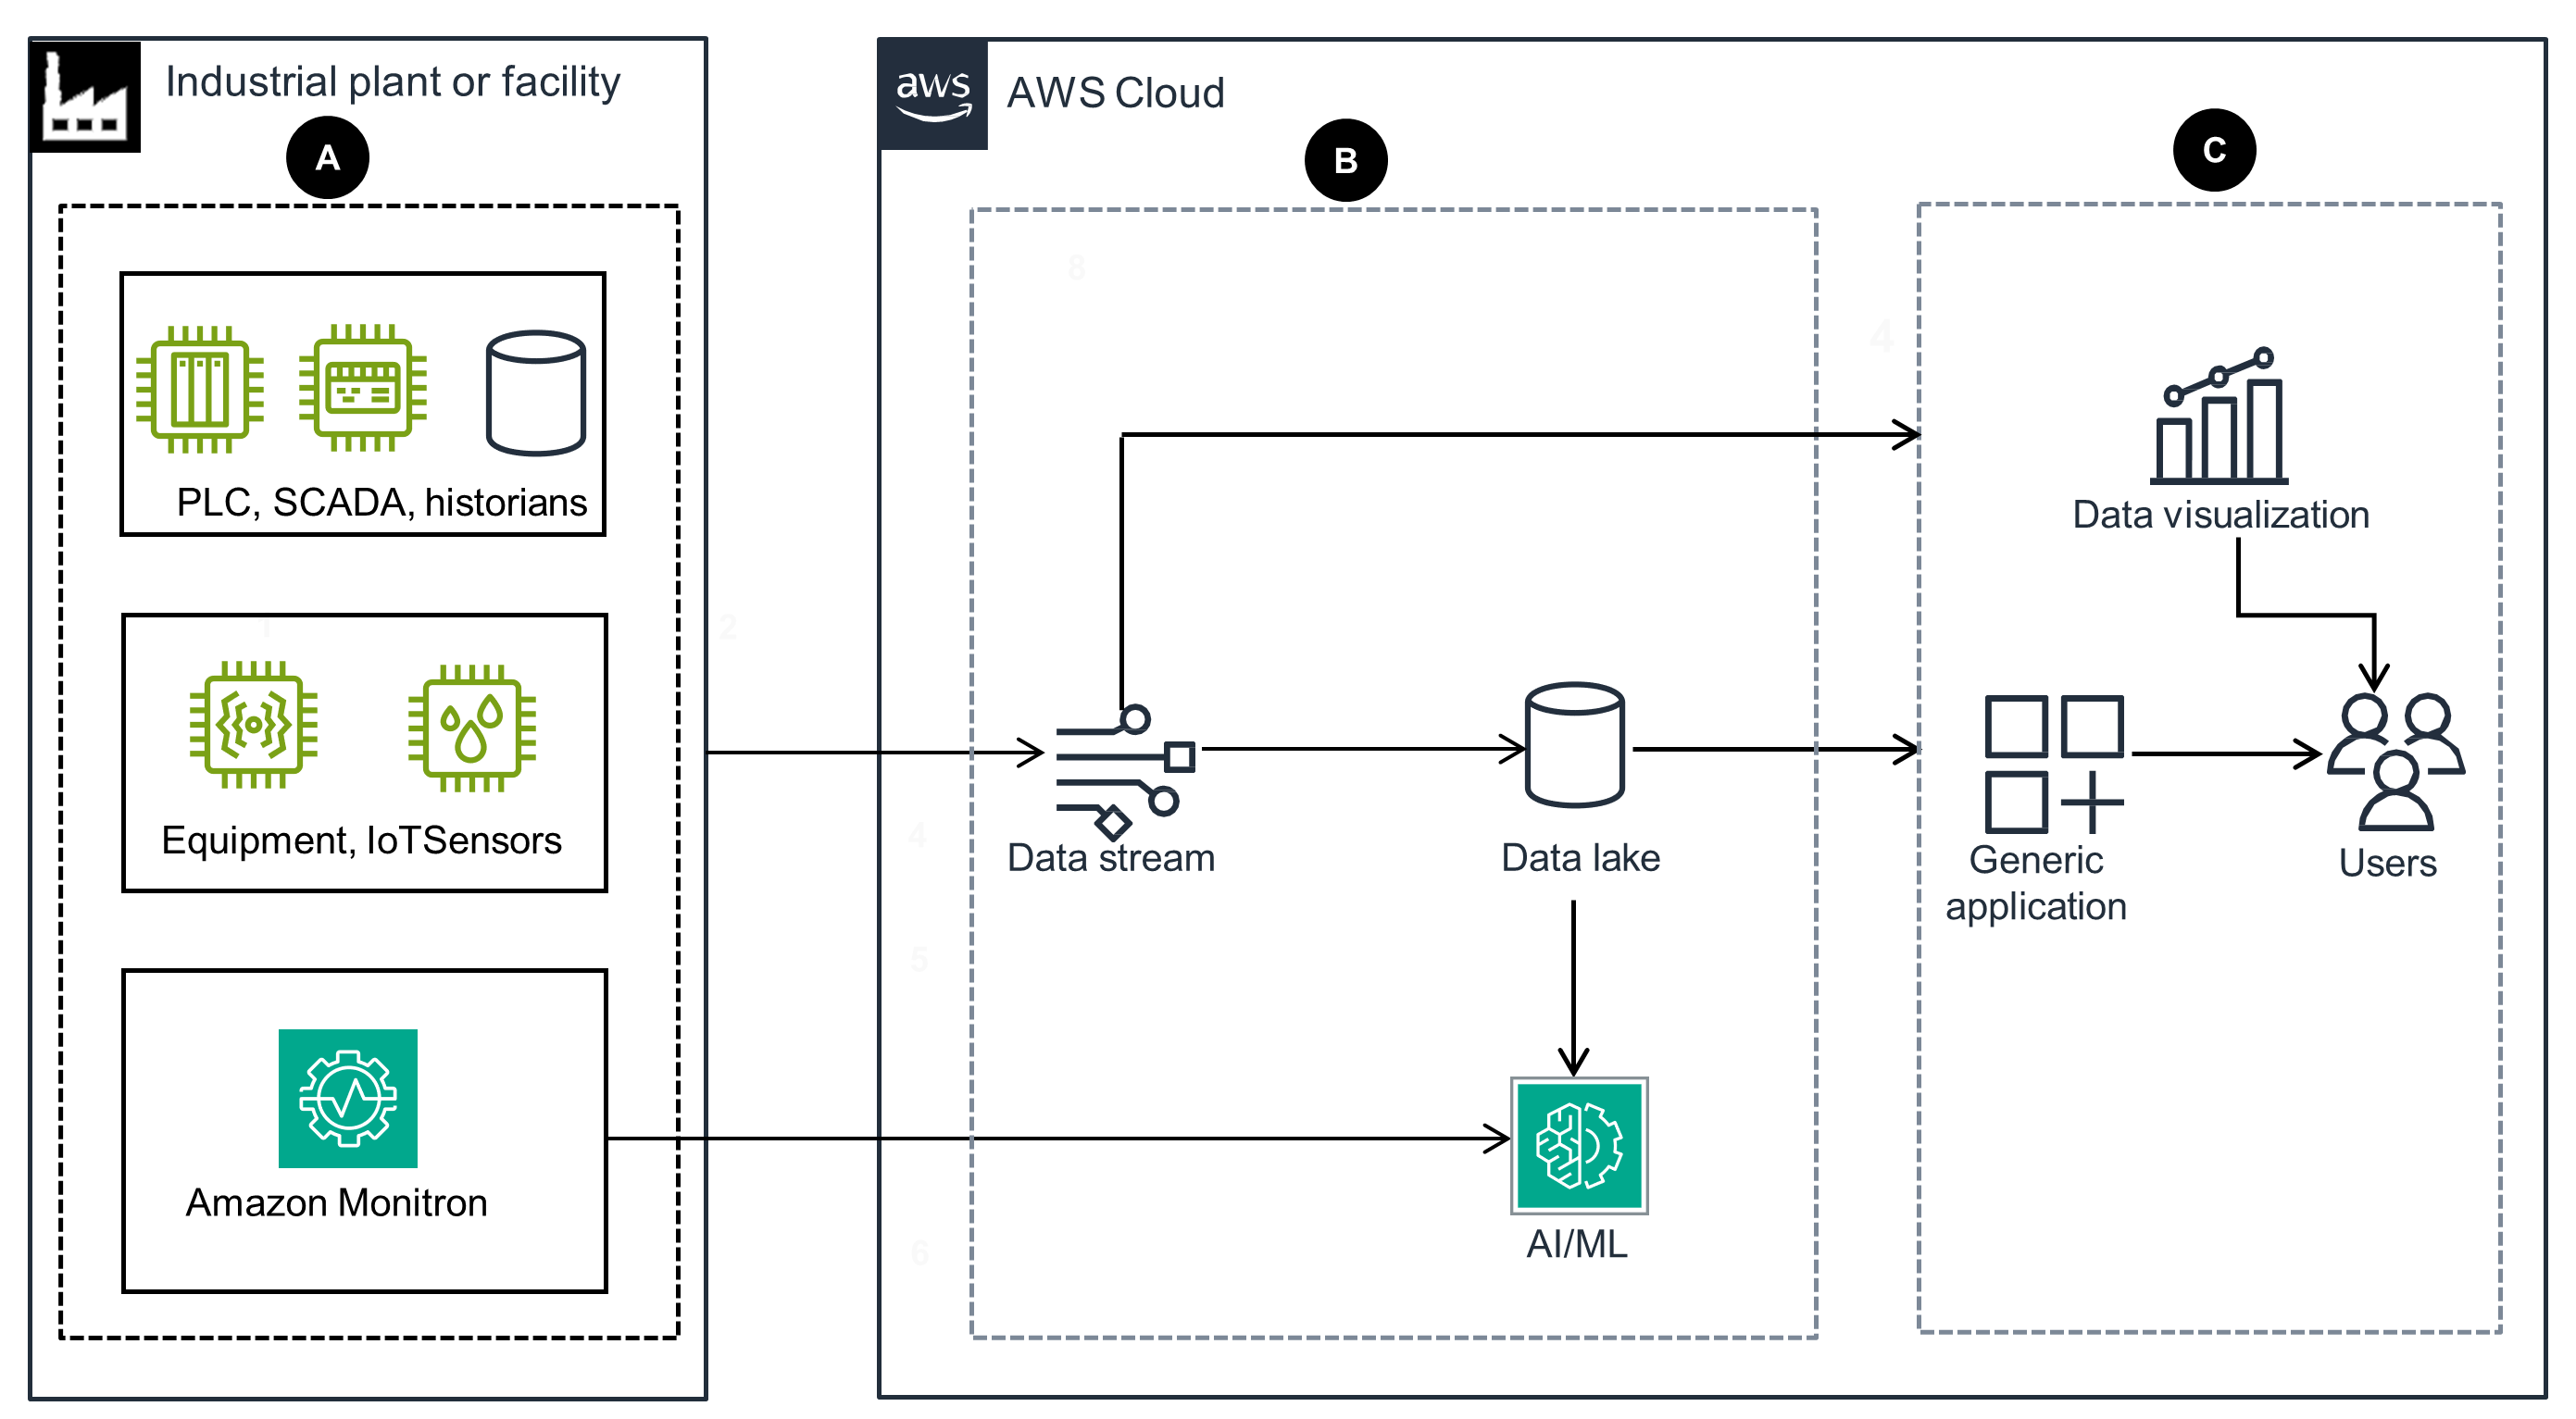
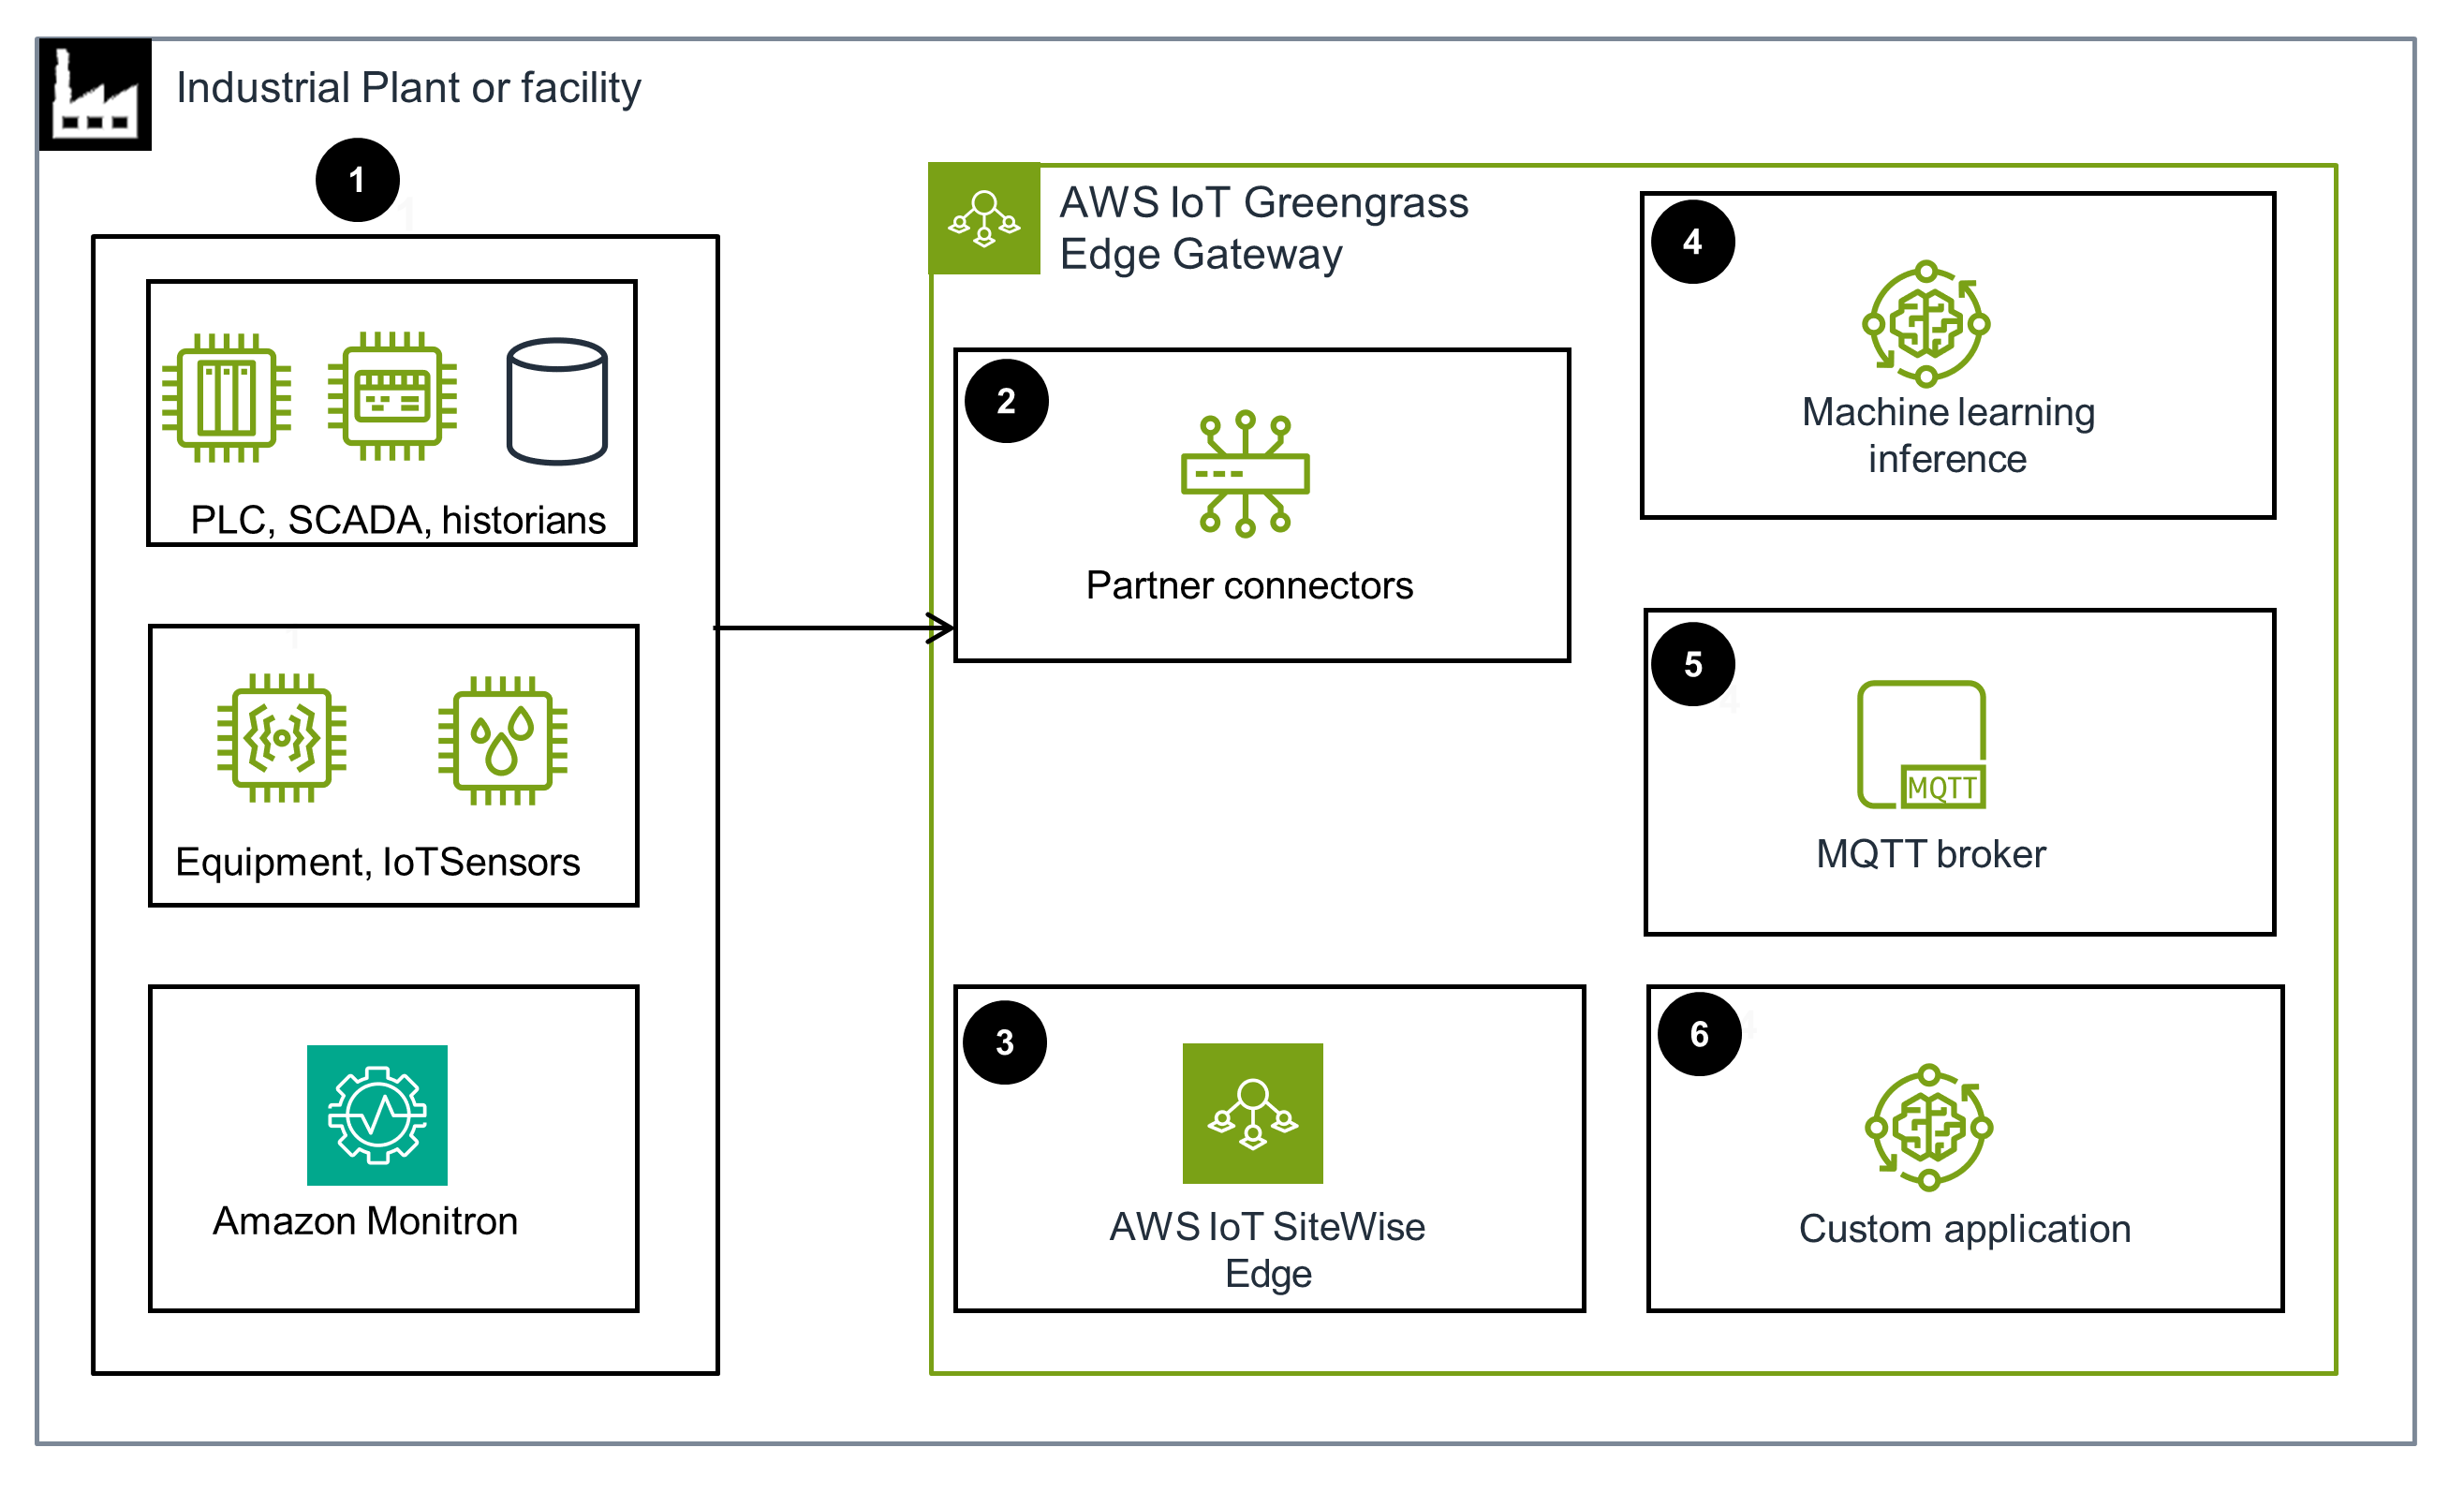
Data ingestion
This architecture diagram displays an edge location component that enables on-site data ingestion from IoT sessions, PLCs, SCADA, and historians.
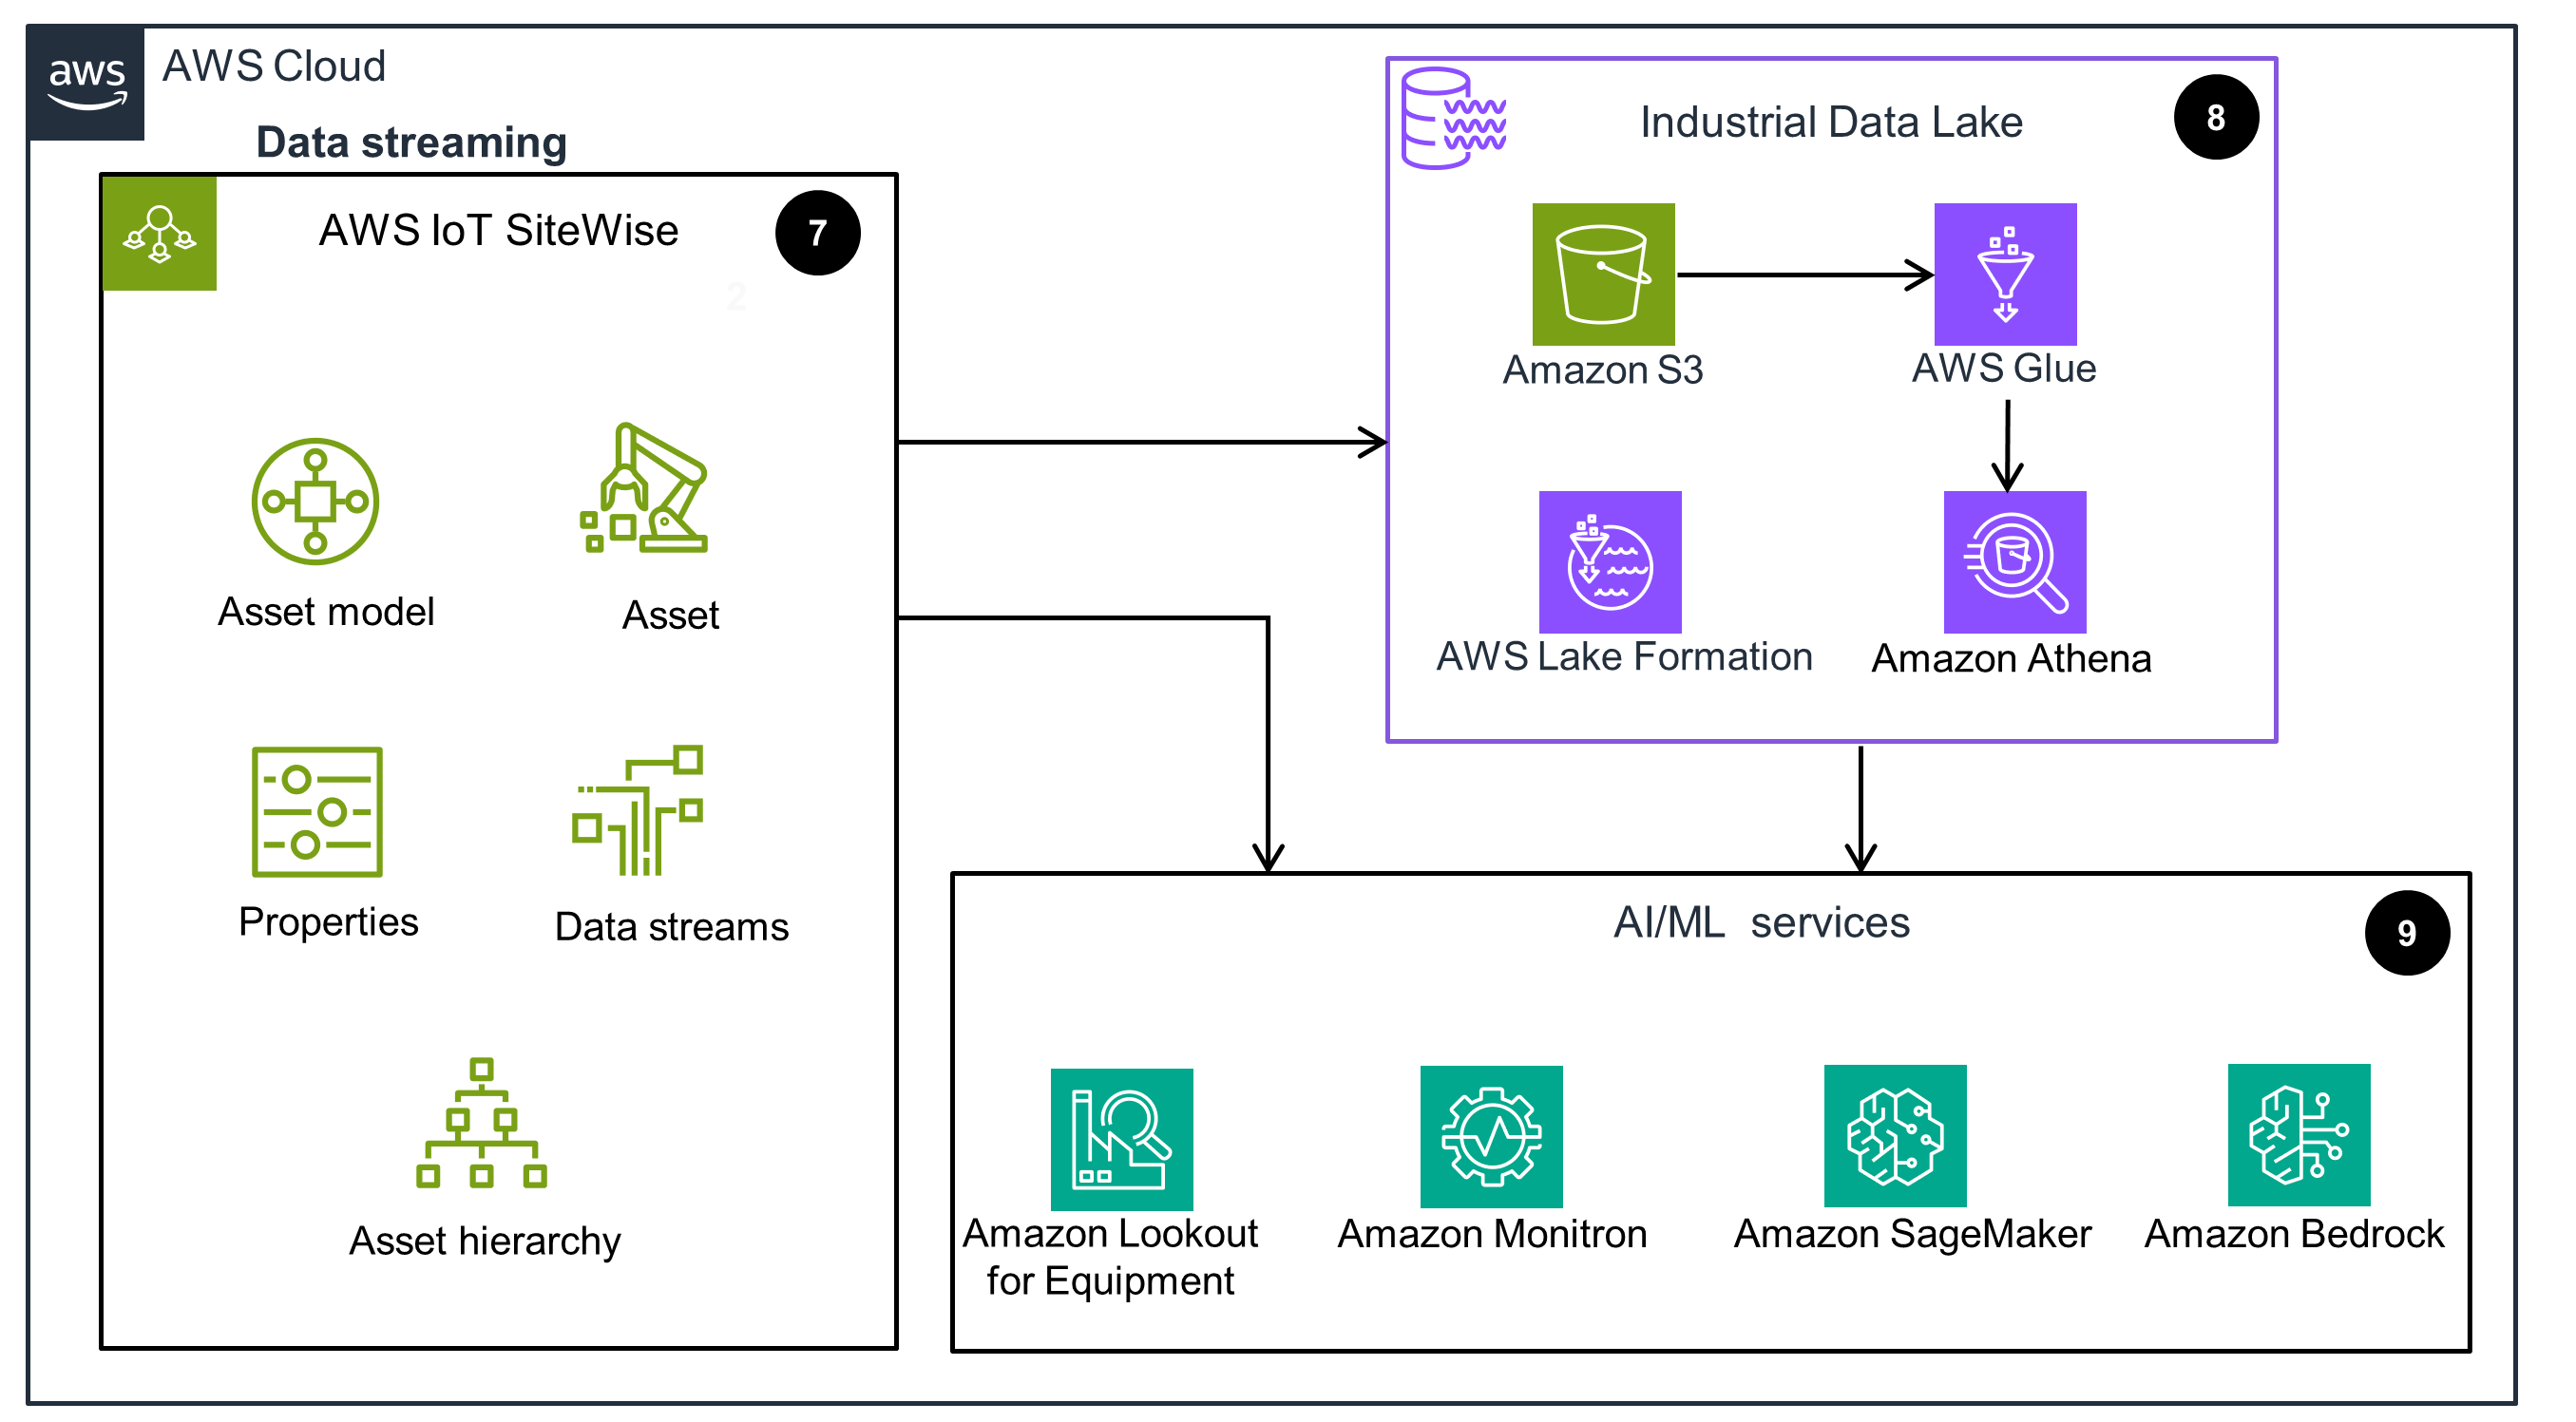
Data streaming, processing, and machine learning
This architecture diagram shows how data from the edge location is processed and ingested into a data lake, along with AI/ML services.
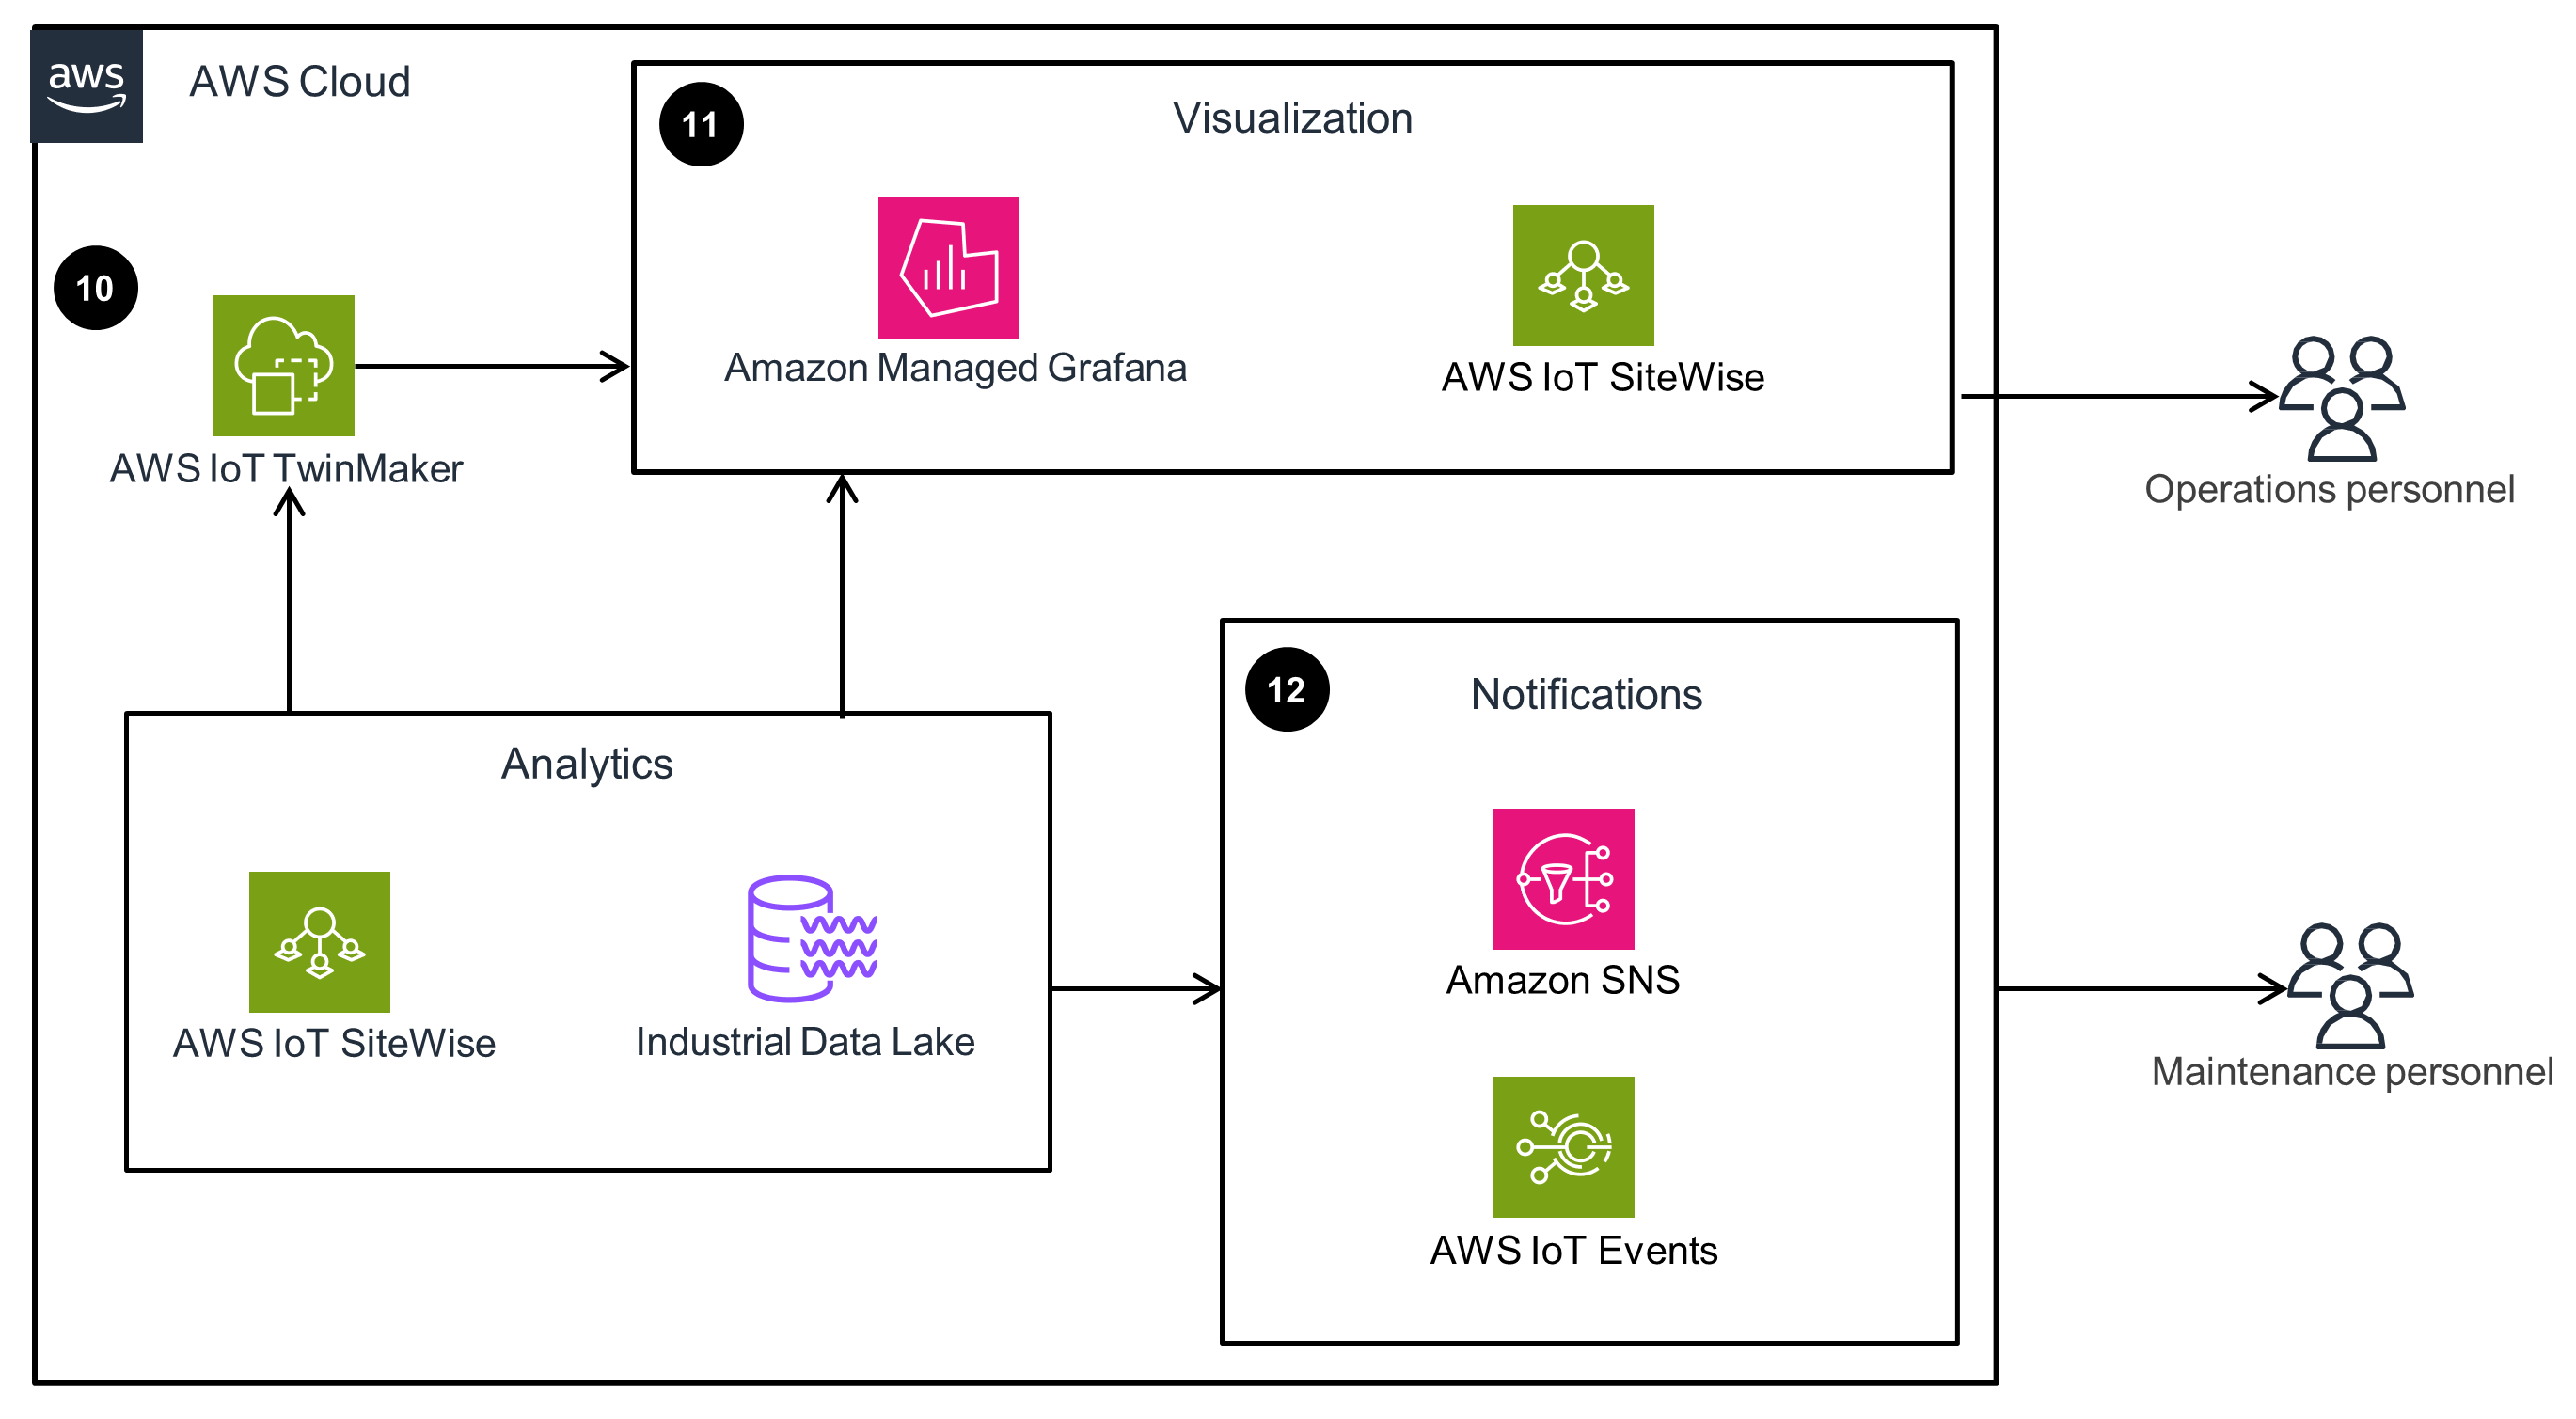
Data visualization and notifications
This architecture diagram shows how data is ingested and used for dashboards for 3D visualizations.
Well-Architected Pillars
The architecture diagram above is an example of a Solution created with Well-Architected best practices in mind. To be fully Well-Architected, you should follow as many Well-Architected best practices as possible.
The services used in this Guidance aid in data ingestion, local processing, event monitoring, message delivery, and machine learning for manufacturing optimization. For example, AWS IoT SiteWise and IoT Greengrass handle data collection, processing, and edge computing, while AWS IoT Events identifies significant sensor data events. Amazon SNS manages messaging, and AI/ML is used to extract insights from operational data for process improvements, predictive maintenance, quality control, and automated inspections.
This Guidance uses AWS Identity and Access Management (IAM) and AWS IoT Core to help protect your data, systems, and assets while improving your security posture. For instance, IAM policies are scoped to allow only the minimum required permissions, while IoT Greengrass policies control which devices can send data and interact with the cloud, limiting unauthorized access to prevent accrued charges, tampering, or malicious operations. Additionally, encryption at rest is enabled for all cloud data destinations, like Amazon Simple Storage Service (Amazon S3) and AWS IoT SiteWise. By implementing granular access controls, device policies, and data encryption, these services enhance security by mitigating the risks of unauthorized access, data breaches, and potential threats to industrial assets and operations.
With AWS IoT SiteWise and AWS IoT TwinMaker, throttling limits are in place for data ingress and egress to help assure continued operation. In addition, the Managed Grafana console provides access to a workspace for visualizing and analyzing metrics, logs, and traces without the need to manage infrastructure. It automatically provisions, configures, manages operations, and scales to meet dynamic usage demands—critical for handling peak industrial operations.
For optimal performance, it is recommended that you configure a multi-Availability Zone (AZ) deployment strategy.
By implementing a multi-AZ architecture, throttling safeguards, and managed services that auto-scale, this Guidance helps ensure reliable data ingestion, analysis, and visualization even during high-traffic periods, minimizing downtime and disruptions to industrial processes.
AWS IoT TwinMaker collects outgoing messages to AWS IoT SiteWise to prevent throttling as tag volumes increase. For analytics, AWS IoT SiteWise and Amazon S3 automatically scale to accommodate data storage needs. For edge applications, AWS IoT SiteWise Edge offers features like edge dashboards and processing optimized for near real-time performance.
In addition, this Guidance uses the auto-scaling capabilities of AWS IoT SiteWise and Amazon S3. It also optimizes the localized processing capability for AWS IoT SiteWise Edge to deliver high performance across data ingestion, storage, analytics, and edge computing. This scalable and optimized approach prevents throttling, accommodates fluctuating data volumes, and provides low-latency processing for time-sensitive industrial operations.
For equipment connectivity, the main cost savings come from reduced onsite operational effort, such as regulator costs and human resources. Therefore, you should choose services that bring automation, minimum administration, and scalability. The engineering hours saved should be the primary metric when assessing AWS technologies, as service rates are a smaller part of the financial assessment. Additionally, the total cost of ownership (TCO) and overhead savings are important, as AWS customers often spend significant resources managing on-premises IT infrastructure.
AWS IoT SiteWise and AWS IoT TwinMaker are cost-optimized, managed services that provide digital twin capabilities at the lowest possible price point. Their pay-as-you-go pricing model charges only for the data ingested, stored, and queried. AWS IoT SiteWise also offers optimized storage settings to move data from hot to cold tiers in Amazon S3.
To address sustainability commitments across industries like manufacturing, construction, energy, utilities, and oil and gas, this Guidance uses AWS IoT SiteWise and Amazon Bedrock. These services enhance sustainability through an elastic IT infrastructure that scales based on usage, minimizing excess compute resources and associated emissions that can be tracked through the Customer Carbon Footprint Tool. Additionally, these services enable engineering agility with digital twins, event-based automation, and AI/ML insights to optimize on-site operations, increase efficiency, and minimize emissions.
AWS IoT SiteWise further supports sustainability with its cold storage tier using the open-source, columnar Apache Parquet format on Amazon S3 for efficient data storage and retrieval.
Lastly, Amazon Bedrock provides data visualization and natural language processing capabilities, where you have access to foundation models to build generative AI applications. These capabilities help you identify unknown risk areas from historical data and validate the effectiveness of interventions, further aiding emission reduction efforts.
Disclaimer
The sample code; software libraries; command line tools; proofs of concept; templates; or other related technology (including any of the foregoing that are provided by our personnel) is provided to you as AWS Content under the AWS Customer Agreement, or the relevant written agreement between you and AWS (whichever applies). You should not use this AWS Content in your production accounts, or on production or other critical data. You are responsible for testing, securing, and optimizing the AWS Content, such as sample code, as appropriate for production grade use based on your specific quality control practices and standards. Deploying AWS Content may incur AWS charges for creating or using AWS chargeable resources, such as running Amazon EC2 instances or using Amazon S3 storage.
Did you find what you were looking for today?
Let us know so we can improve the quality of the content on our pages