AWS News Blog
New – Interactive AWS Cost Explorer API
|
|
 We launched the AWS Cost Explorer a couple of years ago in order to allow you to track, allocate, and manage your AWS costs. The response to that launch, and to additions that we have made since then, has been very positive. However our customers are, as Jeff Bezos has said, “beautifully, wonderfully, dissatisfied.”
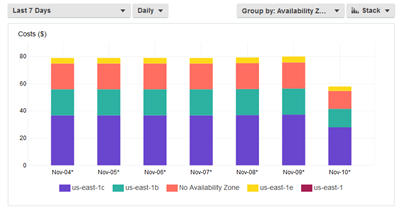
I see this first-hand every day. We launch something and that launch inspires our customers to ask for even more. For example, with many customers going all-in and moving large parts of their IT infrastructure to the AWS Cloud, we’ve had many requests for the raw data that feeds into the Cost Explorer. These customers want to programmatically explore their AWS costs, update ledgers and accounting systems with per-application and per-department costs, and to build high-level dashboards that summarize spending. Some of these customers have been going to the trouble of extracting the data from the charts and reports provided by Cost Explorer!
New Cost Explorer API
Today we are making the underlying data that feeds into Cost Explorer available programmatically. The new Cost Explorer API gives you a set of functions that allow you do everything that I described above. You can retrieve cost and usage data that is filtered and grouped across multiple dimensions (Service, Linked Account, tag, Availability Zone, and so forth), aggregated by day or by month. This gives you the power to start simple (total monthly costs) and to refine your requests to any desired level of detail (writes to DynamoDB tables that have been tagged as production) while getting responses in seconds.
Here are the operations:

GetCostAndUsage – Retrieve cost and usage metrics for a single account or all accounts (master accounts in an organization have access to all member accounts) with filtering and grouping.
GetDimensionValues – Retrieve available filter values for a specified filter over a specified period of time.
GetTags – Retrieve available tag keys and tag values over a specified period of time.
GetReservationUtilization – Retrieve EC2 Reserved Instance utilization over a specified period of time, with daily or monthly granularity plus filtering and grouping.
I believe that these functions, and the data that they return, will give you the ability to do some really interesting things that will give you better insights into your business. For example, you could tag the resources used to support individual marketing campaigns or development projects and then deep-dive into the costs to measure business value. You now have the potential to know, down to the penny, how much you spend on infrastructure for important events like Cyber Monday or Black Friday.
Things to Know
Here are a couple of things to keep in mind as you start to think about ways to make use of the API:
Grouping – The Cost Explorer web application provides you with one level of grouping; the APIs give you two. For example you could group costs or RI utilization by Service and then by Region.
Pagination – The functions can return very large amounts of data and follow the AWS-wide model for pagination by including a nextPageToken if additional data is available. You simply call the same function again, supplying the token, to move forward.
Regions – The service endpoint is in the US East (N. Virginia) Region and returns usage data for all public AWS Regions.
Pricing – Each API call costs $0.01. To put this into perspective, let’s say you use this API to build a dashboard and it gets 1000 hits per month from your users. Your operating cost for the dashboard should be $10 or so; this is far less expensive than setting up your own systems to extract & ingest the data and respond to interactive queries.
The Cost Explorer API is available now and you can start using it today. To learn more, read about the Cost Explorer API.
— Jeff;
