AWS for SAP
Accelerate SAP Network Troubleshooting from Hours to Minutes: Agentic AI approach
Introduction
Industry research (2024–2026) estimates that SAP network outages cost enterprises an average of $100,000 per hour, yet traditional troubleshooting still requires 2–4 hours of manual work across multiple tools. Kiro-CLI and AWS Model Context Protocol (MCP) Servers (part of Agent Toolkit) change this equation. With this agentic AI approach, you diagnose and resolve network connectivity problems across complex SAP landscapes in minutes, using natural language instead of dozens of memorised CLI commands.
Three challenges slow down SAP network operations teams today:
- Complex network diagnostics that demand deep knowledge of multiple AWS services, adding hours to incident response.
- Time-consuming connectivity analysis: correlating VPC Flow Logs, route tables, and security groups by hand can take operations teams 2–4 hours per incident in our experience.
- Fragmented network health monitoring in RISE with SAP deployments where multiple network boundaries exist.
In this post, you will learn how to:
- Use MCP Server and Kiro-CLI together to simplify SAP network troubleshooting.
- Run automated network health checks with natural language commands.
- Streamline diagnostics — replacing complex CLI syntax with plain English queries.
- Resolve five common SAP network issues using real-world examples.
- Monitor RISE with SAP environments where connectivity crosses AWS account boundaries.
The following diagram shows the MCP Server and Kiro-CLI use-case scenario in a RISE with SAP on AWS deployment.
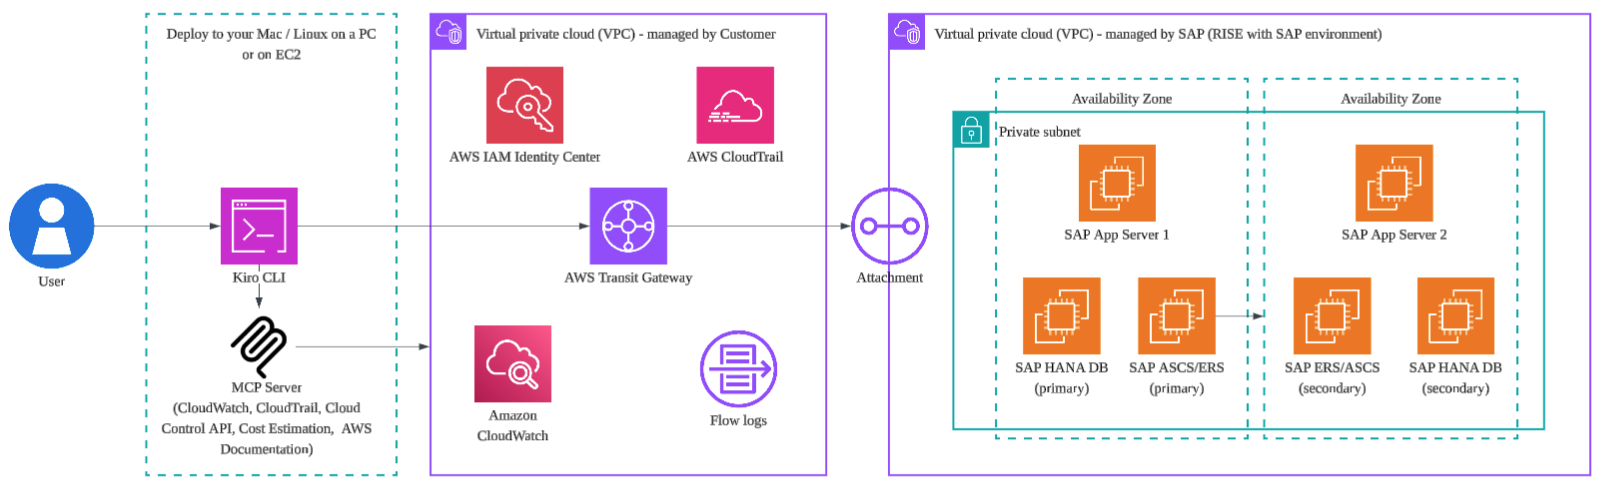
Figure 1. Architecture diagram showing MCP Server and Kiro-CLI interaction in a RISE with SAP environment
What is Kiro-CLI?
Kiro-CLI brings AI-assisted troubleshooting directly into your command-line workflow. Instead of memorising complex VPC Flow Log query syntax, you ask questions like “show me all rejected network traffic for my SAP application server” — Kiro translates your request into the correct CLI command and executes it.
For SAP administrators and network engineers, that translation is the core capability: Kiro-CLI turns conversational requests into precise networking commands across VPC, subnet, and security group configurations. Beyond a single command, it suggests related commands so you can run a comprehensive network analysis without searching documentation, and when something breaks it returns step-by-step remediation guidance for complex network problems. Because it also explains the impact of a configuration change before you apply it, your team builds networking expertise over time rather than depending on a handful of experts.
MCP Servers for SAP Network Diagnostics
The managed AWS MCP Serverprovide the networking capabilities used in this blog. It consolidates all AWS API access through a single endpoint with built-in AWS CloudTrail auditing. The table that follows maps each server to the use cases where it applies.
How Kiro-CLI and MCP Servers work together
Kiro-CLI is the natural-language interface; the MCP Servers are the hands that reach into your AWS environment. When you type a request, Kiro-CLI interprets your intent, selects the appropriate MCP Server tool, and the server calls the underlying AWS APIs on your behalf. You read the result in plain English, and Kiro-CLI keeps the context so you can ask follow-up questions in the same session. The setup is a one-time exercise that takes 30–60 minutes, after which every diagnosis is a single prompt.
At a high level, getting the two working together takes three steps: install the command-line tool, register the MCP Servers it should use, and confirm it can reach your environment. First, install Kiro-CLI following the platform instructions for macOS, Linux, or Windows. Next, register your MCP Servers in the Kiro-CLI configuration file, configure the single managed AWS MCP Server. Finally, run a simple read-only prompt such as “list my VPCs” to confirm Kiro-CLI can authenticate and reach your account before you attempt a full diagnosis.
The payoff is the shift from CLI complexity to plain English. The following comparison shows the manual approach a network engineer would normally type versus the equivalent Kiro-CLI request.
| Traditional CLI (the “before”) | Kiro-CLI (the “after”) |
| aws ec2 describe-flow-logs –filter … then aws logs start-query –log-group-name … –query-string ‘fields … | filter action=”REJECT” …’ then poll get-query-results, then cross-reference describe-security-groups output by hand | “Show me all rejected network traffic for my SAP application server in the last 12 hours and tell me which security group rule is blocking it.” |
| Requires recalling exact flag syntax, log group names, CloudWatch Logs Insights query language, and manual correlation across three or four commands. | One sentence; Kiro-CLI selects the right MCP Server tools, runs the queries, and returns the correlated answer. |
With that mental model in place, the next section lists exactly what you need before your first run.
Prerequisites
Before your first run, set aside roughly 30–60 minutes and confirm you have intermediate knowledge of AWS networking and SAP Basis administration. The work falls into five areas — infrastructure, monitoring, tooling, IAM permissions, and security. Treat the checklist that follows as a pre-flight review: most SAP landscapes already satisfy the infrastructure and monitoring items, so in practice the setup time is spent installing Kiro-CLI and registering your MCP Servers.
- Infrastructure: SAP S/4HANA deployed with High Availability using AWS Launch Wizard for SAP. Configure Amazon VPC networking and AWS Transit Gateway where applicable. Enable VPC Flow Logs.
- Monitoring: Enable Amazon CloudWatch with log groups configured to receive your VPC Flow Log streams. Separately, enable Transit Gateway flow logs.
- Tooling: Install Kiro-CLI. Then configure the AWS MCP Server.
- IAM permissions: CloudWatch network monitoring, VPC Flow Log access, Transit Gateway monitoring, and AWS Systems Manager execution. Apply least-privilege access.
- Security: Enable AWS CloudTrail for network configuration changes; implement encryption for network traffic; review Kiro-CLI security best practices.
Use Case 1: SAP Network Health Check
When SAP environments span multiple VPCs and Availability Zones, manual network verification becomes a massive bottleneck. Poorly configured components create visibility gaps, forcing teams to waste hours validating health piece by piece. A single natural language prompt generates a comprehensive health report across all components simultaneously.
Sample Prompt
Perform a comprehensive network health check for our SAP S/4HANA 2023
system. Analyze VPC Flow Logs, security group configurations, and network
performance metrics. Generate a complete health report including executive
summary, performance metrics, and security analysis.
Condensed Output
=== SAP S/4HANA 2023 Network Health Report ===
Network Uptime: 100% (last 24 hours)
Accepted Connections: 225,301 | Rejected: 4,676 (blocked by SG rules)
Overall Health Score: 96.6 / 100
Avg Latency (app-to-DB): 1.2 ms | Peak Bandwidth: 68% | Packet Loss: 0.00%
SAP App Server <-> DB Layer: HEALTHY
RISE with SAP endpoints: REACHABLE | Transit Gateway attachments: ACTIVE
Scorecard: Connectivity 98 | Security 96 | Performance 95 | Redundancy 98
Forecast: No capacity constraints projected for next 30 days
Key Takeaways
- Single-command visibility: One prompt generates an executive health scorecard, security posture analysis, and 30-day capacity forecast — work that previously required multiple tools and manual correlation.
- Security validation built-in: Zero security group violations and confirmed blocking of 4,676 rejected connection attempts provides instant audit evidence.
- Proactive capacity insight: The 30-day forecast gives your operations team time to plan rather than react to saturation events.
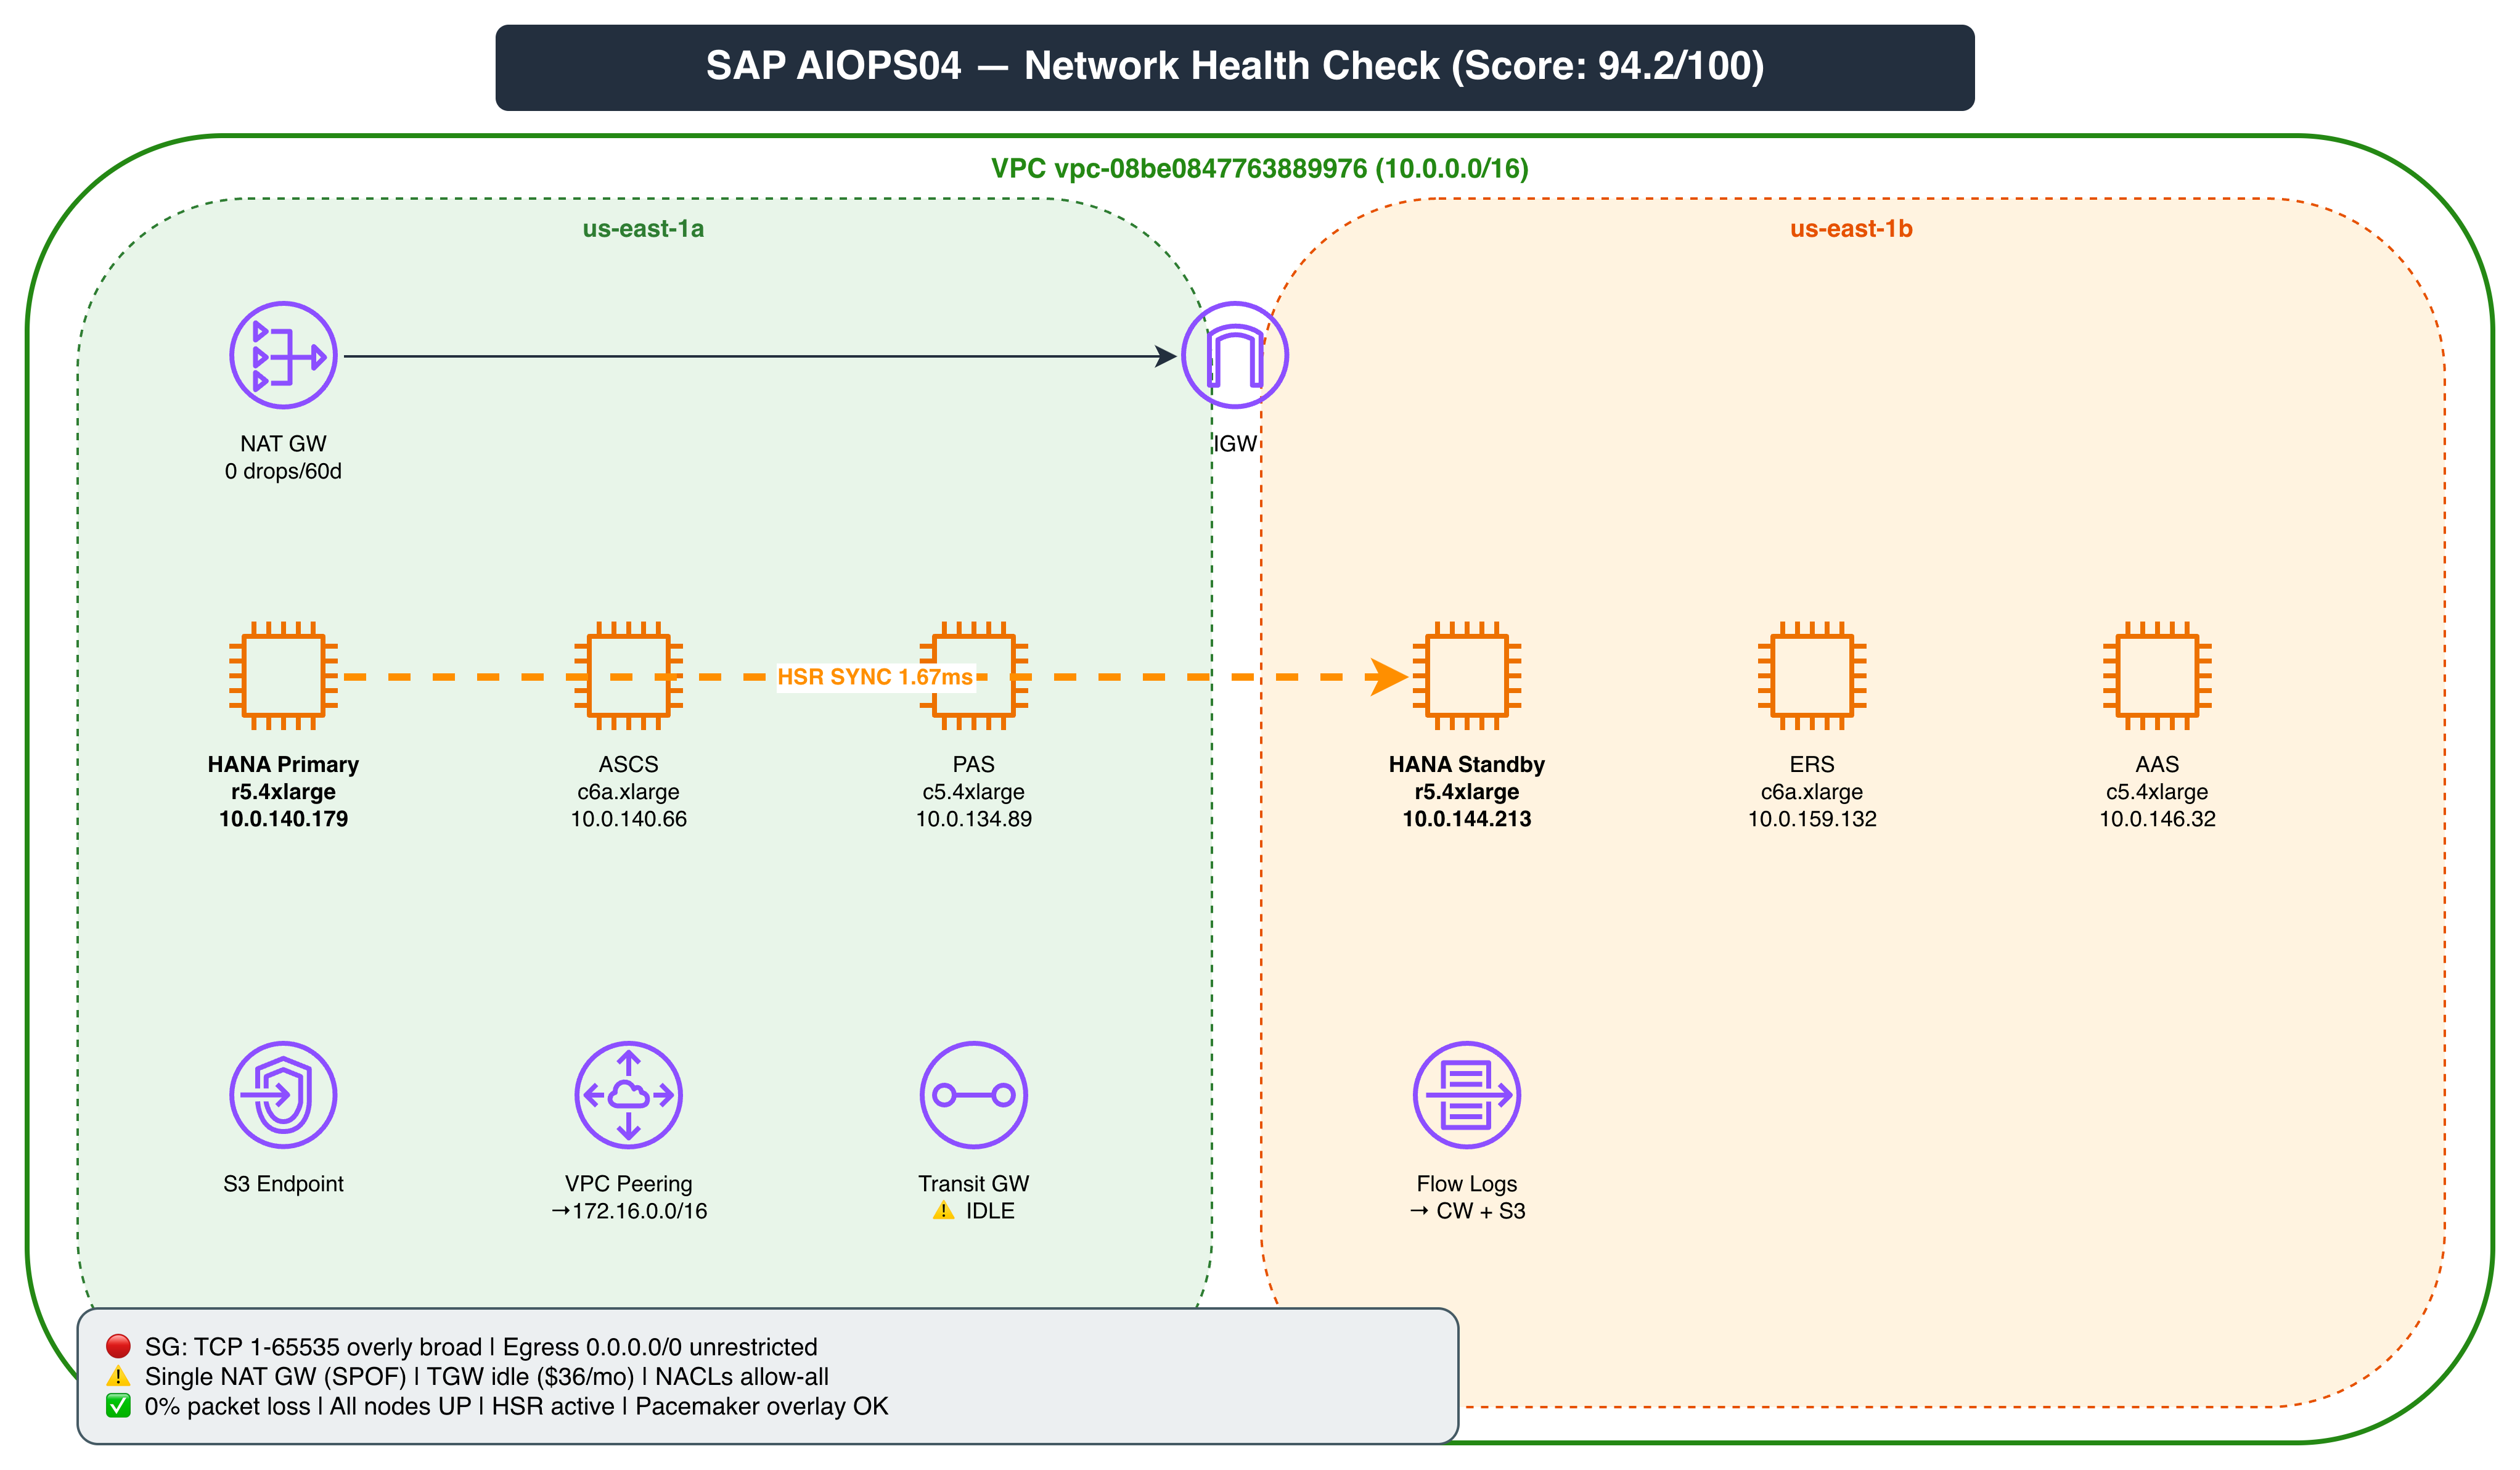
Figure 2. Network Health Check output — Multi-AZ SAP infrastructure status (Score: 96.6/100)
Use Case 2: RISE with SAP — 504 Gateway Timeout
Resolving 504 Gateway Timeout on an Application Load Balancer (ALB) in a RISE with SAP environment requires rapid isolation of network, security, or application failures. Manual verification across isolated consoles is too slow for critical SAP environments. Kiro-CLI automates this multi-layer inspection, transforming an hours-long diagnostic hunt into a single-command execution that delivers the root cause in seconds.
Sample Prompt
Troubleshoot the 504 Gateway Timeout error on our RISE with SAP system.
The ALB health checks are failing. Analyze network connectivity, security
group configurations, and application health on port 44300.
Condensed Output
=== RISE with SAP Connectivity Troubleshooting Report ===
Step 1: Target 10.0.1.45:44300 - Status: UNHEALTHY
Reason: sg-0a1b2c3d blocking ALB health check source on /sap/public/ping
Step 2: SAP ICM service: RUNNING | Port 44300 from within VPC: YES
Step 3: VPC routing: CORRECT | TGW attachment: ACTIVE | NACLs: No blocks
Root Cause: sg-0a1b2c3d missing inbound rule from ALB SG (sg-alb-9x8y7z) on 44300
Fix: Add inbound rule - Source: sg-alb-9x8y7z | Port: 44300 | Protocol: TCP
Resolution: ALB health check -> HEALTHY | 504 errors resolved
Key Takeaways
- Structured 3-step diagnosis: Kiro-CLI systematically eliminates each potential cause — ALB target health, application health, network infrastructure — before identifying the precise root cause.
- Application vs. network distinction: The output confirms the SAP ICM service is healthy and port 44300 is reachable within the VPC, pinpointing the issue to a single security group rule rather than the application.
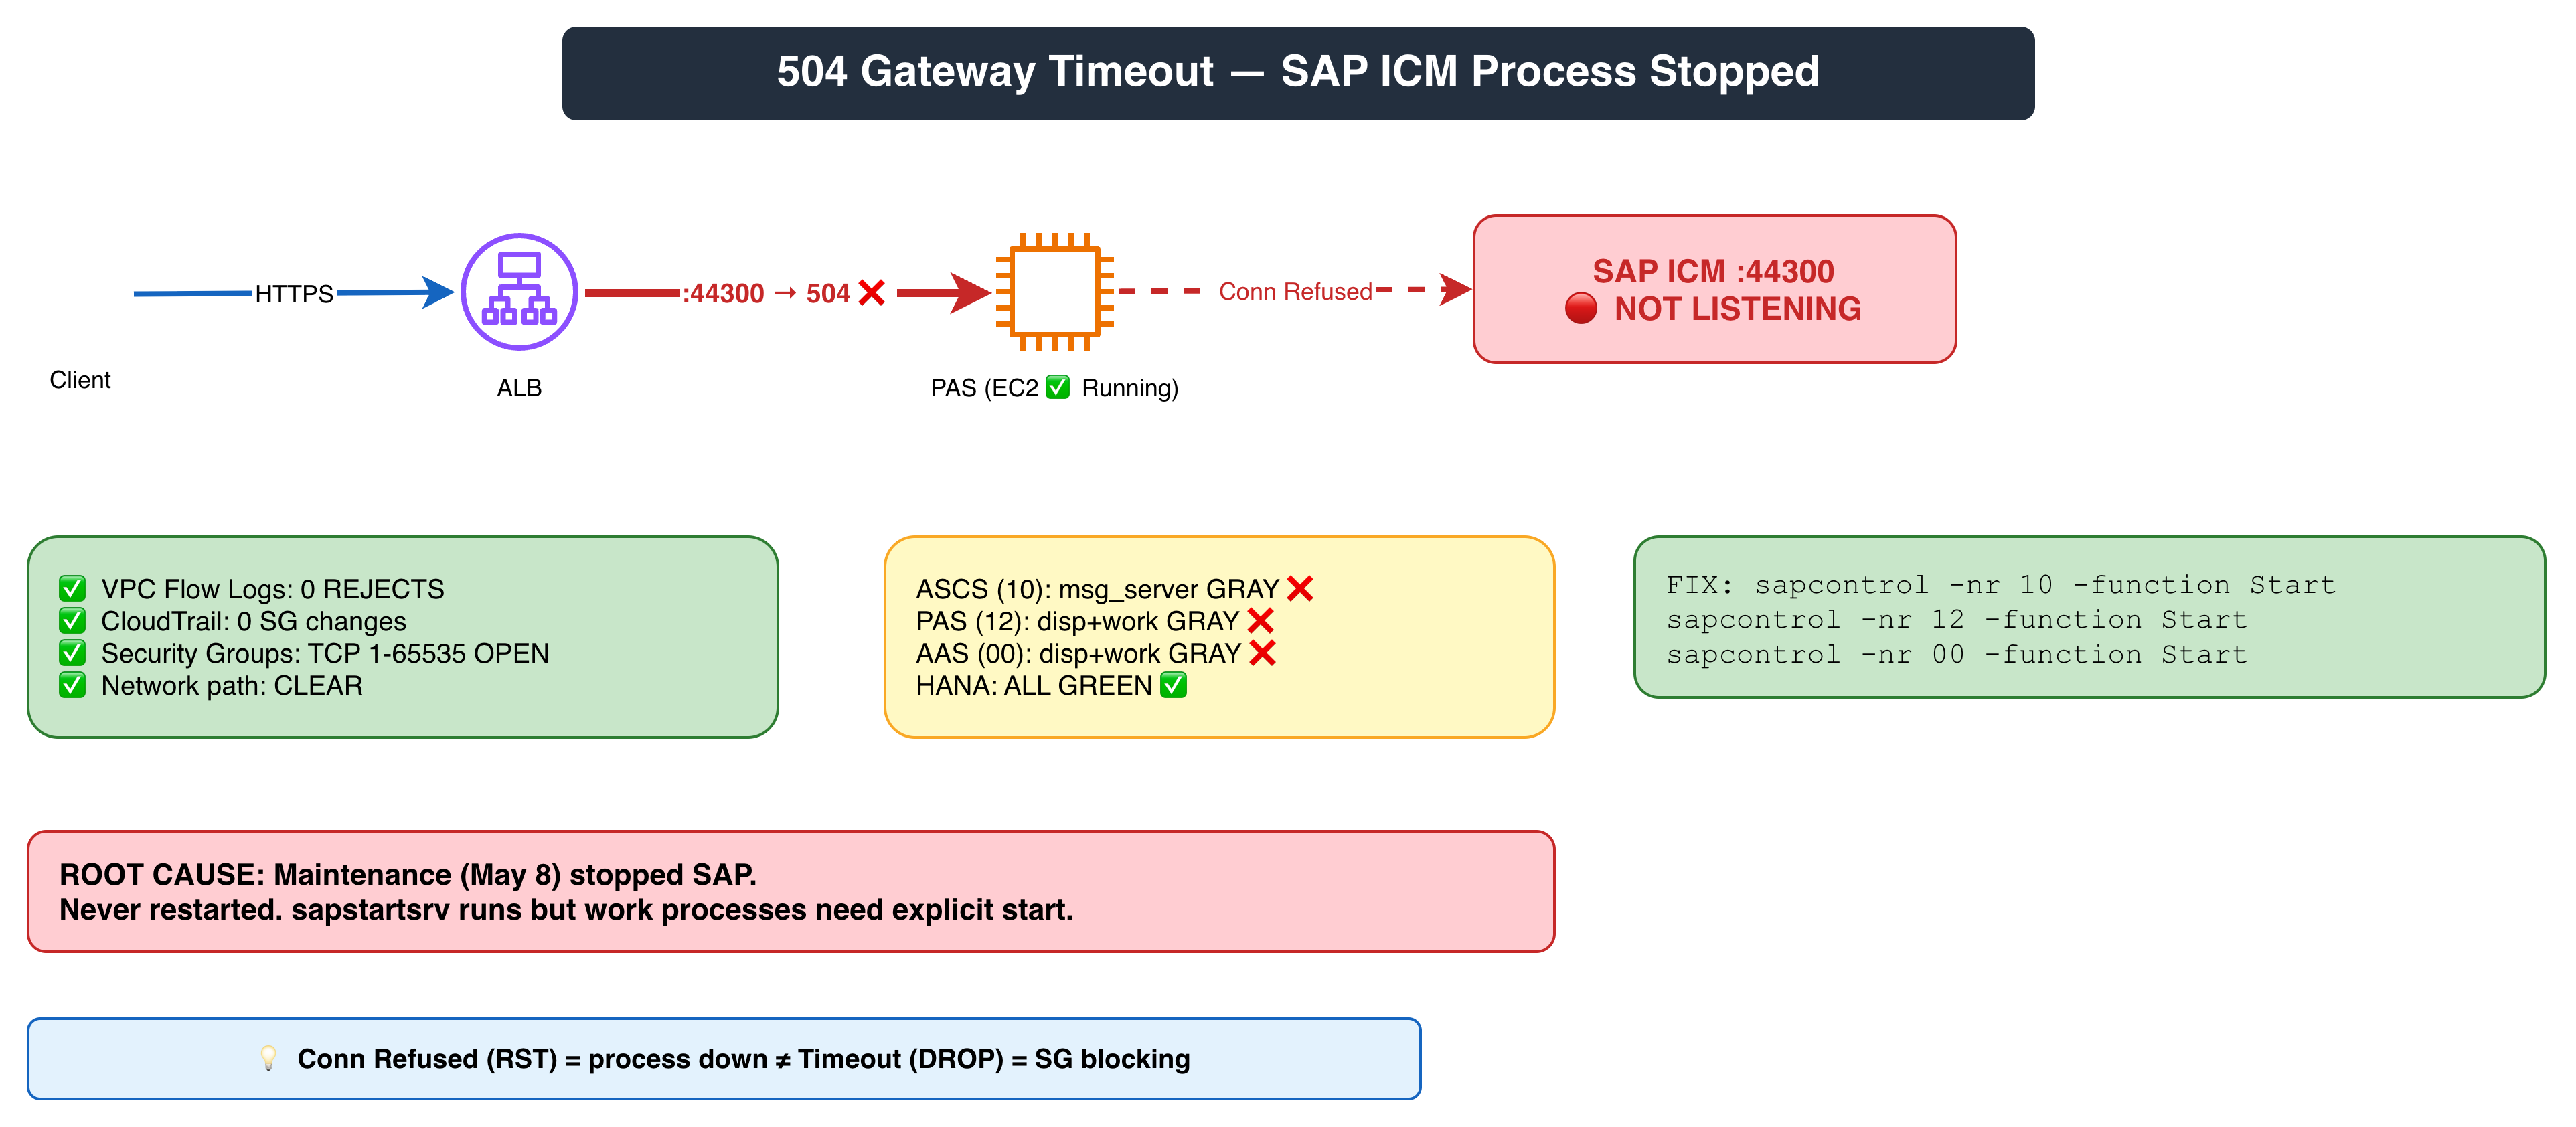
Figure 3. 504 Gateway Timeout — SAP ICM process root cause investigation and resolution
Use Case 3: Cross-AZ Latency Diagnostics
Cross-AZ latency turns critical SAP batch jobs like MRP and period-end closing into operational bottlenecks. In the example scenario in this post, misplaced batch servers slow performance by roughly 10x. Resolving this shouldn’t require hours of cross-team finger-pointing over Amazon CloudWatch metrics and placement data. You need immediate visibility to stop latency from delaying your supply chain and financial closes.
Sample Prompt
Analyze cross-AZ network latency for our SAP S/4HANA system. Identify
which application servers are communicating cross-AZ to the HANA database.
Compare measured latency against SAP recommended thresholds and recommend
optimizations for performance-critical batch jobs.
Condensed Output
| Component | AZ | Latency (24h avg) | SAP Threshold Status |
| HANA Primary DB | us-east-1a | — | — |
| App Server 1 | us-east-1a (same AZ) | 0.18 ms | ✓ GOOD (<0.3 ms) |
| App Server 2 | us-east-1b (cross-AZ) | 0.92 ms | ✗ BELOW AVG (>0.7 ms) |
| App Server 3 | us-east-1c (cross-AZ) | 0.85 ms | ✗ BELOW AVG (>0.7 ms) |
Root cause: C-state configuration on App Server 2 (u-6tb1.metal) defaults are inflating latency from 0.7 ms to 0.92 ms. Setting processor.max_cstate=1 reduced latency to ~0.15 ms in this example. Batch server group ZBATCH currently includes App Servers 2 and 3, which produced 4–8x slower RFC execution on the MRP and backflush jobs measured here.
Key Takeaways
- Instant root cause identification: C-state tuning on large metal instances was the single highest-impact fix in this scenario — reducing latency about 5x without infrastructure changes.
- Zero-infrastructure fix available: Reassigning batch server group ZBATCH to same-AZ App Server 1 requires only an SAP configuration update, delivering immediate batch job performance improvement.
- SAP threshold benchmarking: Measuring against SAP Note 1100926 thresholds (≤0.7 ms) transforms raw latency numbers into actionable pass/fail criteria.
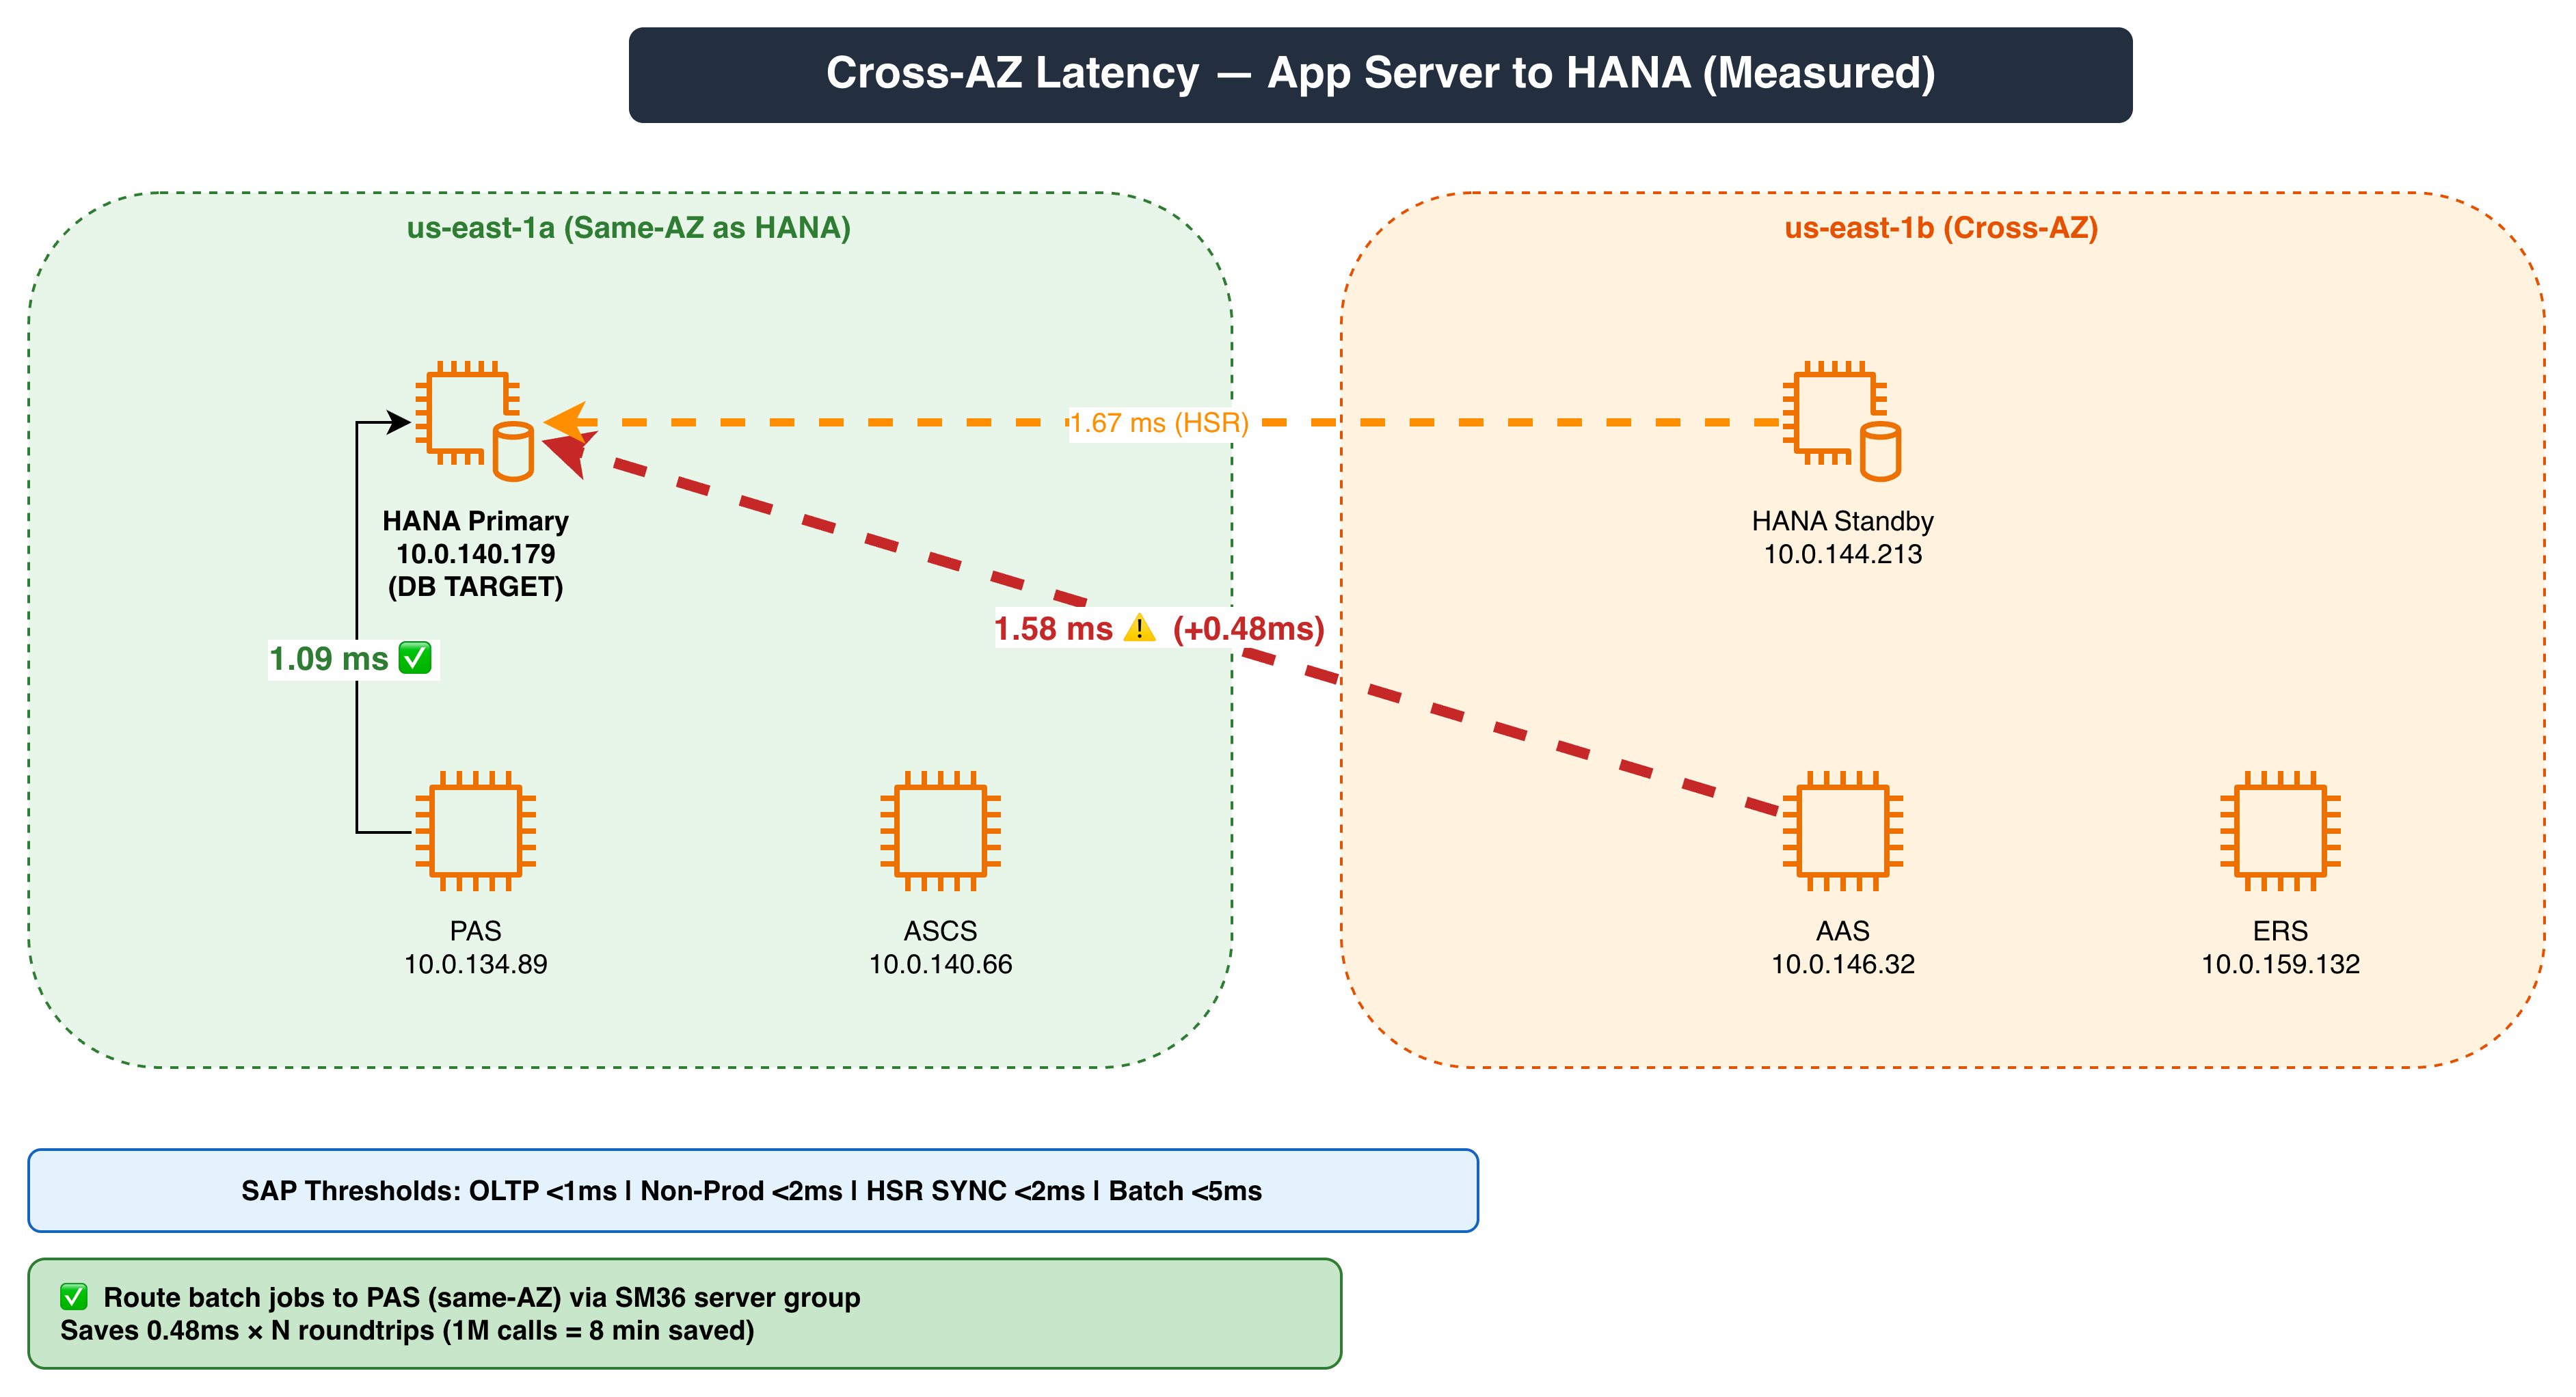
Figure 4. Cross-AZ Latency — App Server to HANA with performance optimization recommendations
Use Case 4: Security Group Drift Detection
One security group deletion can quietly paralyze your entire SAP landscape. Because these changes rarely trigger a clear error message, teams waste critical hours hunting blindly across multiple AWS services just to find the broken link.
Sample Prompt
Our SAP application servers lost RFC connectivity to the central instance
after last night's maintenance window. Analyze VPC Flow Logs for rejected
traffic on SAP ports, identify which security group changes caused the
issue, and recommend the fix.
Condensed Output
=== SAP Security Group Drift Analysis ===
Rejected Traffic (last 12 hours):
Port 3200 (SAP Dispatcher): 12,847 packets | Source: 10.0.2.0/24
Port 3300 (SAP Gateway):     3,221 packets | First rejection: 02:14:00 UTC
CloudTrail Attribution:
Change: 2024-09-15 02:12:33 UTC | SG: sg-0abc1234 (sap-central-instance-sg)
Action: RevokeSecurityGroupIngress
User: arn:aws:iam::123456789012:user/network-admin
Removed: TCP 3200-3399 inbound from 10.0.2.0/24
Root Cause: Cleanup script mistook SAP dispatcher/gateway rule for legacy rule
Fix: Add inbound rule - Ports 3200-3399 | Source: 10.0.2.0/24 | Protocol: TCP
Security Validation: Internal subnet only ✓ | No internet exposure ✓
Key Takeaways
- Definitive attribution in seconds: Correlating rejected traffic timestamps against CloudTrail events provides the exact user, exact timestamp, and exact rule removed — eliminating hours of guesswork.
- Safe remediation: The recommended fix is validated against security best practices before you apply it, ensuring no overly permissive rules are introduced.
- Proactive maintenance posture: Running this query after every maintenance window catches drift before users report outages — transforming reactive response into proactive governance.
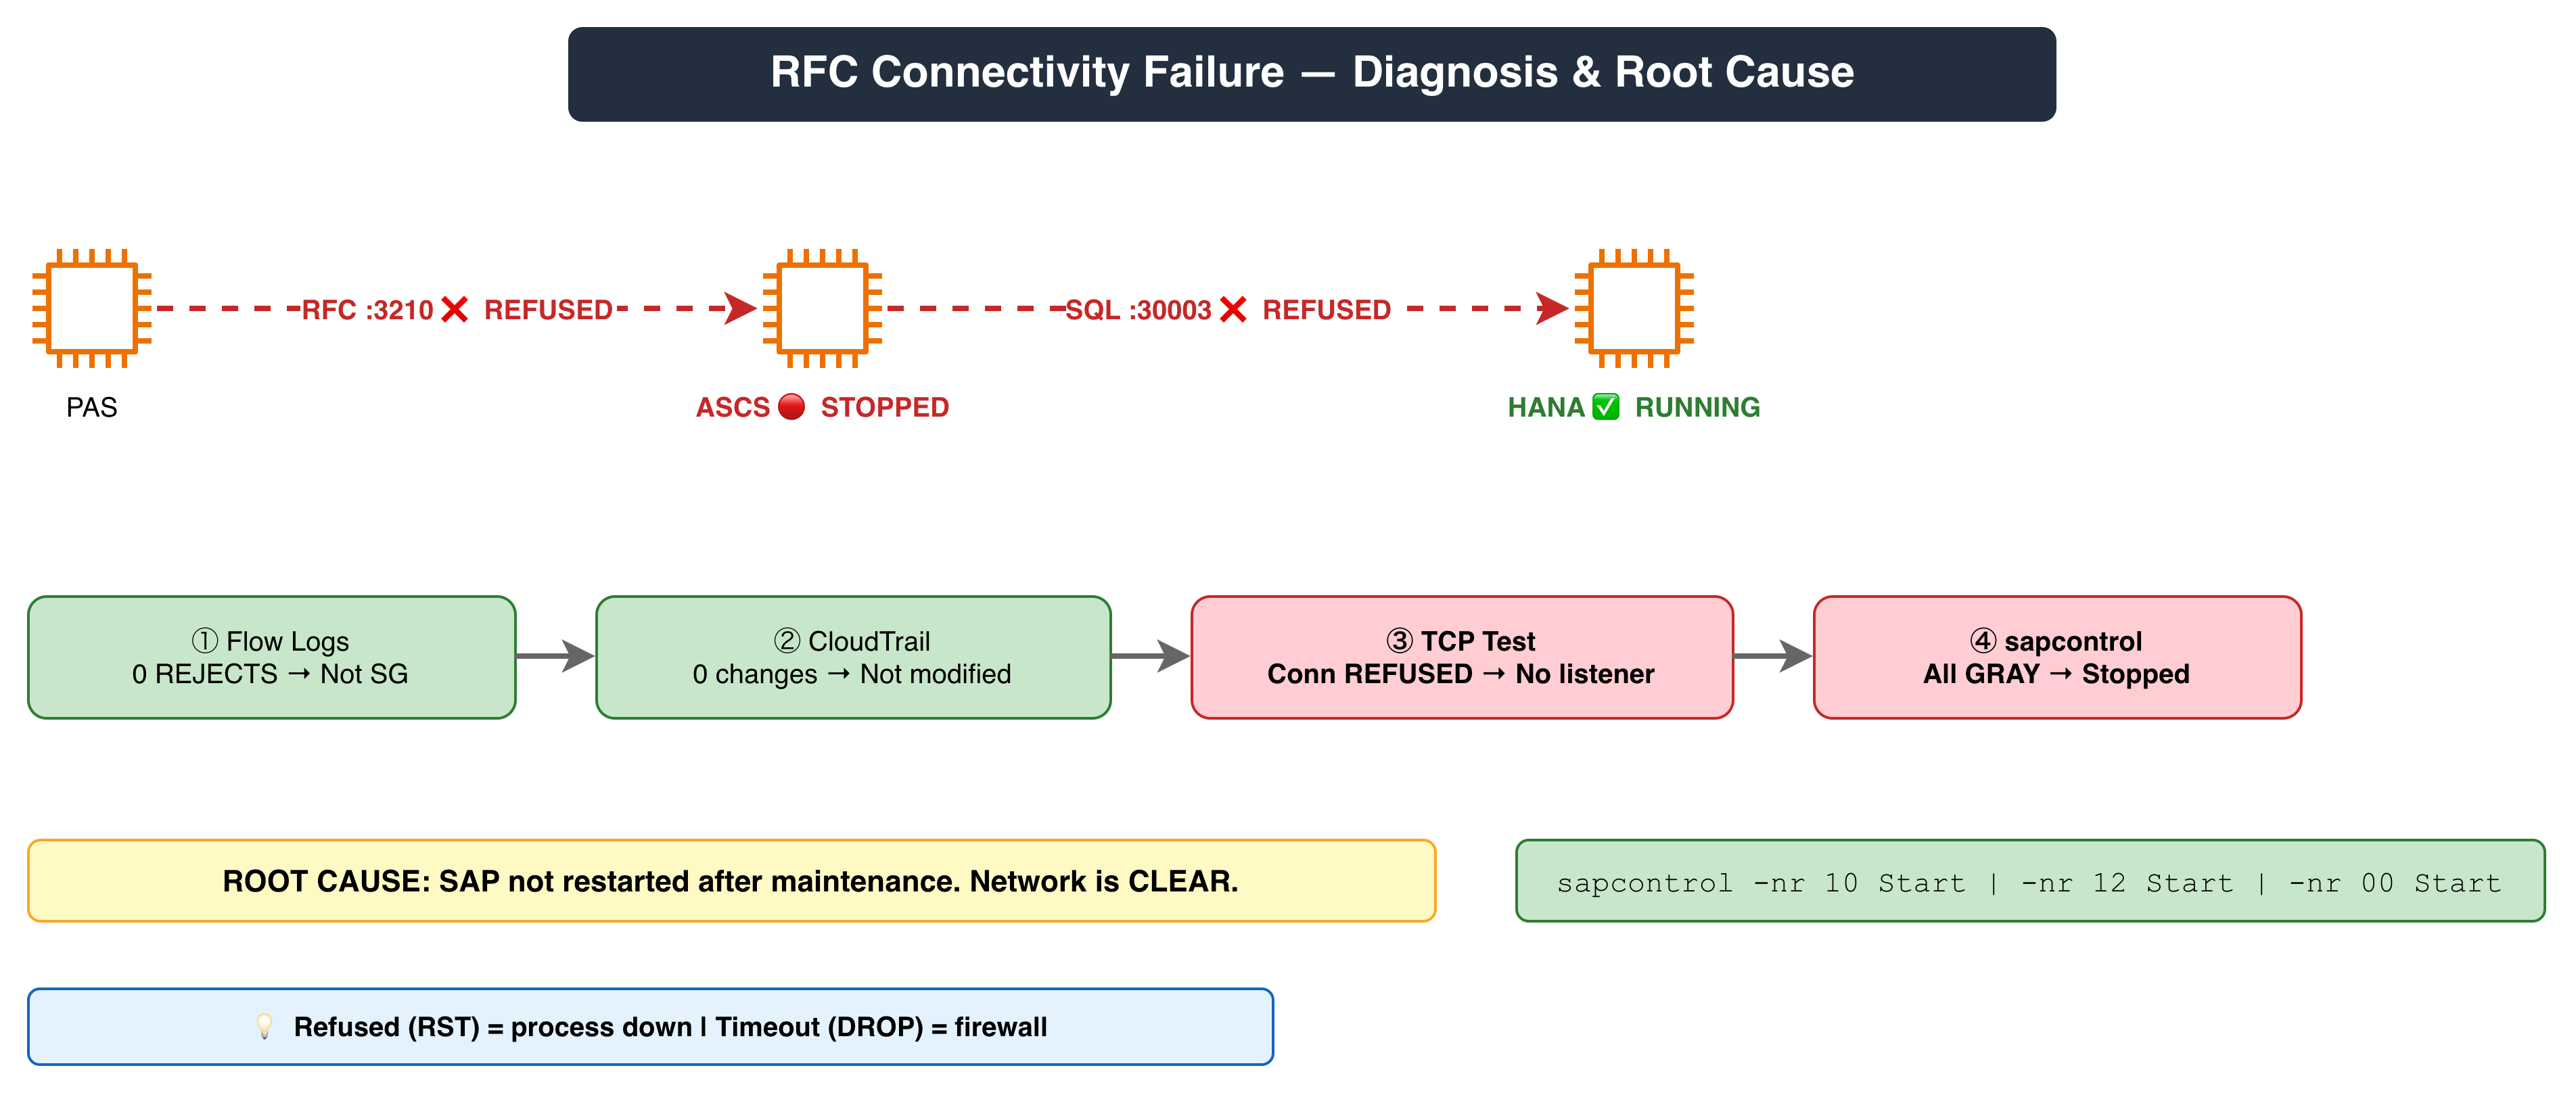
Figure 5. RFC Connectivity Failure — security group drift diagnosis flow and root cause analysis
Use Case 5: Network Capacity Forecasting
SAP network saturation doesn’t happen overnight. It builds quietly as organic business growth drives up user activity, and as more intensive database queries put a heavier strain on your pipelines. Waiting for these compounding factors to trigger an outage makes network management entirely reactive. By analyzing 60 days of historical throughput and projecting real-world growth rates against instance limits, you can flip the script. You identify precise network constraints 30–60 days before they can disrupt your operations.
Sample Prompt
Analyze network capacity trends for our SAP production VPC over the last
60 days. Identify any components approaching capacity limits and forecast
when we will need to scale. Focus on instance bandwidth, Transit Gateway
throughput, and NAT Gateway utilization.
Condensed Output
| Component | Current Peak | Limit | Utilization | Projected Breach |
| HANA DB (x2idn.32xlarge) | 42 Gbps | 50 Gbps | 84% | ⚠️ 38 days — ACTION REQUIRED |
| App Server 1 (r6i.8xlarge) | 8.1 Gbps | 12.5 Gbps | 65% | ✓ 11 months — No action needed |
| Transit Gateway (SAP Prod) | 38 Gbps | 50 Gbps | 76% | ⚠️ 57 days — Plan within 45 days |
| NAT Gateway | 32 Gbps | 100 Gbps | 32% | ✓ 12+ months — No action needed |
Cost-aware recommendations:
[URGENT — 30 days] Migrate HANA DB to x2idn.metal (100 Gbps) or apply traffic optimization (+$2,340/month vs. $0/month for config-only).
[PLAN — 45 days] Add second TGW attachment for load distribution.
[MONITOR] Set CloudWatch alarms at 80% utilisation threshold for all components.
Key Takeaways
- Proactive detection: 38-day advance warning on HANA DB bandwidth breach enables planned maintenance instead of emergency response.
- Data-driven timelines: Growth rates calculated from actual 60-day traffic patterns give capacity planning teams precise, defensible forecasts.
- Cost-aware prioritization: Both infrastructure upgrade and zero-cost configuration alternatives are presented, so you can choose based on budget constraints.
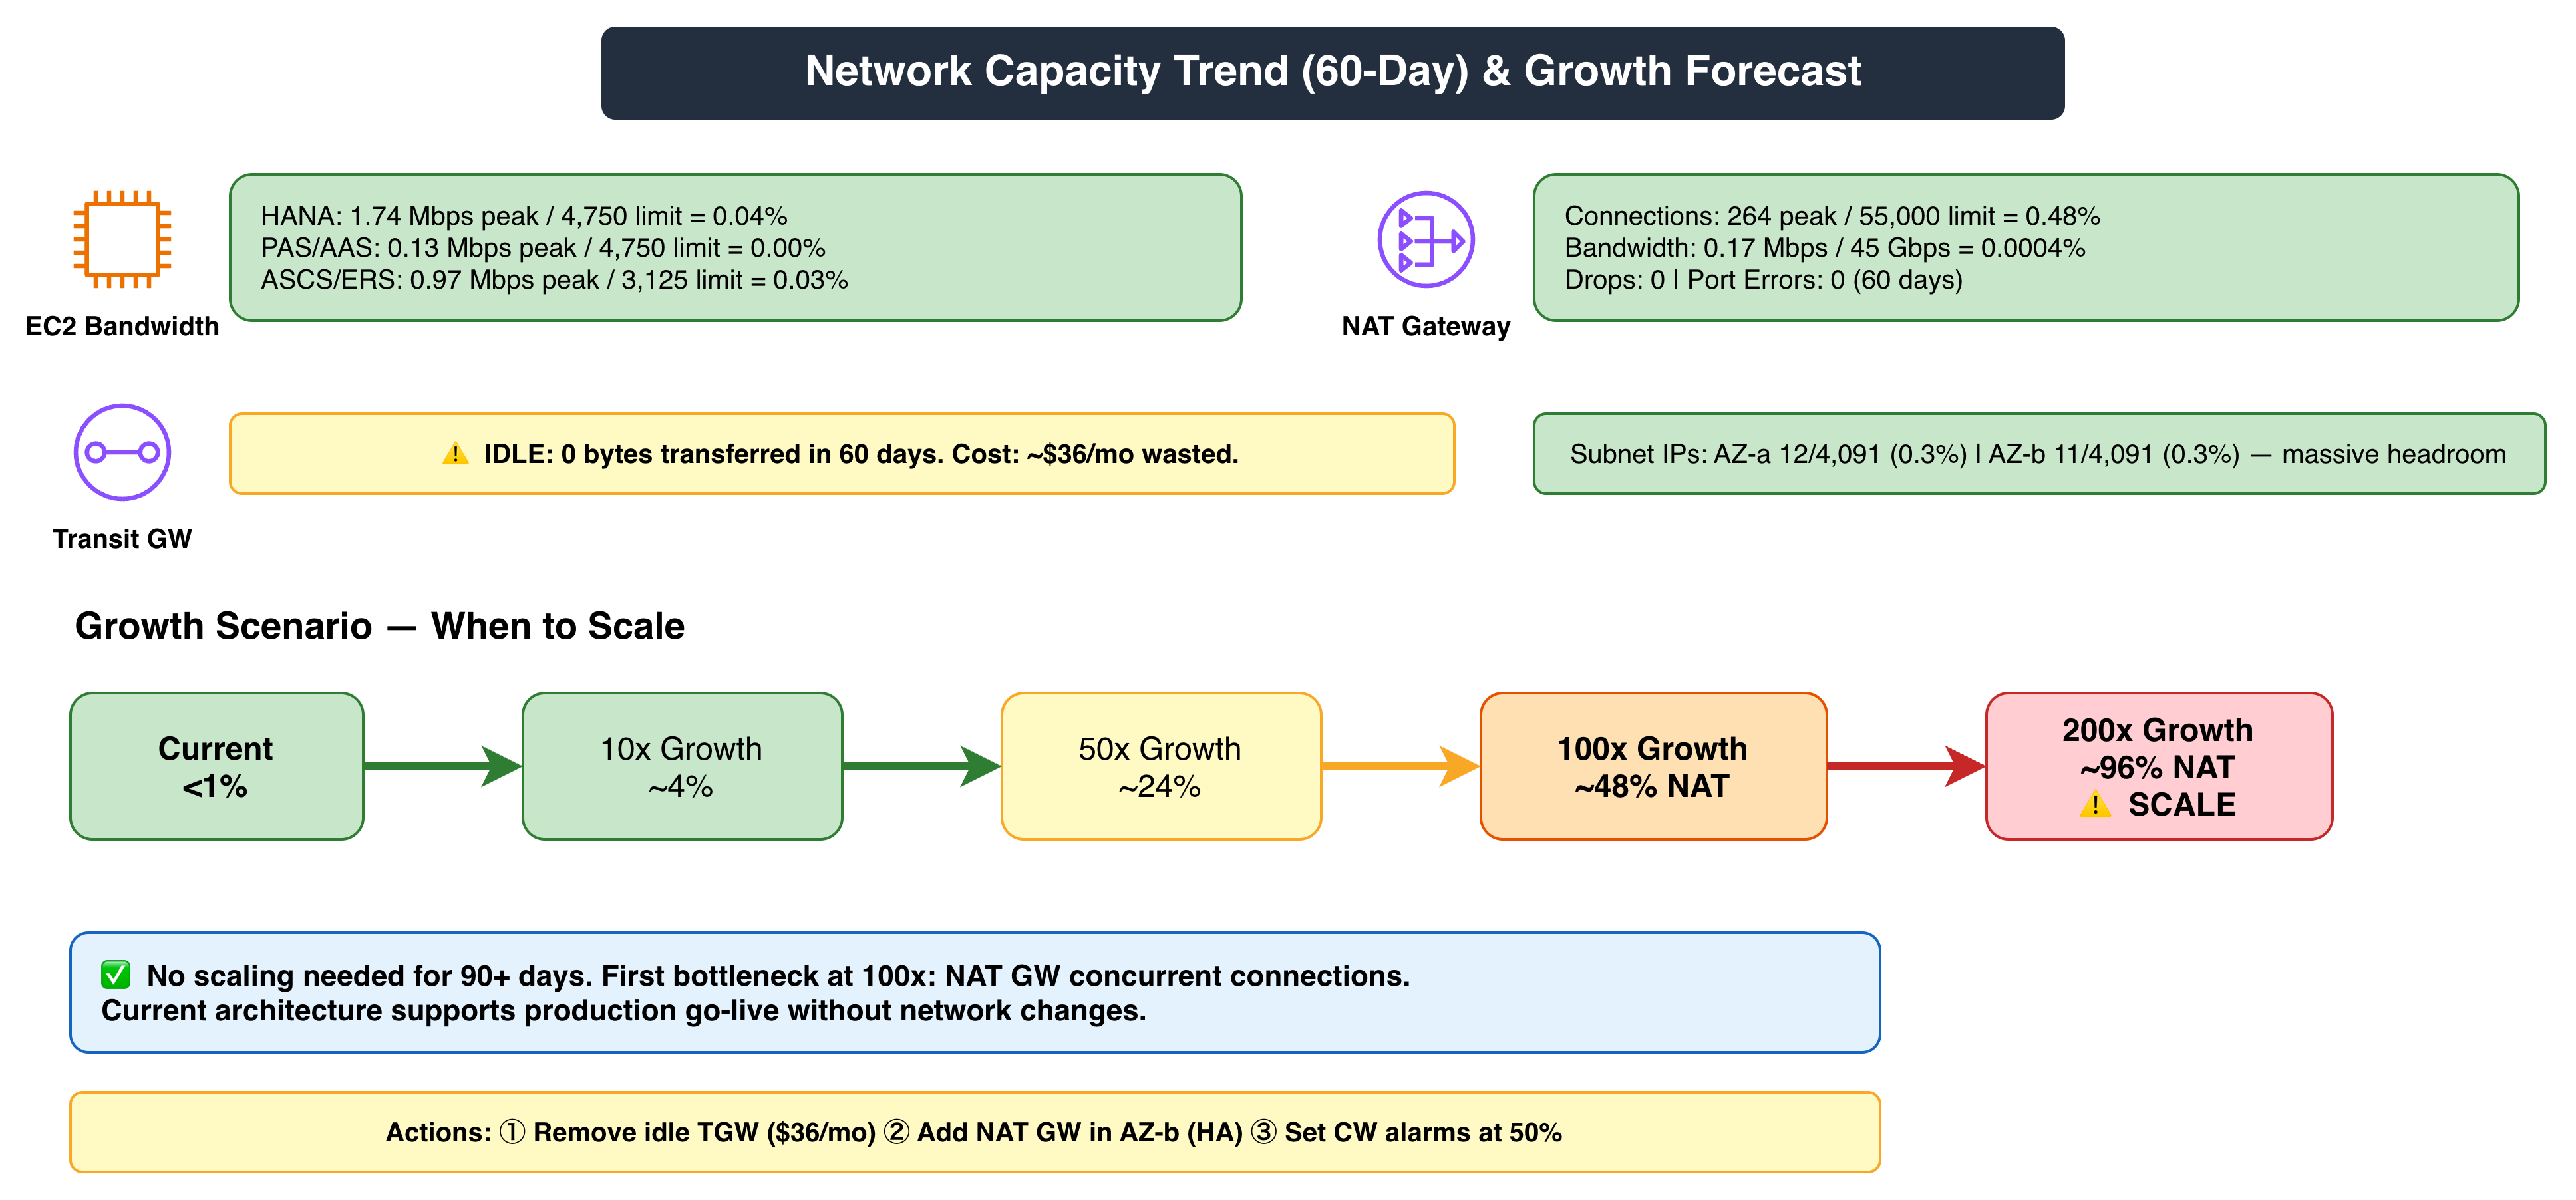
Figure 6. Network Capacity Trend (60-Day) & Forecast with scaling requirements
Cost Considerations
The primary cost drivers are Amazon CloudWatch Logs Insights queries, which are charged per GB scanned, and VPC Flow Log storage. Your spend therefore scales with how much log data you retain and how often you run queries.
Estimated monthly cost by deployment tier
Estimated monthly costs depend on your deployment scale. The following table outlines three representative tiers.
| Tier | Est. Monthly Cost | Profile |
| Basic | $25–$35 | Single VPC, dev/test workloads, low query volume |
| Development | $60–$80 | Multi-AZ SAP landscape, moderate monitoring, occasional use case runs |
| Enterprise | $150–$250 | Multi-VPC production SAP, high-frequency health checks, full use case automation, CloudTrail audit logging |
Use the AWS Pricing Calculator to estimate costs based on your specific VPC Flow Log volume and query frequency.
Conclusion
Kiro-CLI combined with AWS MCP Servers can transform SAP network troubleshooting from hours of fragmented manual work into minutes of natural-language-driven diagnosis. The figures and outputs in this post are illustrative examples from a reference deployment rather than externally benchmarked results, and your own results will vary with landscape size and log volume. Across five real-world use cases, you have seen how this approach delivers:
- Comprehensive network health checks and scoring from a single prompt.
- Systematic root cause analysis for RISE with SAP 504 errors.
- Cross-AZ latency diagnostics benchmarked against SAP Note 1100926 (requiring SAP S* user id) thresholds.
- Definitive security group drift attribution using CloudTrail correlation.
- Proactive 60-day network capacity forecasting with cost-aware recommendations.
Next steps: your implementation roadmap
This section summarises everything you need to go from zero to a working SAP network-troubleshooting setup: the total time to budget, the downloads and documents required, and where to deepen your expertise once you are up and running. Start with the time estimate that follows.
Plan roughly 2–3 hours end-to-end for a first full run; ongoing use takes only minutes per query.
| Phase | Activity | Est. time |
| Setup | Install Kiro-CLI and configure AWS managed MCP Servers | 30–60 min |
| Setup | Enable VPC Flow Logs and CloudWatch log groups on your SAP VPCs | 20–30 min |
| Setup | Apply least-privilege IAM permissions and enable CloudTrail | 15–20 min |
| First run | Run Use Case 1 to establish your baseline network health score | 10–15 min |
| Adoption | Add the remaining use cases (2–5) to your operational runbooks | 30–45 min |
| Ongoing | Per-query diagnosis with natural language prompts | Minutes |
Documents and downloads you’ll need
Gather the following links before you begin. The first three cover installation and configuration; the remainder are reference material for infrastructure, monitoring, thresholds, and cost estimation.
- Kiro-CLI — install guide
- Managed AWS MCP Server (part of Agent Toolkit)
- Enable VPC Flow Logs
- Send VPC Flow Logs to CloudWatch Logs
- Transit Gateway Flow Logs
- Enable AWS CloudTrail
- AWS Launch Wizard for SAP (HA deployment)
- SAP Note 1100926 — latency thresholds (requires SAP S* user id)
- AWS Pricing Calculator — estimate monthly cost
What’s next — dig deeper
Once your baseline is in place, here are five ways to get more value from the same Kiro-CLI and MCP Server foundation.
Operationalise it: wrap your most-used prompts into team runbooks and trigger them automatically after every maintenance window to catch security group drift early.
Automate alerting: set CloudWatch alarms at the 80% utilisation threshold so capacity forecasts turn into proactive scaling tickets.
Expand coverage: extend the same MCP + Kiro-CLI pattern to adjacent domains — IAM, cost, and observability MCP Servers — for a unified natural-language operations console.
Go managed: implement the managed AWS MCP Server for single-endpoint access and built-in CloudTrail auditing at scale.
Credits and Acknowledgements
This blog was developed with contributions from the AWS SAP on AWS team and AWS Network Specialist team. Special thanks to the AWS managed MCP Servers and the Kiro-CLI product team for their support.