AWS Big Data Blog
Building high-quality benchmark tests for Amazon Redshift using Apache JMeter
Updated April 2021 to offer more Apache JMeter tips, and highlight some capabilities in the newer version of Apache JMeter.
In the introductory post of this series, we discussed benchmarking benefits and best practices common across different open-source benchmarking tools. As a reminder of why benchmarking is important, Amazon Redshift allows you to scale storage and compute independently, and for you to choose an appropriately balanced compute layer, you need to profile the compute requirements of various production workloads. Existing Amazon Redshift customers also desire an approach to scale up with eyes wide open, and benchmarking different Amazon Redshift cluster configurations against various production workloads can help you appropriately accommodate workload expansion. In addition, you may also use benchmark tests to proactively monitor a production cluster’s performance in real time.
For prospective Amazon Redshift customers, benchmarking Amazon Redshift is often one of the main components of evaluation and a key source of insight into the price-to-performance ratio of different Amazon Redshift configurations.
Open-source tools, with their cost-efficiency and vendor neutrality, are often the preferred choice for profiling your production workloads and benchmark tests. However, best practices for using these tools are scarce, possibly resulting in flawed compute profiles, flawed benchmark results, customer frustration, or bloated timelines.
As mentioned, this series is divided into multiple installments, with the first installment discussing general best practices for benchmarking, and the subsequent installments discussing the strengths and challenges with different open-source tools such as SQLWorkbench, psql, and Apache JMeter. In this post, we discuss benchmarking Amazon Redshift with the Apache JMeter open-source tool.
One final point before we get started: there is a lot that could be said about benchmarking—more than can be accommodated in a single post. Analytics Specialists Solutions Architects such as myself frequently and happily engage with current and prospective customers to help you evaluate your benchmarking strategy and approach at no charge. I highly recommend you take advantage of that benefit by reaching out to your AWS account SA.
Apache JMeter
Apache JMeter is an open-source load testing application written in Java that you can use to load test web applications, backend server applications, databases, and more. You can run it on Windows and a number of different Linux/UNIX systems; for this post we run it in a Windows environment. To install Apache JMeter on a Windows EC2 machine, complete the following steps:
- Launch a Windows EC2 instance using a Windows Server AMI (such as Microsoft Windows Server 2019 Base).
- Connect via RDP to the Windows EC2 Instance (RDP for macOS can be downloaded from Apple’s App Store).
- Download and unzip the Apache JMeter .zip file from the Apache JMeter download page.
- Download the Redshift JDBC driver and add the driver .jar file to JMeter’s
/libWhen setting up the JDBC connection in the JMeter GUI, usecom.amazon.redshift.jdbc.Driveras the driver class name). - Download the Apache Plugins Manager .jar file to JMeter’s
/lib/extThe Apache Plugins Manager enables additional crucial functionality in Apache JMeter for benchmark testing (such as Ultimate Thread Group). - Increase the JVM heap size for Apache JMeter by changing the corresponding JVM parameters in the
jmeter.batfile located in the Apache JMeter/binfolder. For example, see the following code:
- Choose the
jmeter.batfile (double-click) to start Apache JMeter.
Apache JMeter supports both GUI and CLI modes, and although you may find the Apache JMeter GUI straightforward with a relatively small learning curve, it’s highly recommended that you use the Apache JMeter GUI primarily for defining benchmark tests, and perhaps running small-to-medium-sized benchmark tests. For large load tests, it’s highly recommended that you use the Apache JMeter CLI to minimize the risk of the Apache JMeter GUI exhausting its host’s compute resources, causing it to enter a non-responsive state or fail with an out-of-memory error. Using the CLI for large load tests also helps minimize any impact on the benchmark results.
In the following example, I demonstrate creating a straightforward load test using both the Apache JMeter GUI and CLI. The load test aims to measure query throughput while simulating 50 concurrent users with the following personas:
- 20 users submit only small queries, which are of low complexity and typically have a runtime of 0–30 seconds in the current system, such as business intelligence analyst queries
- 20 users submit only medium queries, which are of moderate complexity and typically have a runtime of 31–300 seconds in the current system, such as data engineer queries
- 10 users submit only large queries, which are very complex and typically have a runtime over 5 minutes in the current system, such as data scientist queries
The load test is configured to run for 15 minutes, which is a pretty short test duration, so you can increase that setting to 30 minutes or more. We rely on JMeter’s query throughput calculation, but we can also manually compute query throughput from the runtime metadata that is gathered if we so desire.
For this post, I skip over discussing the possible Amazon Redshift cluster tweaks that you could use to squeeze every drop of performance out of Amazon Redshift, and instead rely on the strength of its default state to be optimized to achieve excellent query throughput on diverse workloads.
Apache JMeter has a number of building blocks, such as thread groups, that can be used to define a wide variety of benchmark tests, and each building block can have a number of community implementations (for example, Arrivals Thread Group or Ultimate Thread Group).
The following diagram provides a basic illustration of the various Apache JMeter building blocks to be leveraged in this load test, how they interact with each other, and the typical order in which are they created; in some cases, I mention the specific implementation of the building block to be used in parenthesis (such as Ultimate Thread Group).
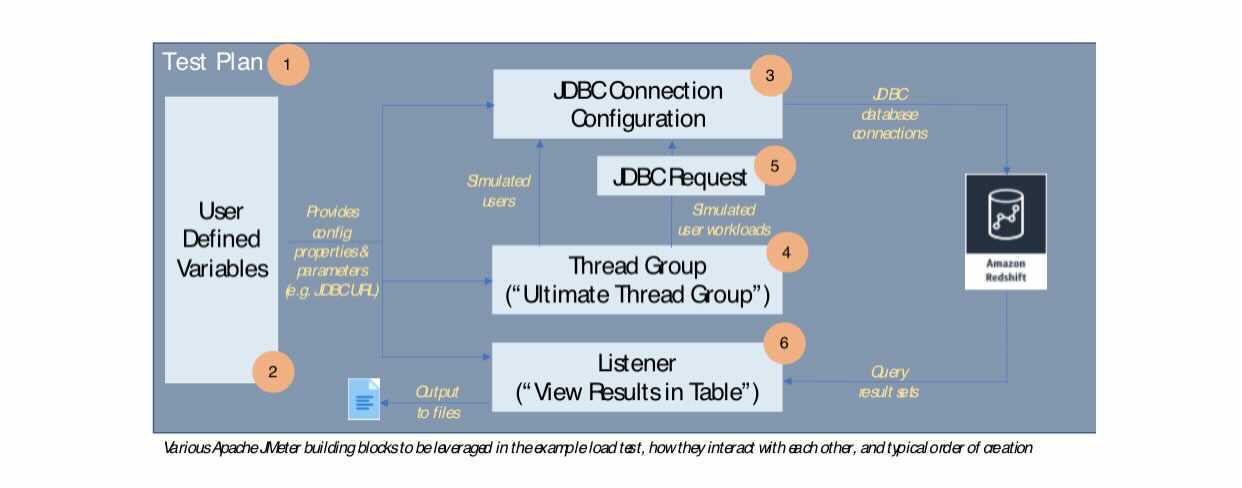
The following table delves deeper into the purpose that each building block serves in our load test.
| Apache JMeter Component | Purpose |
| Test Plan | Represents an atomic test case (simulate 50 users concurrently querying a Redshift cluster with twice the baseline node count) |
| JDBC Connection Configuration | Represents all the JDBC information needed to connect to the Amazon Redshift cluster (such as JDBC URL, username, and password) |
| User Defined Variables | A collection of key-value pairs that can be used as parameters throughout the test plan and make it easier to maintain or change the test behavior |
| Listener | Captures and displays or writes test output such as SQL result sets |
| Thread Group | A simulated group of users that perform the test function (submit a SQL query) |
| JDBC Request | The action to be taken by the simulated users (SQL query text) |
Apache JMeter (GUI)
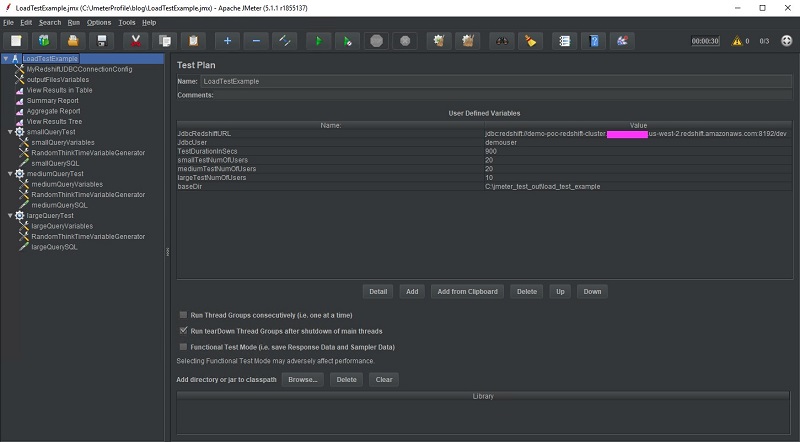
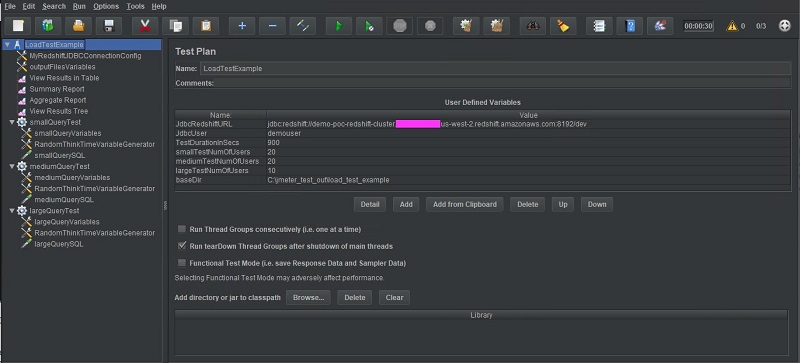
The following screenshot is the resulting load test.
The following screenshot provides a close up of the building block tree.
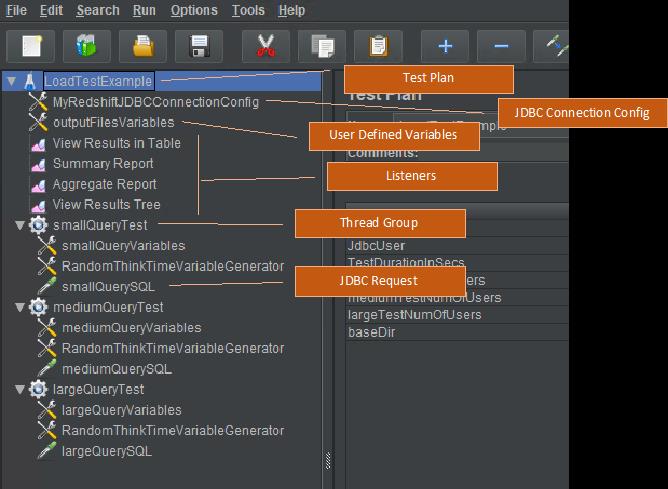
In the following sections, we examine each building block in greater detail.
Test Plan
The test plan serves as the parent container for our entire benchmark test, and we can change its name in the visual tree that appears in the Apache JMeter GUI by editing the Name field.
I take advantage of the User Defined Variables section to set my own custom variables that hold values needed by all components in the test case, such as the JDBC URL, test duration, and number of users submitting small, medium, and large queries. The baseDir variable is actually a variable that is intended to be embedded in other variables, rather than directly referenced by other test components. I left all other settings at their default on this page.
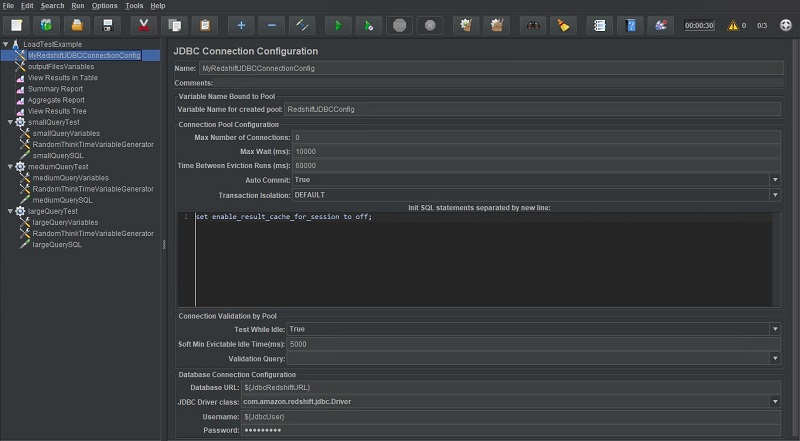
JDBC Connection Configuration
We use the JDBC Connection Configuration building block to create a database connection pool that is used by the simulated users to submit queries to Amazon Redshift. The value specified in Variable Name for created pool is the identifier that is used to reference this connection pool in other JMeter building blocks. In this example, I named it RedshiftJDBCConfig.
By setting the Max Number of Connections to 0, the connection pool can grow as large as it needs to, which I have often found to be the best option. Alternatively, setting Max Number of Connections to the desired number of threads, doesn’t guarantee that a thread will always use the same connection which could result in unpredictable behavior for stateful queries or test scenarios involving multiple users. For example, without a thread consistently using the same connection, errors could result with end-to-end ETL test chains that rely on temp tables for best performance, or BI workloads that automatically split report creation into multiple steps. Be sure to set it as you see fit with this in mind.
In the Init SQL statements section, I provide an example of how to use SQL to disable the result set cache in Amazon Redshift for every connection created, or perform other similar initialization code.
Towards the end, I input the database JDBC URL (which is actually a variable reference to a variable defined in the test plan), JDBC driver class name, and database username and password. I left all other fields at their default on this page.
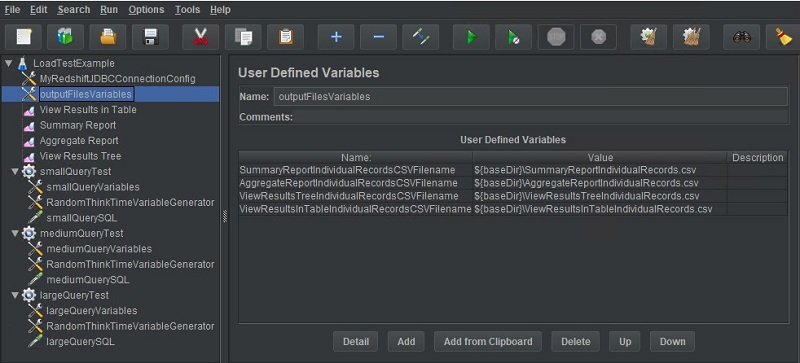
User Defined Variables
You can add a User Defined Variables building block in several places, and it’s best to use this capability to limit the scope of each variable. For this post, we use an instance of the User Defined Variables building block to hold the output file names of each listener in this test plan (if you look closely, you can see the values of these variables reference the baseDir variable, which was defined in our test plan). You can also notice three other instances of the User Defined Variables building block for the small, medium, and large thread groups—again so that the scope of variables is kept appropriately narrow.
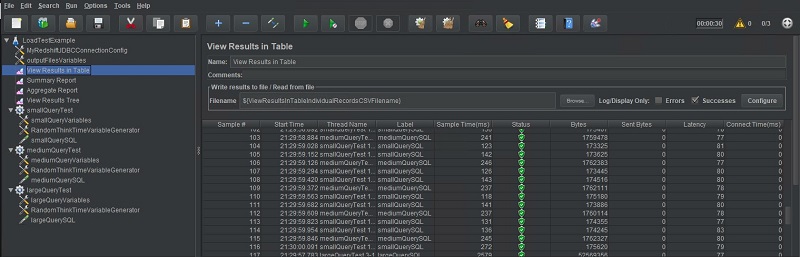
Listeners
Listeners control where test output is written and how it’s processed. There are many different kinds of listeners that, for example, allow you to capture your test output as a tree, table, or graph. Other listeners can summarize and aggregate test metadata (such as the number of test samples submitted during the test). I choose to add several listeners in this test plan just for demonstration, but I have found the listeners Aggregate Report and View Results in Table to be most helpful to me. The following screenshot shows the View Results in Table output.
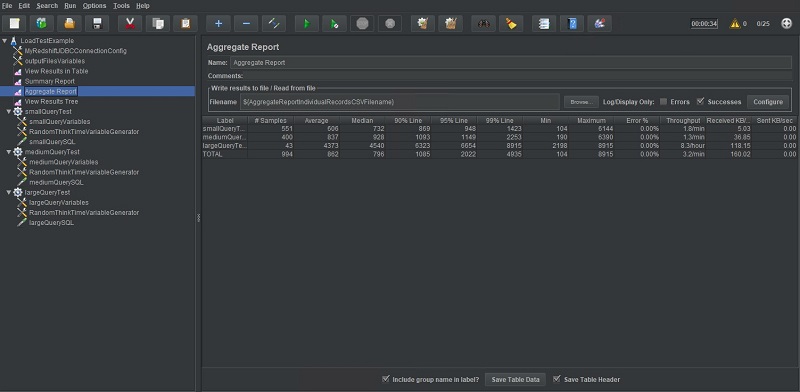
The following screenshot shows the Aggregate Report output.
You can also save output from listeners after a test run to a different file through the JMeter menu.
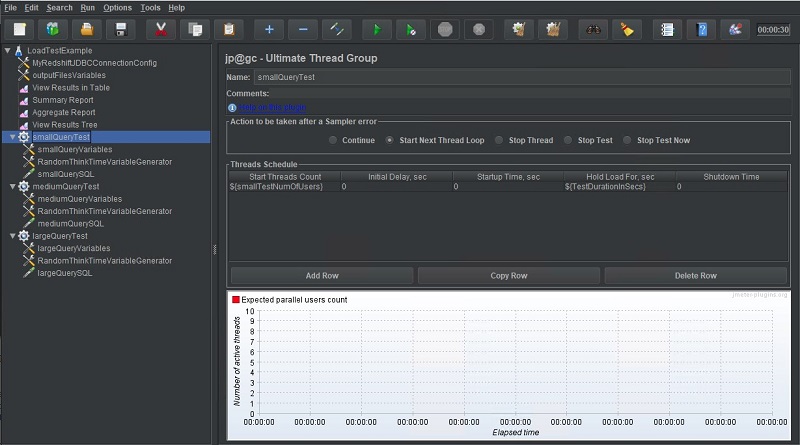
Thread group: Ultimate Thread Group
A thread group can be thought of as a group of simulated users, which is why for this post, I create three separate thread groups: one to represent each of three previously mentioned user personas being simulated (small, medium, and large). Each thread group is named accordingly.
We use the Thread Schedule section to control how many users should be created and at what time interval. In this test, I chose to have all 20 small users created at start time without any delays. This is achieved by a one-row entry in the Thread Schedule and setting the Start Threads Count thread group property to 20 users (or the matching variable, as we do in the following screenshot).
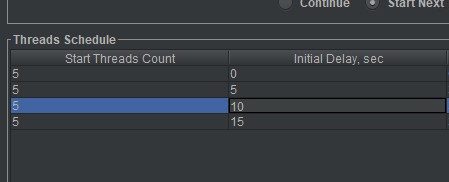
Alternatively, I could stagger user creation by creating multiple rows and setting the Initial Delay sec field to control each row’s startup delay. With the row entries in the following screenshot, an additional five users are created every 5 seconds.
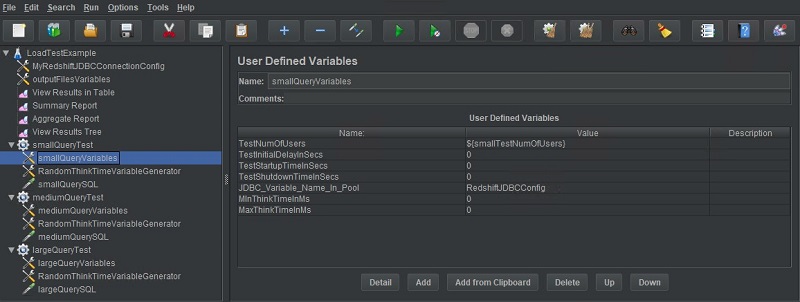
Thread group: User Defined Variables
An additional User Defined Variables instance is added to each of the three thread groups to hold the variables in their individual scope, or that would preferably be configurable at an individual thread group level. For this post, I make the JDBC Connection Configuration a variable so that it’s customizable for each individual thread group (JDBC_Variable_Name_In_Pool). This allows me to, for example, rapidly switch two different test clusters.
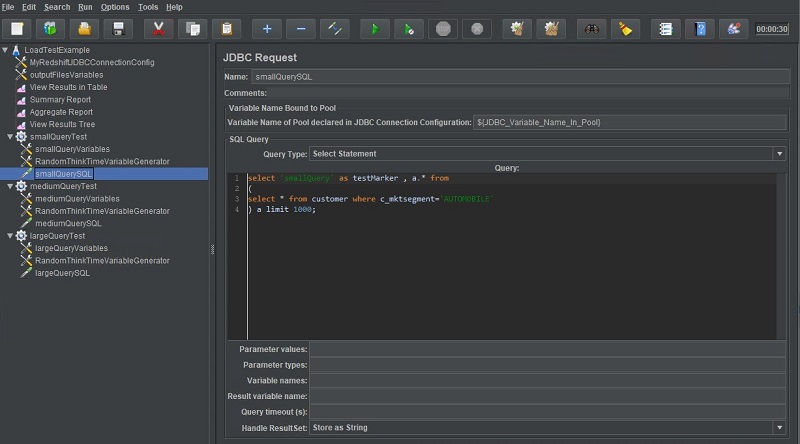
JDBC Request
The JDBC Request can be thought of as the benchmark query or SQL test query to be submitted non-stop by each simulated user in this thread group. To configure this JDBC Request, I specified the appropriate JDBC Connection Configuration and some very simple test SQL. I could have also used Apache JMeter’s ability to parameterize queries so that they vary from one iteration to another using a predetermined set of parameter values. For example, for the SQL statement select * from customer where cust_id=<some value>, Apache JMeter could be configured to set the value in the filter clause to a randomly chosen value from a pre-compiled list of filter values for each sample submission. I left all other settings at their default.
Apache JMeter (CLI)
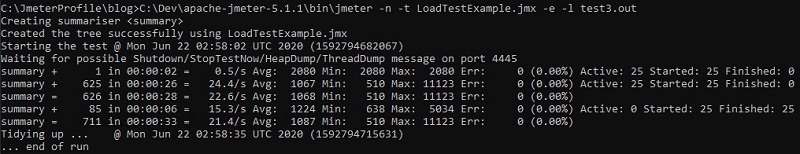
The Apache JMeter GUI saves test plans in .jmx files that can be used to run the same test plan in Apache JMeter’s console mode. The following CLI command demonstrates how you can use the LoadTestExample.jmx file that was created in the previous steps using the GUI to run the same load test:
It is also possible to create .jmx files that accept runtime parameters through the command line. This helps avoid having to maintain multiple versions of the same .jmx file with different runtime settings. For example, instead of maintaining test1_50users.jmx and test1_100users.jmx files, a single test1.jmx file could be maintained and the concurrency setting of 50 or 100 could be passed in through the command line. The sample output is from a 30-second run of LoadTestExample.jmx.
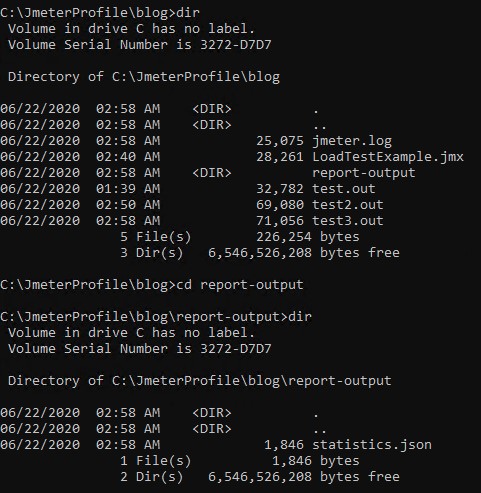
After the test has completed, several output files are created, such as a JMeter application log, query output files from the listeners (if any), and test statistics from listeners (if any). For this post, the statistical metrics captured for the test run are located in a JSON file inside the report-output directory. See the following screenshot.
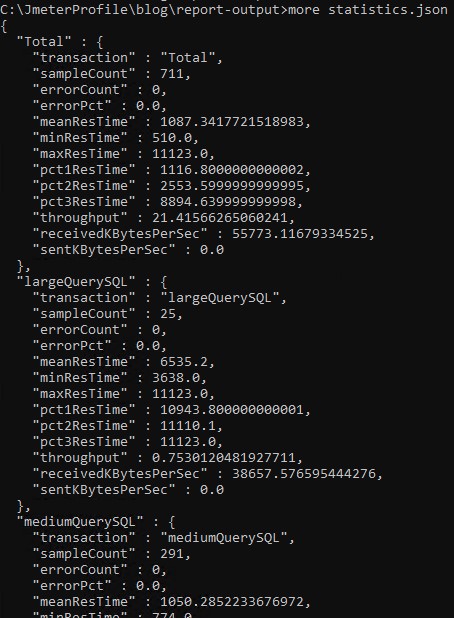
The \report-output\statistics.json file captures a lot of useful metrics, such as the total samples (like SQL queries) submitted during the test duration, achieved query throughput, and number of small, medium, and large queries and their individual throughput. The following screenshot shows a sampling of the data from statistics.json.
Conclusion
In this series of posts, we discussed several recommended best practices for conducting high-quality benchmark tests. Some of the best practices represented core principles that span all the open-source tools discussed (such as consistency in testing methodology). In this particular post, we reviewed the strengths and appropriateness of Apache JMeter for conducting benchmark tests. I hope this series has been helpful, and strongly encourage current and prospective customers to reach out to me or other AWS colleagues if you wish to delve deeper.
About the Author
 Asser Moustafa is an Analytics Specialist Solutions Architect at AWS based out of Dallas, Texas. He advises customers in the Americas on their Amazon Redshift and data lake architectures and migrations, starting from the POC stage to actual production deployment and maintenance