AWS Business Intelligence Blog
How The Mill Adventure enabled data-driven decision-making in iGaming using Amazon QuickSight
| All your trusted BI capabilities of Amazon QuickSight now come with powerful new AI features that integrate chat agents, deep research, and automation in one seamless experience with Amazon Quick Suite! Learn more » |
This post is co-written with Darren Demicoli from The Mill Adventure.
The Mill Adventure is an iGaming industry enabler offering customizable turnkey solutions to B2B partners and custom branding enablement for its B2C partners. They provide a complete gaming platform, including licenses and operations, for rapid deployment and success in iGaming, and are committed to improving the iGaming experience by being a differentiator through innovation. The Mill Adventure already provides its services to a number of iGaming brands and seeks to continuously grow through the ranks of the industry.
In this post, we show how The Mill Adventure is helping its partners answer business-critical iGaming questions by building a data analytics application using modern data strategy using AWS. This modern data strategy approach has led to high velocity innovation while lowering the total operating cost.
With a gross market revenue exceeding $70 billion and a global player base of around 3 billion players (per a recent imarc Market Overview 2022-2027), the iGaming industry has, without a doubt, been booming over the past few years. This presents a lucrative opportunity to an ever-growing list of businesses seeking to tap into the market and attract a bigger share as their audience. Needless to say, staying competitive in this somewhat saturated market is extremely challenging. Making data-driven decisions is critical to the growth and success of iGaming businesses.
Business challenges
Gaming companies typically generate a massive amount of data, which could potentially enable meaningful insights and answer business-critical questions. Some of the critical and common business challenges in iGaming industry are:
- What impacts the brand’s turnover—its new players, retained players, or a mix of both?
- How to assess the effectiveness of a marketing campaign? Should a campaign be reinstated? Which games to promote via campaigns?
- Which affiliates drive quality players that have better conversion rates? Which paid traffic channels should be discontinued?
- For how long does the typical player stay active within a brand? What is the lifetime deposit from a player?
- How to improve the registration to first deposit processes? What are the most pressing issues impacting player conversion?
Though sufficient data was captured, The Mill Adventure found two key challenges in their ability to generate actionable insights:
- Lack of analysis-ready datasets (not raw and unusable data formats)
- Lack of timely access to business-critical data
For example, The Mill Adventure generates over 50 GB of data daily. Its partners have access to this data. However, due to the data being in a raw form, they find it of little value in answering their business-critical questions. This affects their decision-making processes.
To address these challenges, The Mill Adventure chose to build a modern data platform on AWS that was not only capable of providing timely and meaningful business insights for the iGaming industry, but also efficiently manageable, low-cost, scalable, and secure.
Modern data architecture
The Mill Adventure wanted to build a data analytics platform using a modern data strategy that would grow as the company grows. Key tenets of this modern data strategy are:
- Build a modern business application and store data in the cloud
- Unify data from different application sources into a common data lake, preferably in its native format or in an open file format
- Innovate using analytics and machine learning, with an overarching need to meet security and governance compliance requirements
A modern data architecture on AWS applies these tenets. Two key features that form the basic foundation of a modern data architecture on AWS are serverless and microservices.
The Mill Adventure solution
The Mill Adventure built a serverless iGaming data analytics platform that allows its partners to have quick and easy access to a dashboard with data visualizations driven by the varied sources of gaming data, including real-time streaming data. With this platform, stakeholders can use data to devise strategies and plan for future growth based on past performance, evaluate outcomes, and respond to market events with more agility. Having the capability to access insightful information in a timely manner and respond promptly has substantial impact on the turnover and revenue of the business.
A serverless iGaming platform on AWS
In building the iGaming platform, The Mill Adventure was quick to recognize the benefits of having a serverless microservice infrastructure. We wanted to spend time on innovating and building new applications, not managing infrastructure. AWS services such as Amazon API Gateway, AWS Lambda, Amazon DynamoDB, Amazon Kinesis Data Streams, Amazon Simple Storage Service (Amazon S3), Amazon Athena, and Amazon QuickSight are at the core of this data platform solution. Moving to AWS serverless services has saved time, reduced cost, and improved productivity. A microservice architecture has enabled us to accelerate time to value, increase innovation speed, and reduce the need to re-platform, refactor, and rearchitect in the future.
The following diagram illustrates the data flow from the gaming platform to QuickSight.

The data flow includes the following steps:
- As players access the gaming portal, associated business functions such as gaming activity, payment, bonus, accounts management, and session management capture the relevant player actions.
- Each business function has a corresponding Lambda-based microservice that handles the ingestion of the data from that business function. For example, the Session service handles player session management. The Payment service handles player funds, including deposits and withdrawals from player wallets. Each microservice stores data locally in DynamoDB and manages the create, read, update, and delete (CRUD) tasks for the data. For event sourcing implementation details, see How The Mill Adventure Implemented Event Sourcing at Scale Using DynamoDB.
- Data records resulting from the CRUD outputs are written in real time to Kinesis Data Streams, which forms the primary data source for the analytics dashboards of the platform.
- Amazon S3 forms the underlying storage for data in Kinesis Data Streams and forms the internal real-time data lake containing raw data.
- The raw data is transformed and optimized through custom-built extract, transform, and load (ETL) pipelines and stored in a different S3 bucket in the data lake.
- Both raw and processed data are immediately available for querying via Athena and QuickSight.
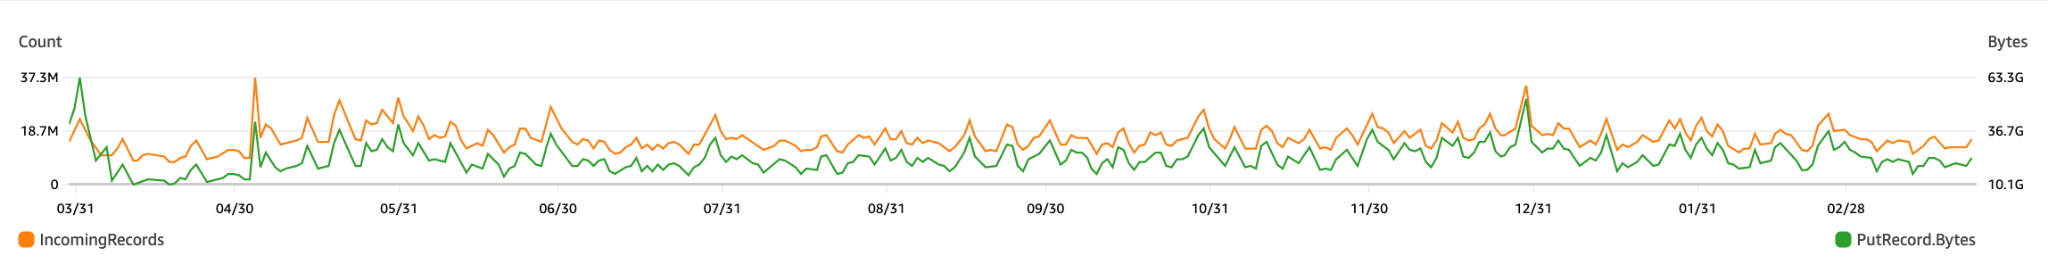
Raw data is transformed, optimized, and stored as processed data using an hourly data pipeline to meet analytics and business intelligence needs. The following figure shows an example of record counts and the size of the data being written into Kinesis Data Streams, which eventually needs to be processed from the data lake.
These data pipeline jobs can be broadly classified into six main stages:
- Cleanup – Filtering out invalid records
- Deduplicate – Removing duplicate data records
- Aggregate at various levels – Grouping data at various aggregation levels of interest (such as per player, per session, or per hour or day)
- Optimize – Writing files to Amazon S3 in optimized Parquet format
- Report – Triggering connectors with updated data (such as updates to affiliate providers and compliance)
- Ingest – Triggering an event to ingest data in QuickSight for analytics and visualizations
The output of this data pipeline is two-fold:
- A transformed data lake that is designed and optimized for fast query performance
- A refreshed view of data for all QuickSight dashboards and analyses
Cultivating a data-driven mindset with QuickSight
The Mill Adventure’s partners access their data securely via QuickSight datasets. These datasets are purposefully curated views on top of the transformed data lake. Each partner can access and visualize their data immediately. With QuickSight, partners can build useful dashboards without having deep technical knowledge or familiarity with the internal structure of the data. This approach significantly reduces the time and effort required and speeds up access to valuable gaming insights for business decision-making.
The Mill Adventure also provides each partner with a set of readily available dashboards. These dashboards are built on the years of experience that The Mill Adventure has in the iGaming industry, cover the most common business intelligence requirements, and jumpstart a data-driven mindset.
In the following sections, we provide a high-level overview of some of The Mill Adventure iGaming dashboard features and how these are used to meet the iGaming business analytics needs.
Key performance indicators
This analysis provides a comprehensive set of iGaming key performance indicators (KPIs) across different functional areas, including but not limited to payment activity (deposits and withdrawals), game activity (bets, gross game wins, return to player) and conversion metrics (active customers, active players, unique depositing customers, newly registered customers, new depositing customers, first-time depositors). These are presented concisely in both a quantitative view and in more visual forms.
In the following example KPI report, we can see how by presenting different iGaming metrics for key periods and lifetime, we can identify the overall performance of the brand.

Affiliates analysis
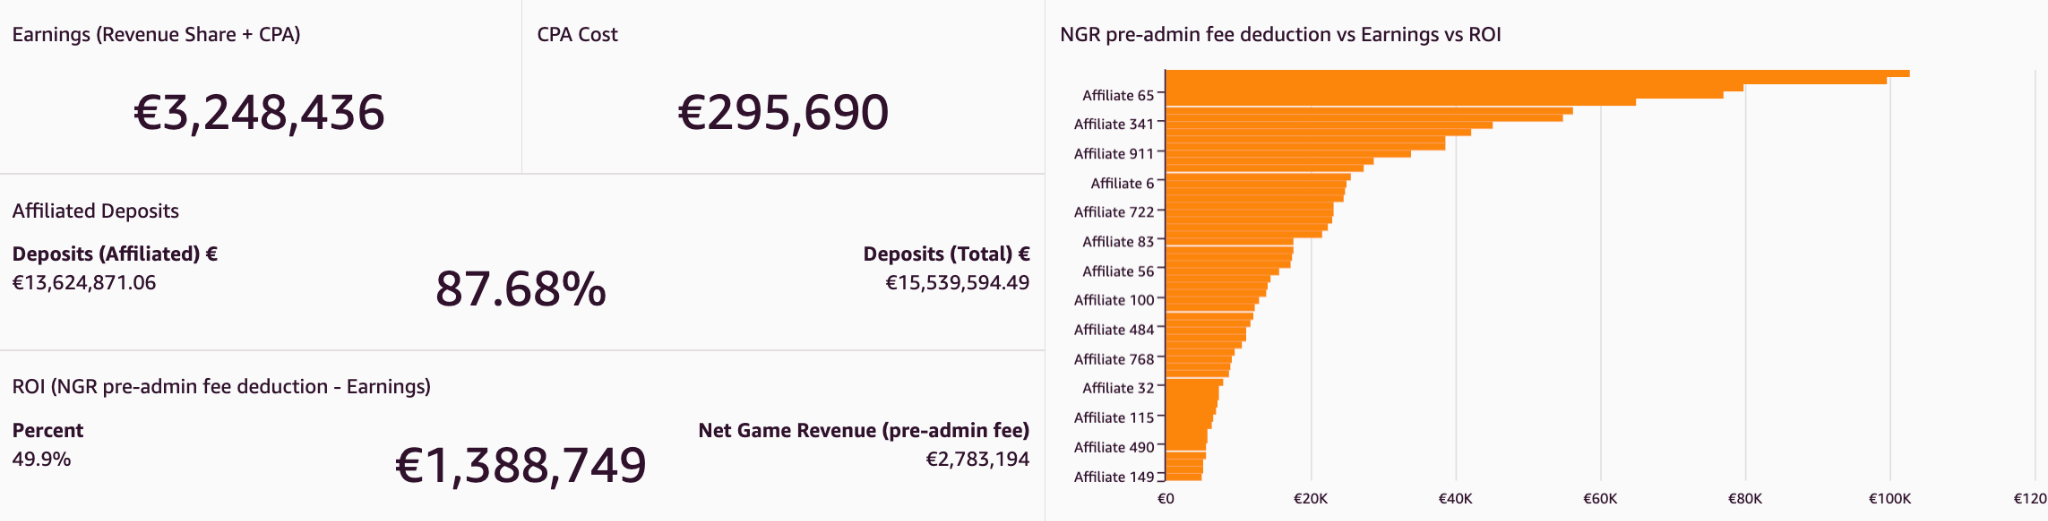
This analysis presents metrics related to the activity generated by players acquired through affiliates. Affiliates usually account for a large share of the traffic driven to gaming sites, and such a report helps identify the most effective affiliates. It informs performance trends per affiliate and compares across different affiliates. By combining data from multiple sources via QuickSight cross-data source joins, affiliate provider-related data such as earnings and clicks can be presented together with other key gaming platform metrics. By having these metrics broken down by affiliate, we can determine which affiliates contribute the most to the brand, as shown in the following example figure.
Cohort analysis
Cohort analyses track the progression of KPIs (such as average deposits) over a period of time for groups of players after their first deposit day. In the following figure, the average deposits per user (ADPU) is presented for players registering in different quarters within the last 2 years. By moving horizontally along each row on the graph, we can see how the ADPU changes for successive quarters for the same group of players. In the following example, the ADPU decreases substantially, indicating higher player churn.
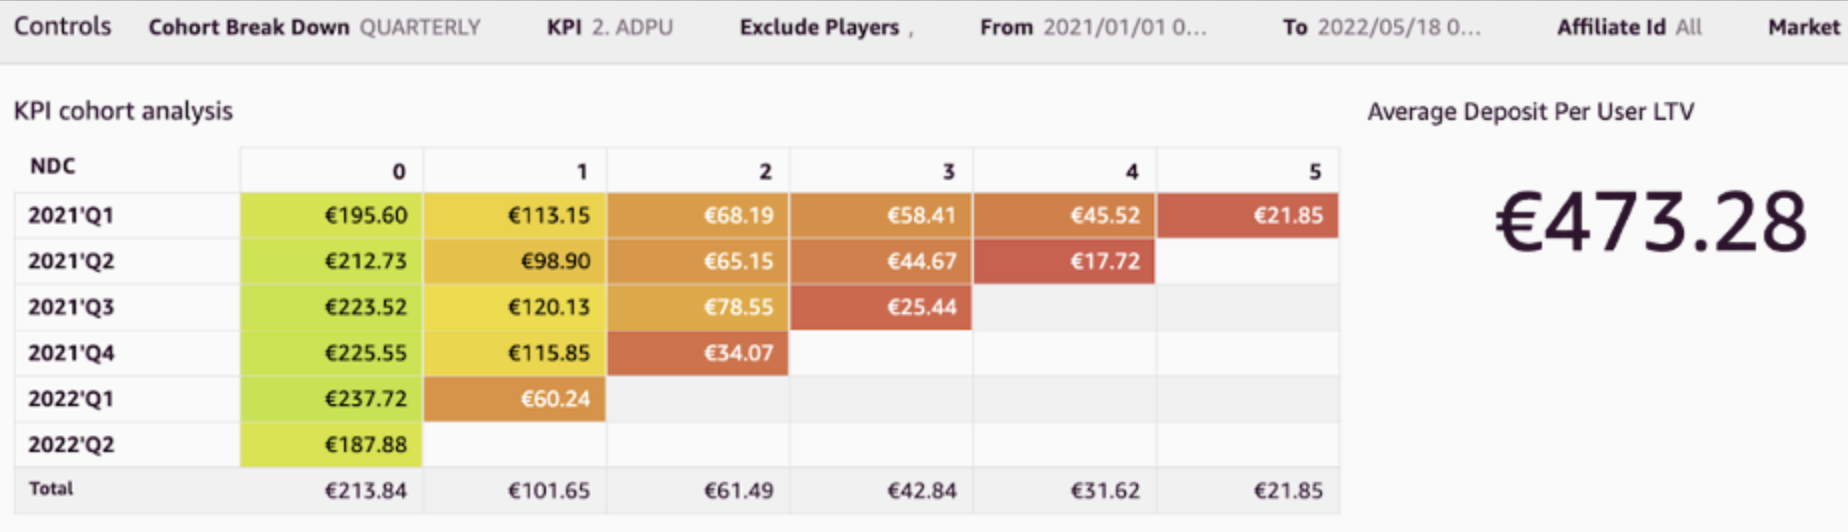
We can use cohort analyses to calculate the churn rate (rate of players who become inactive). Additionally, by averaging the ADPU figures from this analysis, you can extract the lifetime value (LTV) of the ADPU. This shows the average deposit that can be expected to be deposited by players over their lifetime with the brand.
Player onboarding journey
Player onboarding is not a single-step process. In particular, jurisdictional requirements impose a number of compliance checks that need to be fulfilled along various stages during registration flow. All these, plus other steps along the registration (such as email verification), could pose potential pitfalls for players, leading them to fail to complete registration. Showing these steps in QuickSight funnel visuals helps identify such issues and pinpoint any bottlenecks in such flows, as shown in the following example. Additionally, Sankey visuals are used to monitor player movement across registration steps, identifying steps that need to be optimized.

Campaign outcome analysis
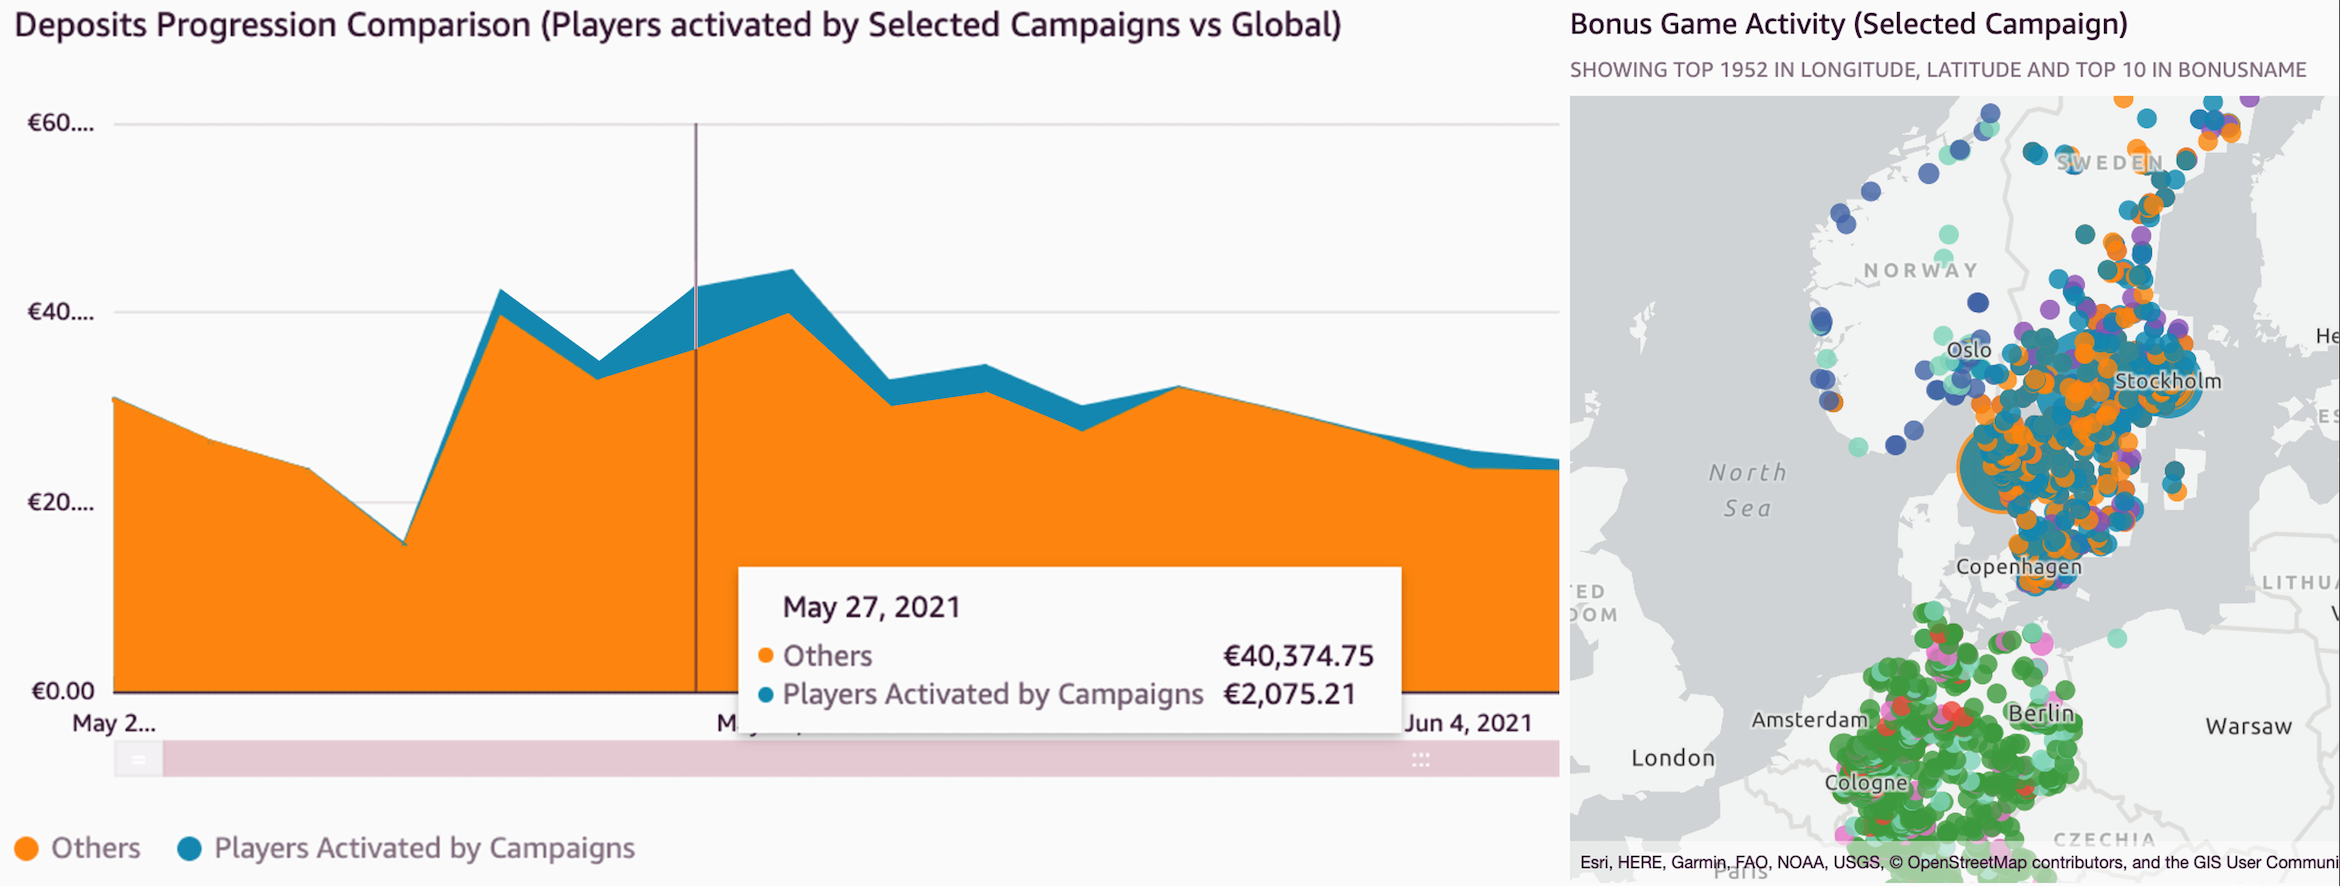
Bonus campaigns are a valuable promotional technique used to reward players and boost engagement. Campaigns can drive turnover and revenue, but there is always an inherent cost associated. It’s critical to assess the performance of campaigns and determine the net outcome. We have built a specific analysis to simplify the task of evaluating these promotions. A number of key metrics related to players activated by campaigns are available. These include both monetary incentives for game activity and deposits and other details related to player demographics (such as country, age group, gender, and channel). Individual campaign performance is analyzed and high-performance ones are identified.
In the following example, the figure on the left shows a time series distribution of deposits coming from campaigns in comparison to the global ones. The figure on the right shows a geographic plot of players activated from selected campaigns.
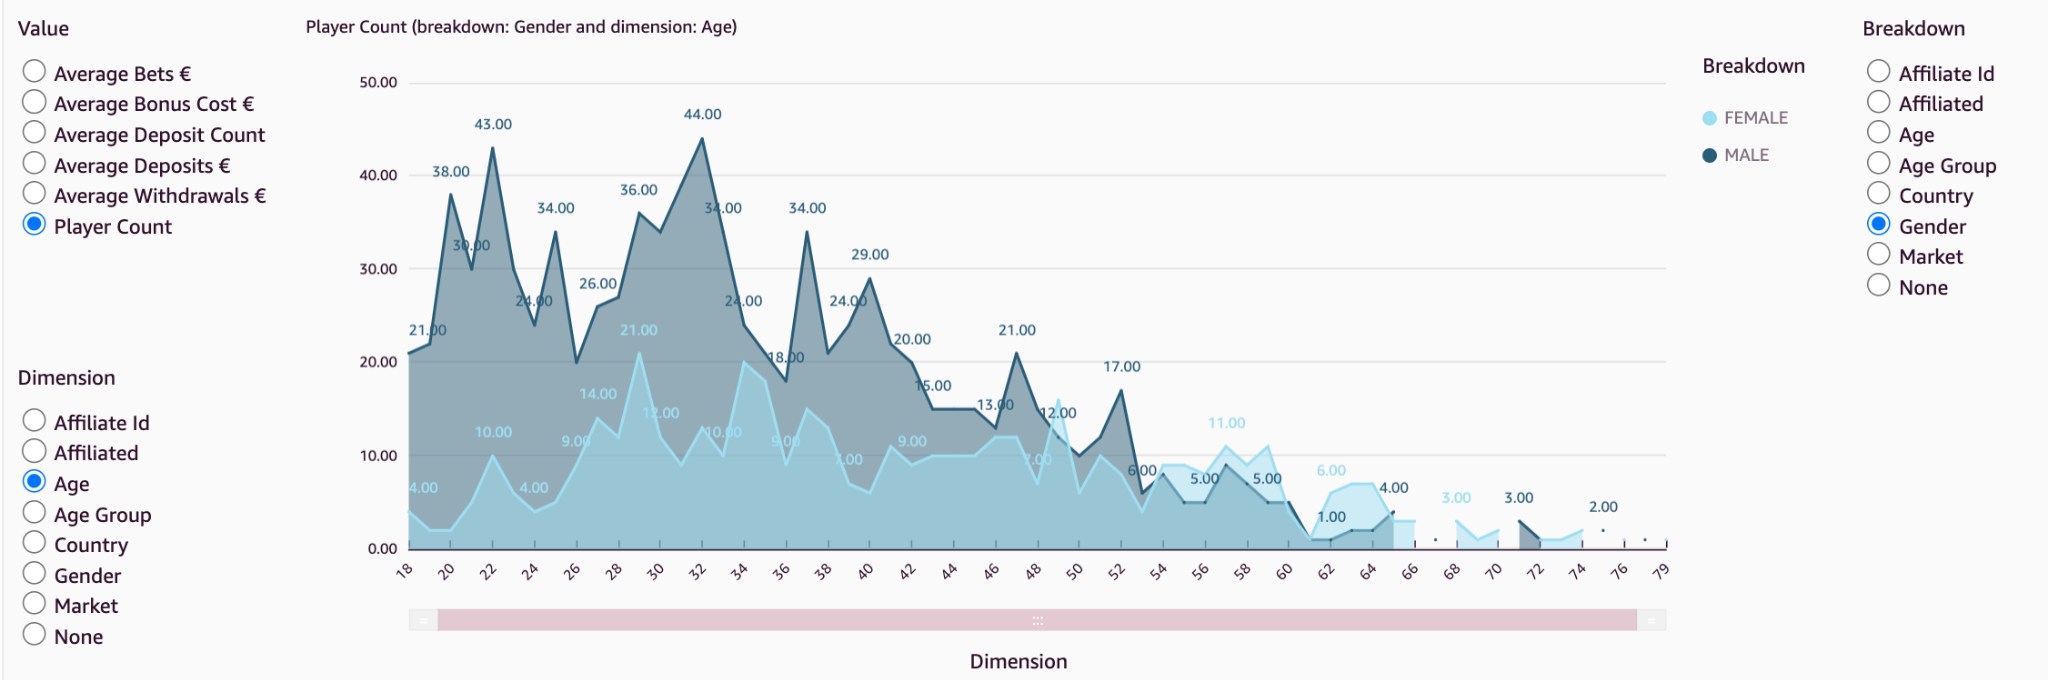
Demographics distribution analysis
Brands may seek to improve player engagement and retention by tailoring their content for their player base. They need to collect and understand information about their players’ demographics. Players’ demographic distribution varies from brand to brand, and the outcome of actions taken on different brands will vary due to this distribution. Keeping an eye on this demographic (age, country, gender) distribution helps shape a brand strategy in the best way that suits the player base and helps choose the right promotions that appeal most to its audience.
Through visuals such as the following example, it’s possible to quickly analyze the distribution of the selected metric along different demographic categories.
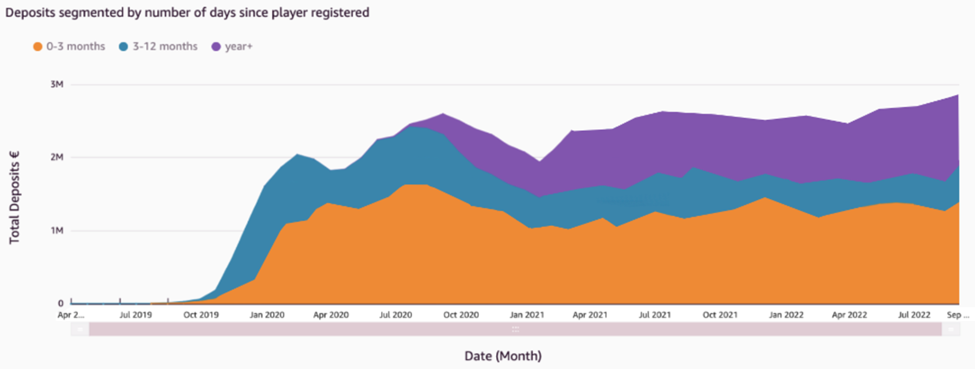
In addition, grouping players by the number of days since registration indicates which players are making a higher contribution to revenue, whether it is existing players or newly registered players. In the following figure, we can see that players who registered in the last 3 months continually account for the highest contribution to deposits. In addition, the proportion of deposits coming from the other two bands of players isn’t increasing, indicating an issue with player retention.
Compliance and responsible gaming
The Mill Adventure treats player protection with the utmost priority. Each iGaming regulated market has its own rules that need to be followed by the gaming operators. These include a number of compliance reports that need to be regularly sent to authorities in the respective jurisdictions. This process was simplified for new brands by creating a common reports template and automating the report creation in QuickSight. This helps new B2B brands meet these reporting requirements quickly and with minimal effort.
In addition, a number of control reports highlighting different areas of player protection are in place. As shown in the following example, responsible gaming reports such as those outlining player behavior deviations help identify accounts with problematic gambling patterns.

Players whose gaming pattern varies from the identified norm are flagged for inspection. This is useful to identify players who may need intervention.
Assessing game play and releases
It’s important to measure the performance and popularity of new games post release. Metrics such as unique player participation and player stakes are monitored during the initial days after the release, as shown in the following figures.
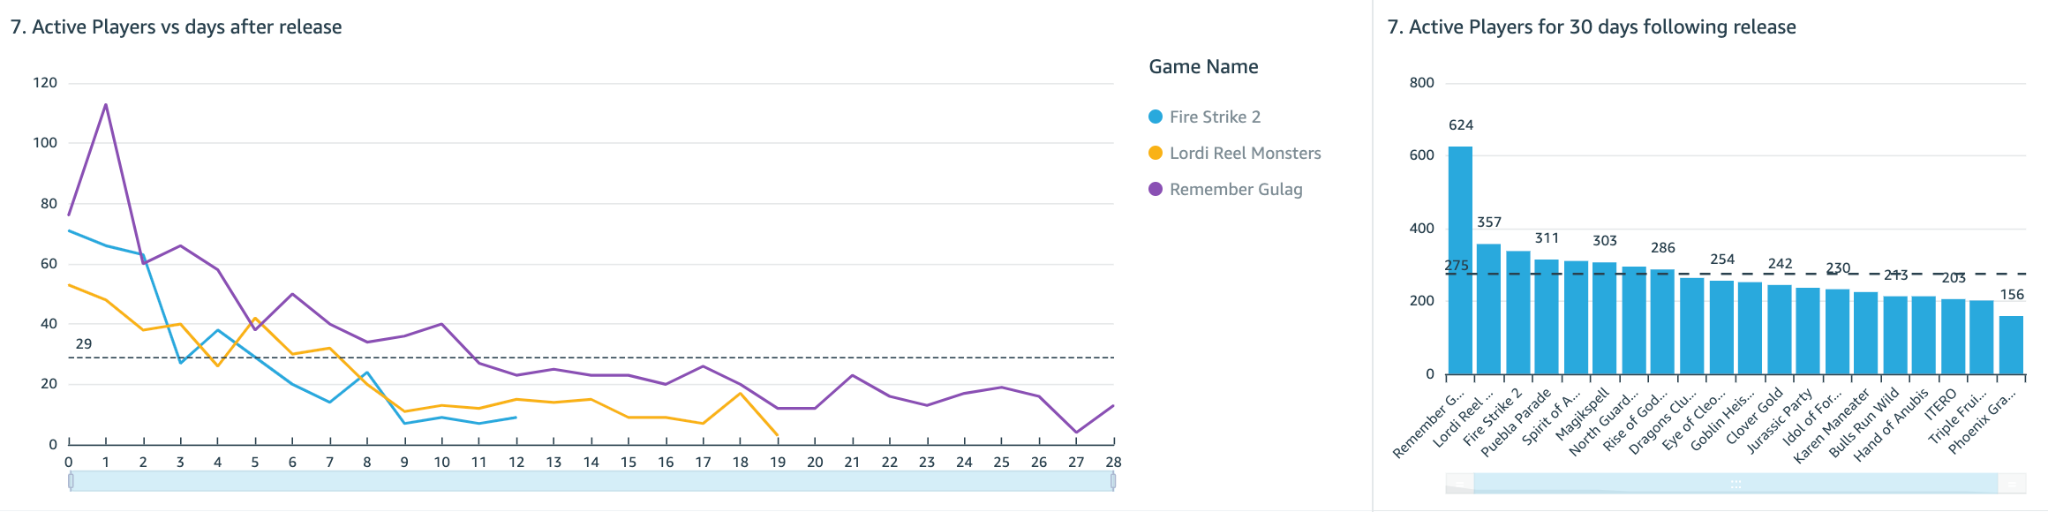
Not only does this help evaluate the overall player engagement, but it can also give a clear indication of how these games will perform in the future. By identifying popular games, a brand may choose to focus marketing campaigns on those games, and therefore ensure that it’s promoting games that appeal to its player base.
As shown in these example dashboards, we can use QuickSight to design and create business analytics insights of the iGaming data. This helps us answer real-life business-critical questions and take measurable actions using these insights.
Conclusion
In the iGaming industry, decisions not backed up by data are like an attempt to hit the bullseye blindfolded. With QuickSight, The Mill Adventure empowers its B2B partners and customers to harness data in a timely and convenient manner and support decision-making with winning strategies. Ultimately, in addition to gaining a competitive edge in maximizing revenue opportunities, improved decision-making will also lead to enhanced player experiences.
Reach out to The Mill Adventure and kick-start your iGaming journey today.
Explore rich set of out-of-the-box Amazon QuickSight ML Insights. Amazon QuickSight Q enables dashboards with natural language querying capabilities. For more information and resources on how to get started with free trial, visit Amazon QuickSight.
Join the Quicksight Community to ask, answer and learn with others and explore additional resources.
About the authors
 Darren Demicoli is a Senior Devops and Business Intelligence Engineer at The Mill Adventure. He has worked in different roles in technical infrastructure, software development and database administration and has been building solutions for the iGaming sector for the past few years. Outside work, he enjoys travelling, exploring good food and spending time with his family.
 Padmaja Suren is a Technical Business Development Manager serving the Public Sector Field Community in Market Intelligence on Analytics. She has 20+ years of experience in building scalable data platforms using a variety of technologies. At AWS she has served as Specialist Solution Architect on services such as Database, Analytics and QuickSight. Prior to AWS, she has implemented successful data and BI initiatives for diverse industry sectors in her capacity as Datawarehouse and BI Architect. She dedicates her free time on her passion project SanghWE which delivers psychosocial education for sexual trauma survivors to heal and recover.
 Deepak Singh is a Solution Architect at AWS with specialization in business intelligence and analytics. Deepak has worked across a number of industry verticals such as Finance, Healthcare, Utilities, Retail, and High Tech. Throughout his career, he has focused on solving complex business problems to help customers achieve impactful business outcomes using applied intelligence solutions and services.