AWS Big Data Blog
Introducing Cluster Insights: Unified monitoring dashboard for Amazon OpenSearch Service clusters
Amazon OpenSearch Service clusters offer a wealth of operational metrics accessible through CloudWatch and the Amazon OpenSearch Service console to support effective performance monitoring and alert creation. Yet, pinpointing resiliency and performance challenges within your cluster can prove daunting. The process of identifying resource-intensive queries or understanding performance degradation trends can be time-consuming.
To address these challenges, we launched Cluster Insights, which presents a unified dashboard delivering curated insights along with actionable mitigation steps. The dashboard displays detailed metrics at the node, index, and shard levels, coupled with a concise summary of security and resiliency best practices to uphold peak resiliency and availability.
This blog will guide you through setting up and using Cluster Insights, including key features and metrics. By the conclusion, you’ll understand how to use Cluster Insights to recognize and address performance and resiliency issues within your OpenSearch Service clusters.
Getting Started with Cluster Insights
Cluster Insights is available at no additional cost to OpenSearch Service users running OpenSearch version 2.17 or later. Accessing Cluster Insights requires admin-level permissions for your OpenSearch domain. Cluster Insights is available only through the OpenSearch UI. OpenSearch UI offers support to multiple data sources, zero downtime upgrades for your dashboard experience, and curated workspaces for effective team collaborations. You first need to associate a data source (your clusters) with an OpenSearch UI application. Detailed steps are described in the user guide. Your OpenSearch UI console experience will look like following screenshots.
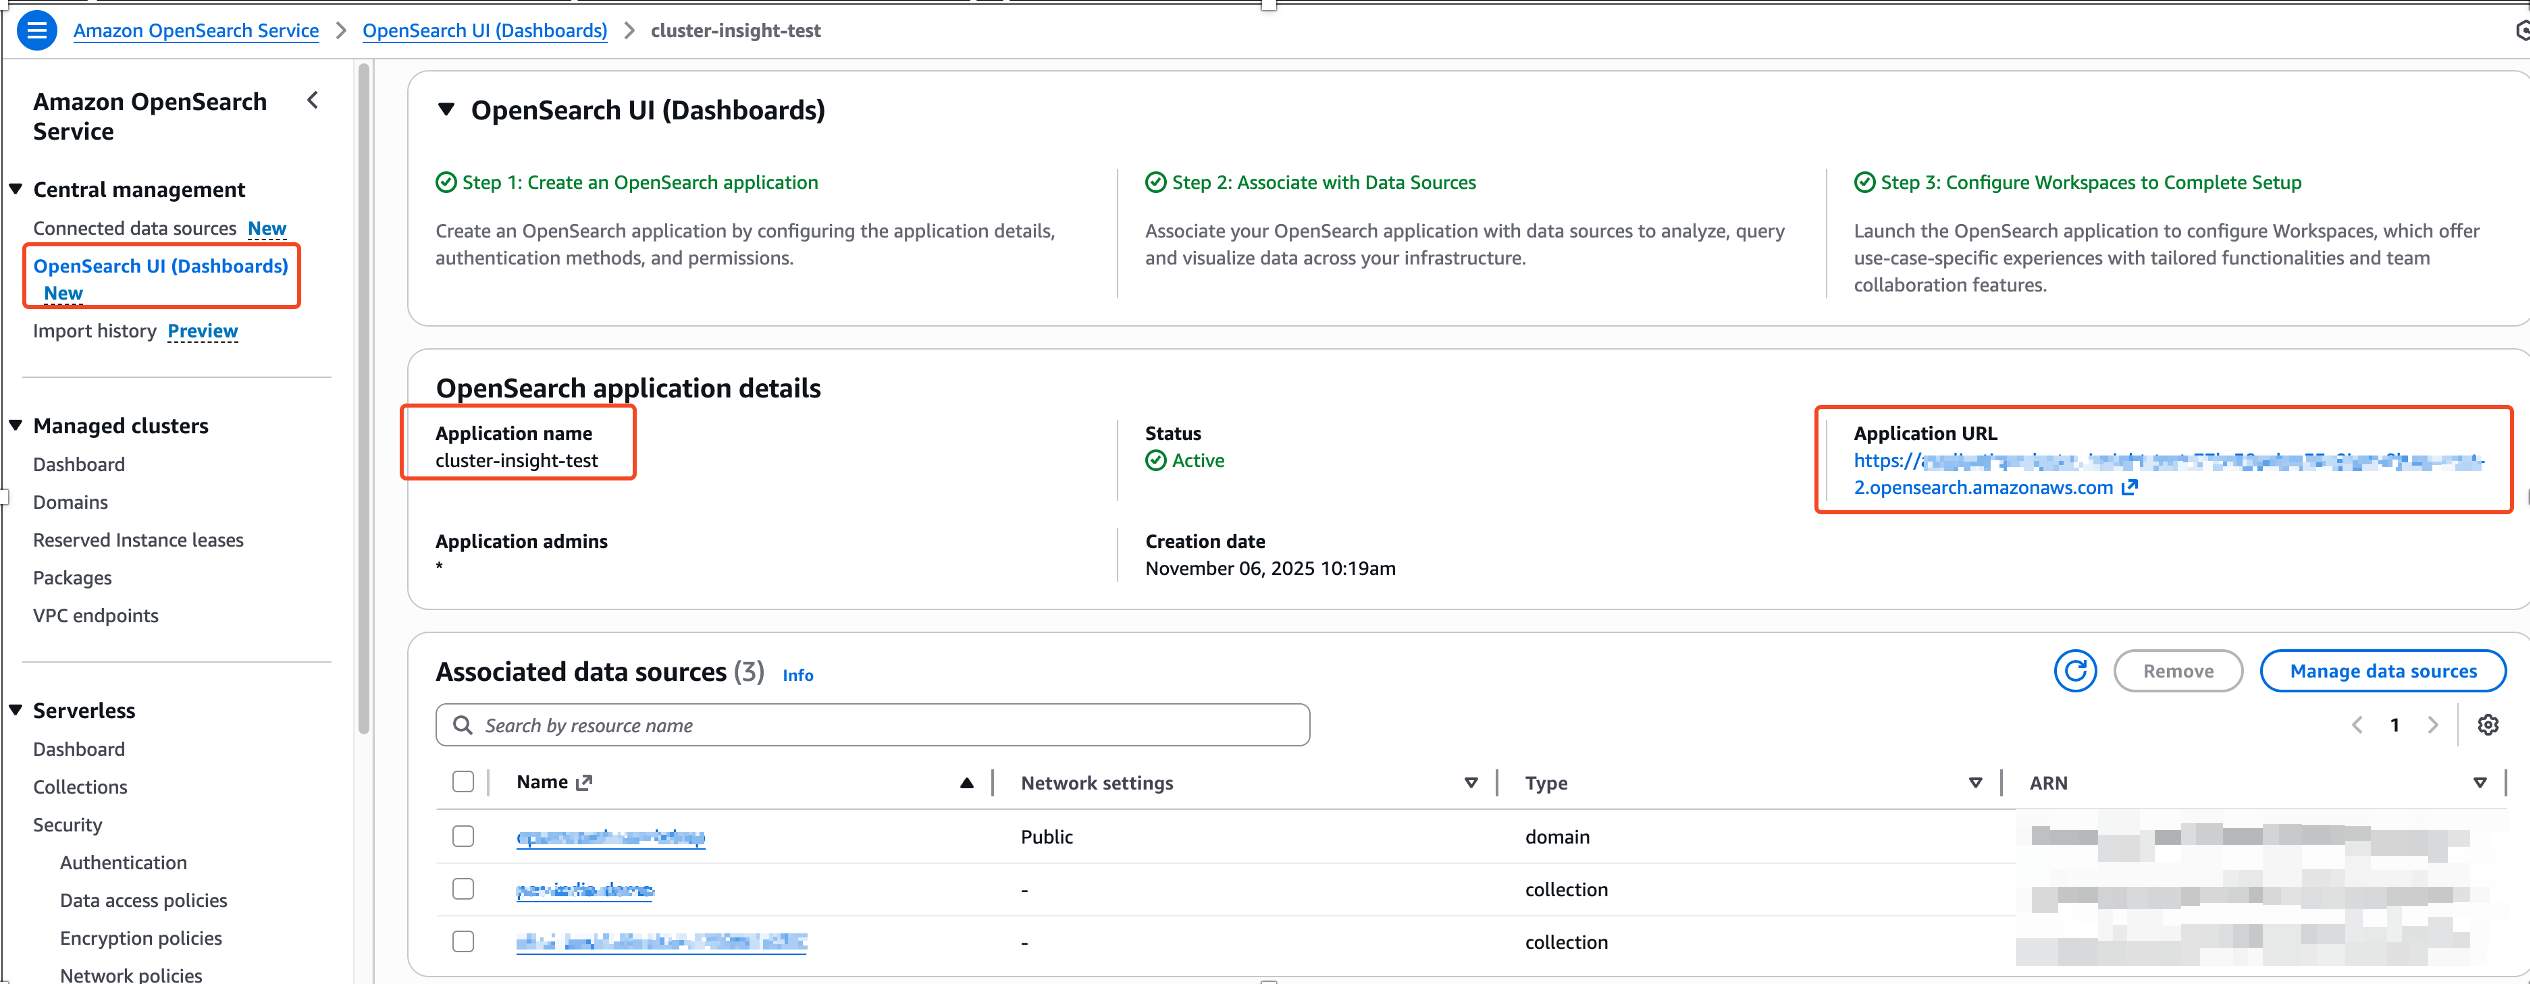
To access Cluster Insights using the OpenSearch UI application:
- In the Amazon OpenSearch Service console, navigate to OpenSearch UI (Dashboards) and choose the Application URL to access your OpenSearch UI application.
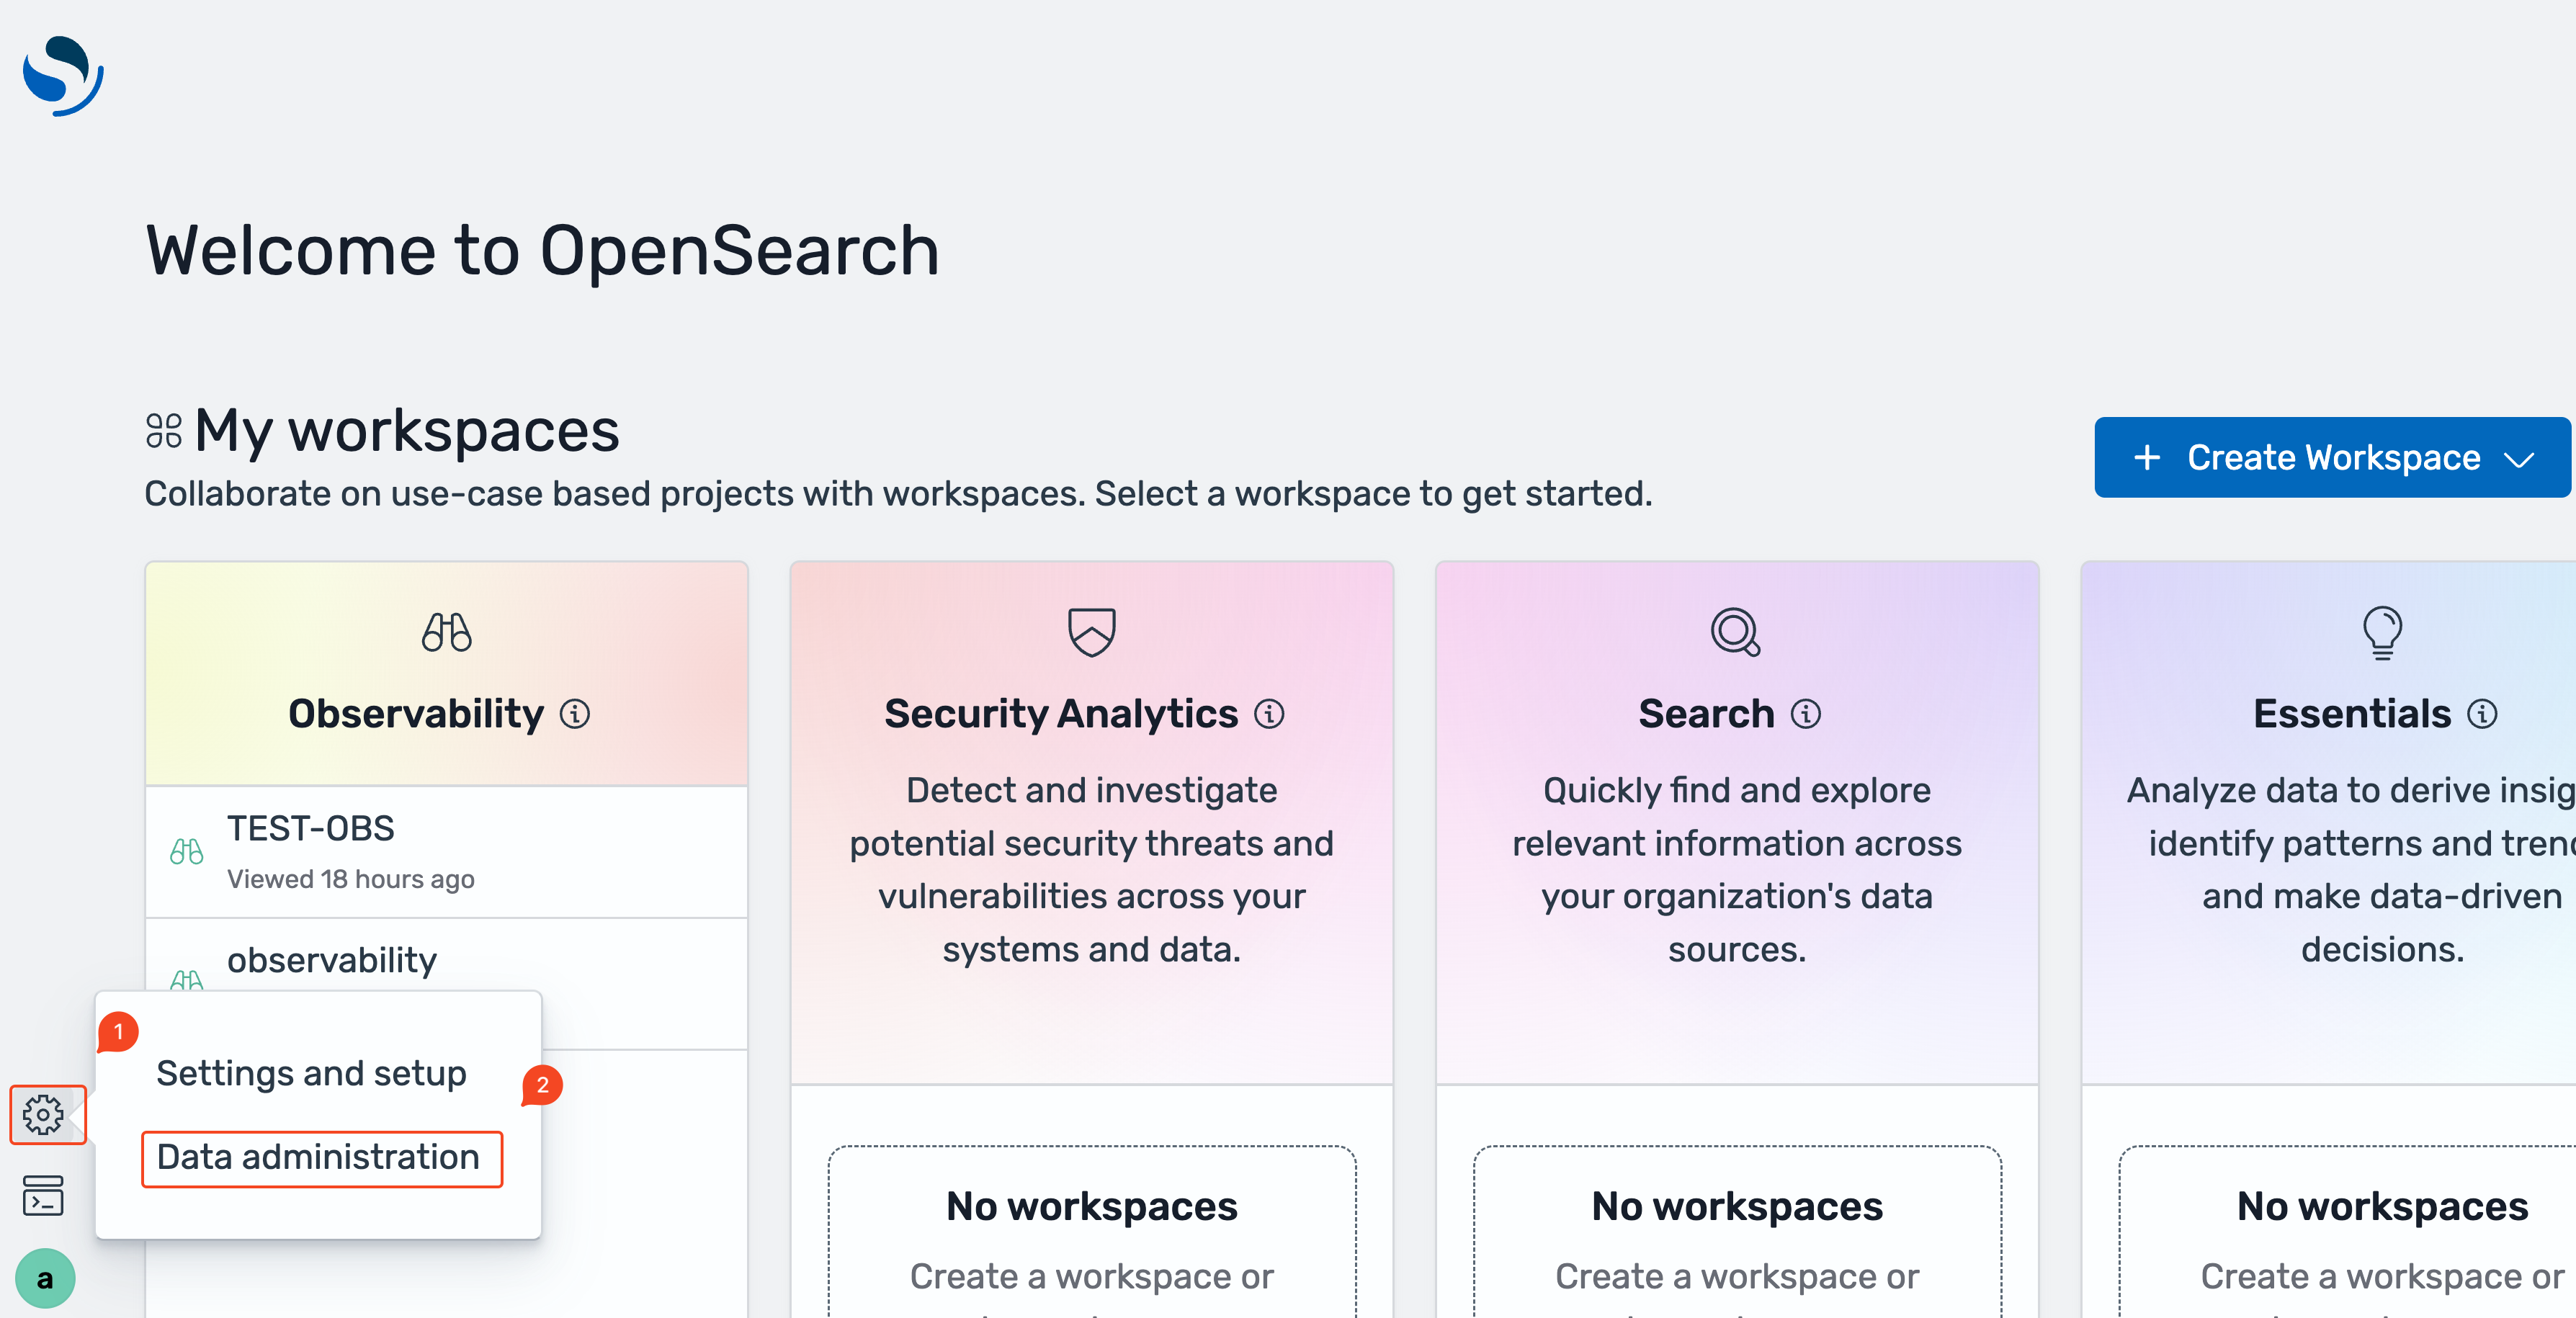
- OpenSearch UI application, choose the settings icon at the left-bottom corner, then choose Data administration.
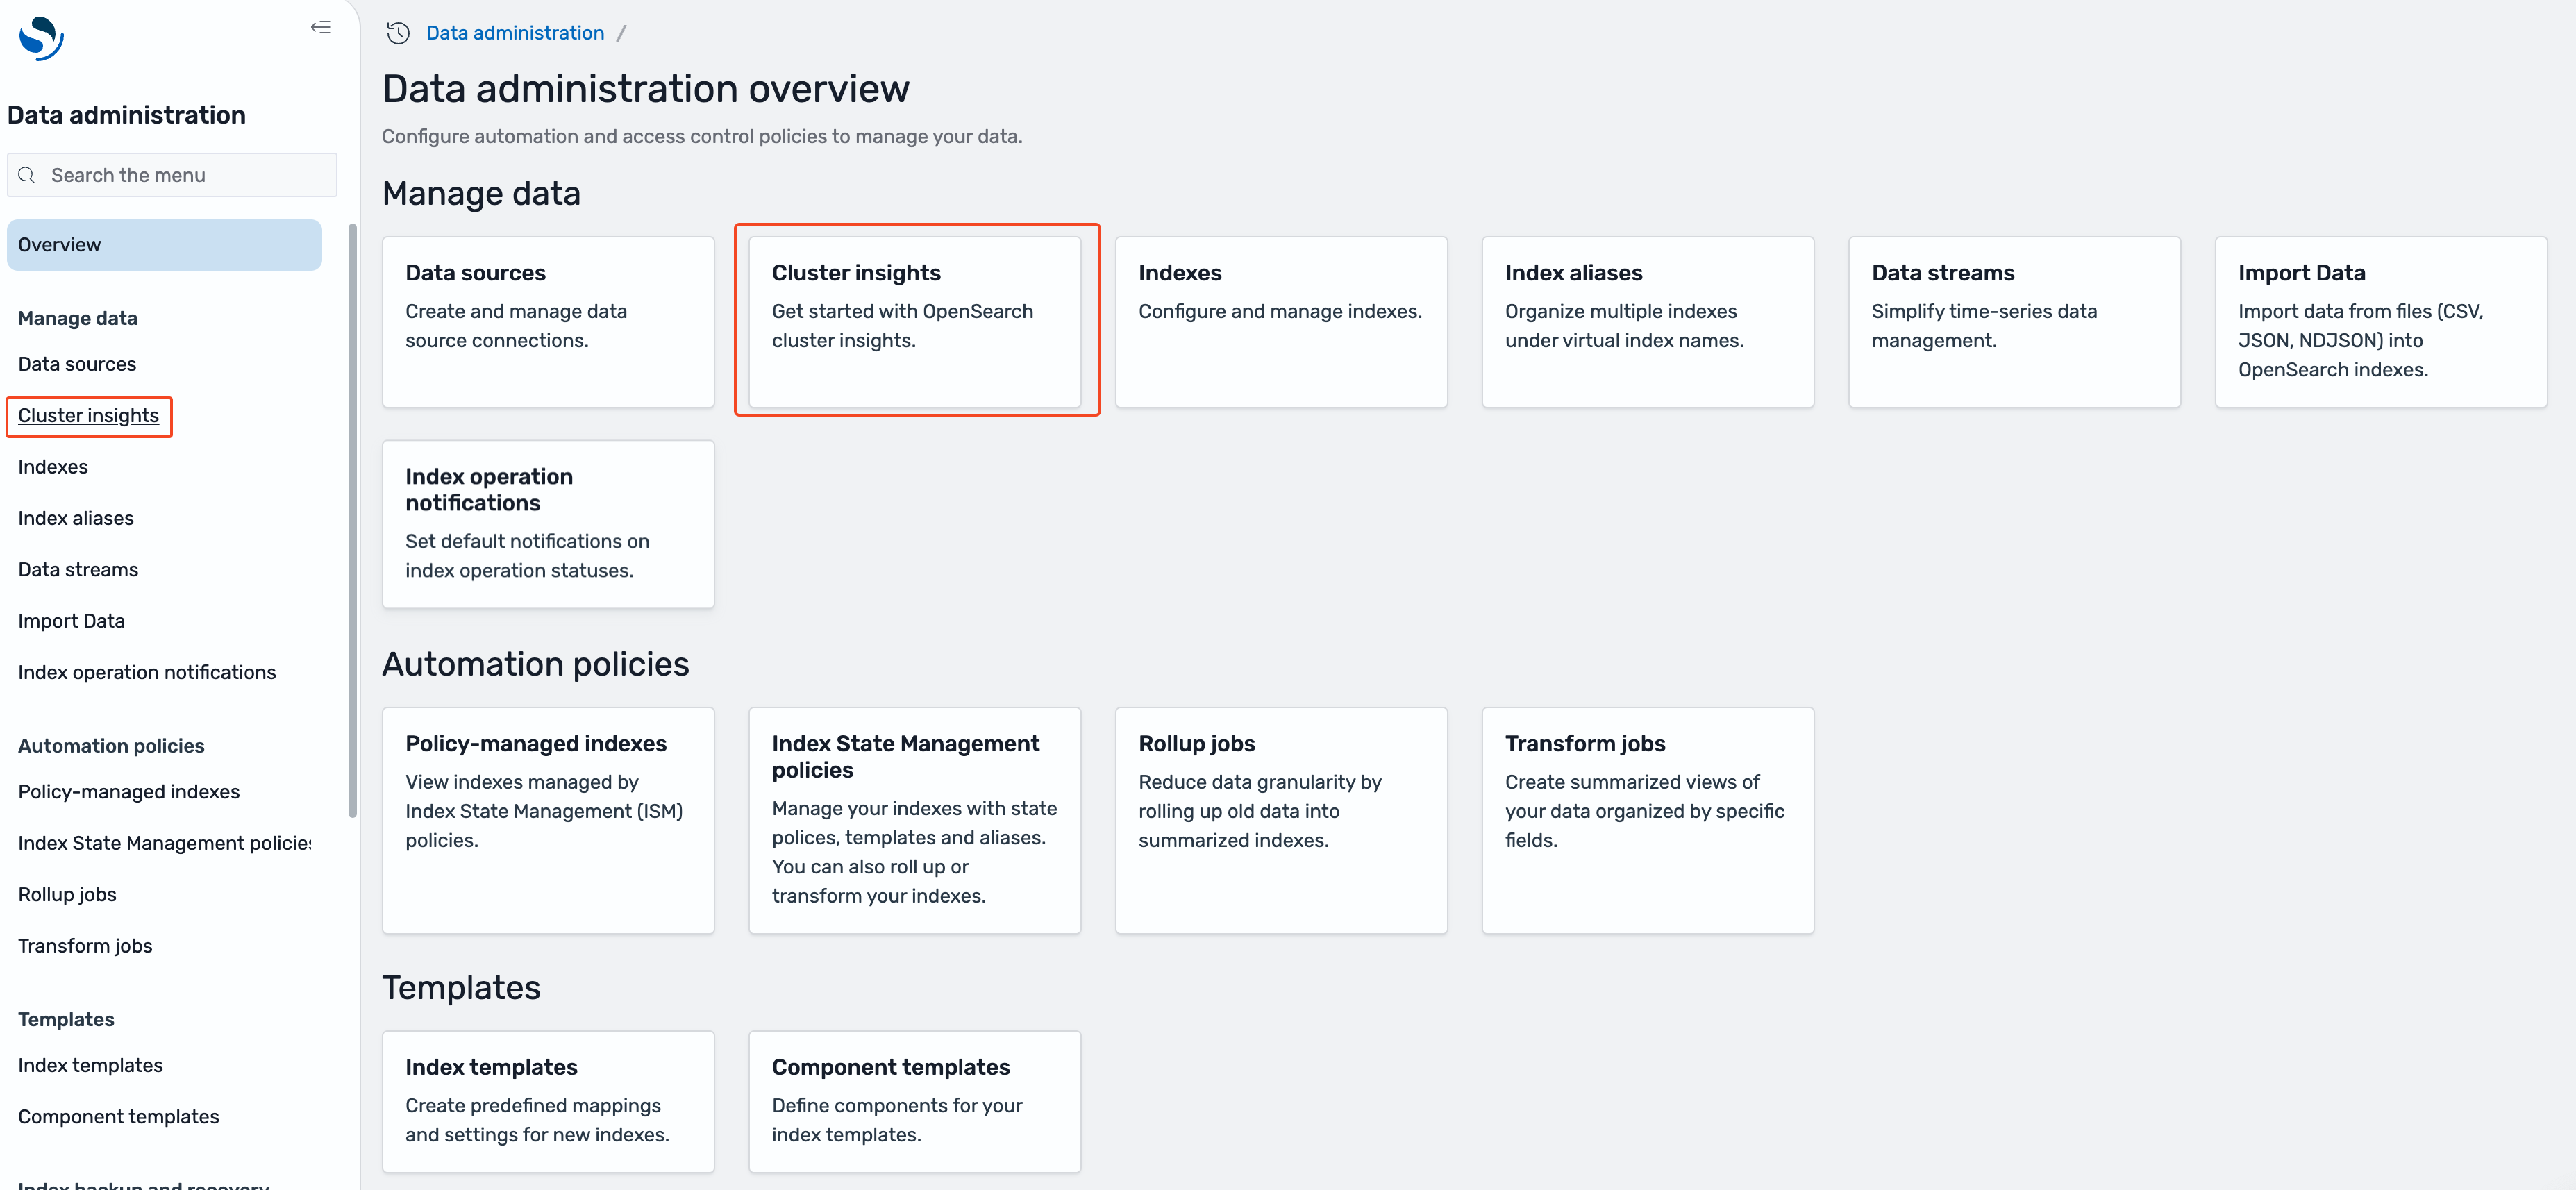
- On the Data administration overview page, or under Manage data in the left navigation, select Cluster insights.
Cluster insights overview
The Cluster insights – Overview acts as a landing page to show health and insights for all connected OpenSearch domains. It is organized into five sections:
- Current cluster status – Displays cluster health status (Green, Yellow, and Red) in a donut chart.
- Insights trend – Tracks issue patterns over the past 30 days, helping you identify emerging problems and track resolution progress. This trend analysis becomes particularly valuable when monitoring the impact of operational changes or troubleshooting recurring issues.
- Current open insights – Shows the count and severity breakdown of currently active insights across your clusters.
- OpenSearch service clusters – Lists all domains with their vital statistics such as health status, insights count, nodes, shards, and active queries.
- Top insights by severity – Prioritizes issues that need immediate attention. Each insight comes with a clear description and specific recommendations, transforming complex monitoring data into actionable tasks. This prioritized view helps teams can focus on critical issues first, whether they’re addressing shard size problems, disk space issues, or performance bottlenecks.
Together, these sections provide a comprehensive view of your OpenSearch Service infrastructure so you can assess cluster health, identify trends, and take action on critical issues from a single dashboard.
Cluster health
When you choose a specific cluster from the OpenSearch domains on the Cluster insights – Overview page, you will see cluster-specific details including health status, active insights, and performance metrics. The overview section displays cluster health along with essential metrics including count of shards, nodes, indices, and a total document size. You can also review the configuration best practices followed by domain across resiliency and security areas.
The lower section contains a table of actionable insights that presents a detailed view of current issues. This table mirrors the insights from the landing page but focuses specifically on issues affecting the selected cluster. You can observe high-severity issues such as low disk space and shard count problems, as well as medium-severity concerns that may impact cluster performance.
Each insight entry serves as an interactive element – selecting any issue reveals an in-depth analysis complete with root cause identification and specific remediation steps. The table includes important metadata such as generation timestamps, severity levels, recommendation counts, and current status, so users can prioritize and address issues effectively.
Insight details
Every insight offers detailed analysis and actionable recommendations. Take the Shard Count insight as an example: selecting it reveals a comprehensive breakdown of the issue. You’ll see that your OpenSearch cluster has breached the number of shards allowed on the nodes based on its JVM heap size, along with a detailed list of affected resources.

The detailed view includes a resource map that precisely identifies each impacted node and index, displaying critical information such as node IDs, shard counts, and the indices contributing to the issue.
The recommendations are organized into two levels: cluster-level recommendations address overall architecture improvements, such as scaling your cluster or adjusting global shard allocation settings. Index-level recommendations provide specific actions for individual indices—for example, you might see suggestions to move idle shards to UltraWarm storage. These are shards without any search or indexing operations for the last 10 days and are at least 5 days old, making them ideal candidates for warm storage to reduce the active shard count. All of this guidance is available directly within the Cluster Insights interface, eliminating the need to switch between different tools or consoles.
Node, Index, Shard, and Query view
Next to cluster health, you can review Node, Index, Shard, and Query details for a specific cluster. These views present critical metrics such as resource (CPU, memory, disk) utilization, search and index latency.
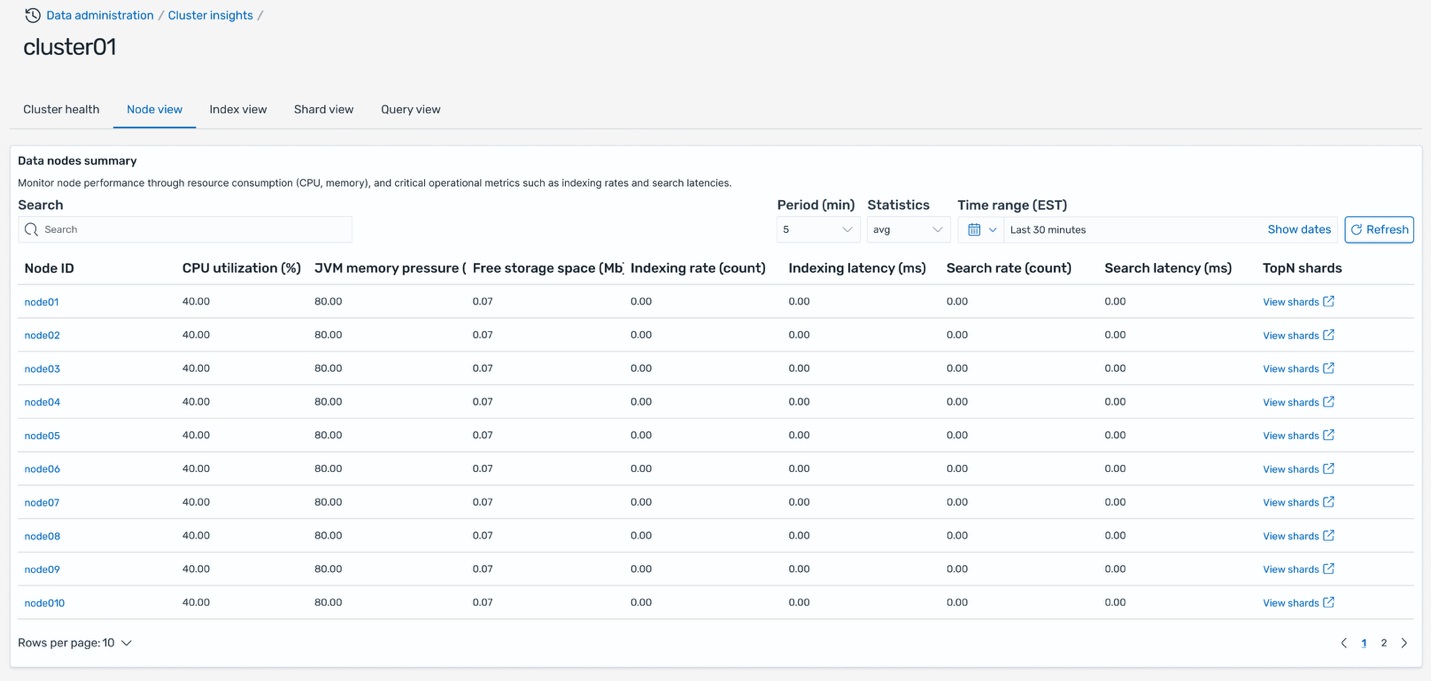
Node view
The Node view tab provides a comprehensive view of individual node performance across your cluster. This table displays critical metrics for each node including heat score indicating overall node health, resource utilization (CPU, memory, disk), search and indexing latency and rates, along with quick links to view top N shards and queries running on each node.
This view helps you identify nodes experiencing high resource utilization or performance degradation. You can drill deeper into each node by clicking on the node ID to view detailed time-based metrics showing resource usage trends over time. Additionally, you can click the top N shards link to navigate directly to the Shard View, automatically filtered to show only the shards running on the selected node, allowing you to pinpoint which specific shards are contributing to performance issues.
Index view
The Index view tab shows performance metrics aggregated at the index level. For each index, you can monitor document count and storage size, search latency and rate, indexing latency and rate, and access top N queries affecting the index. This perspective is valuable for understanding which indices are driving cluster load and identifying optimization opportunities at the index configuration level.

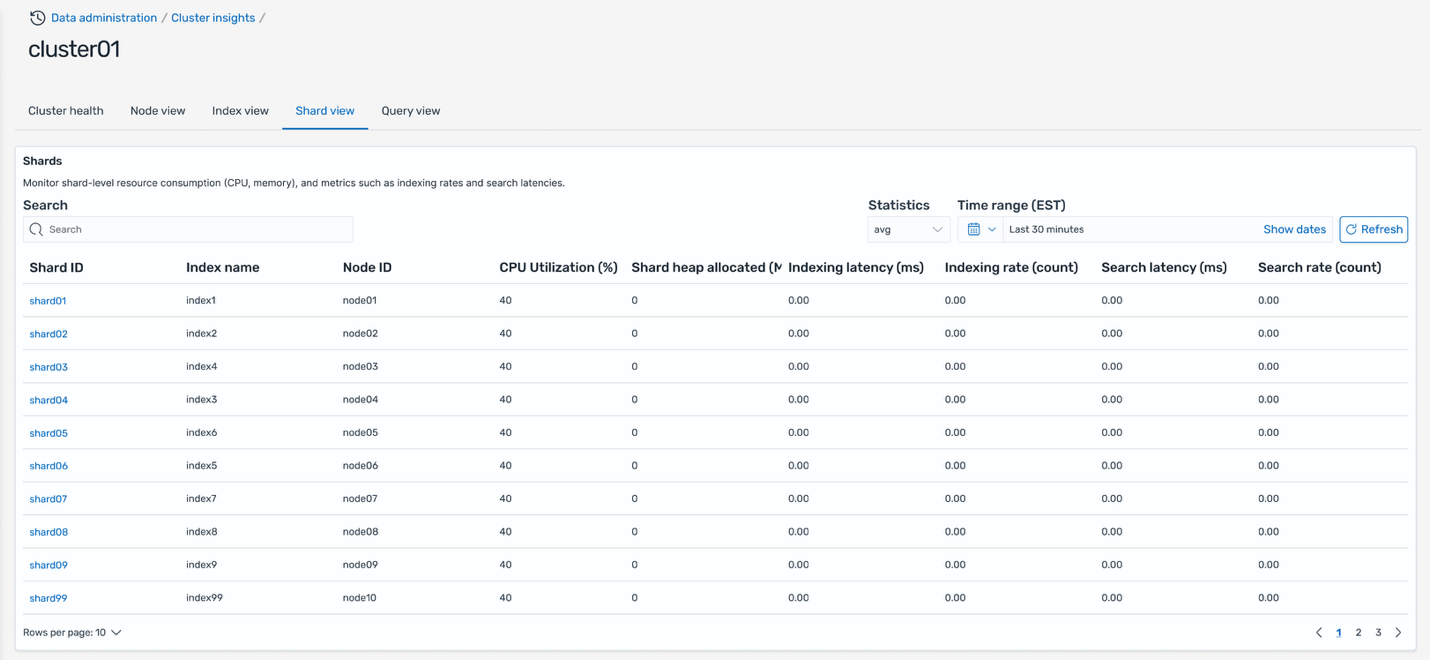
Shard view
The Shard view tab offers the most granular view of cluster performance by displaying metrics for individual shards. Each row shows shard ID and its assigned node, index association and resource pressure metrics (CPU, memory), along with search and indexing latency per shard. This detailed view enables you to pinpoint specific shards causing performance issues, identify shard placement imbalances, and take targeted remediation actions.
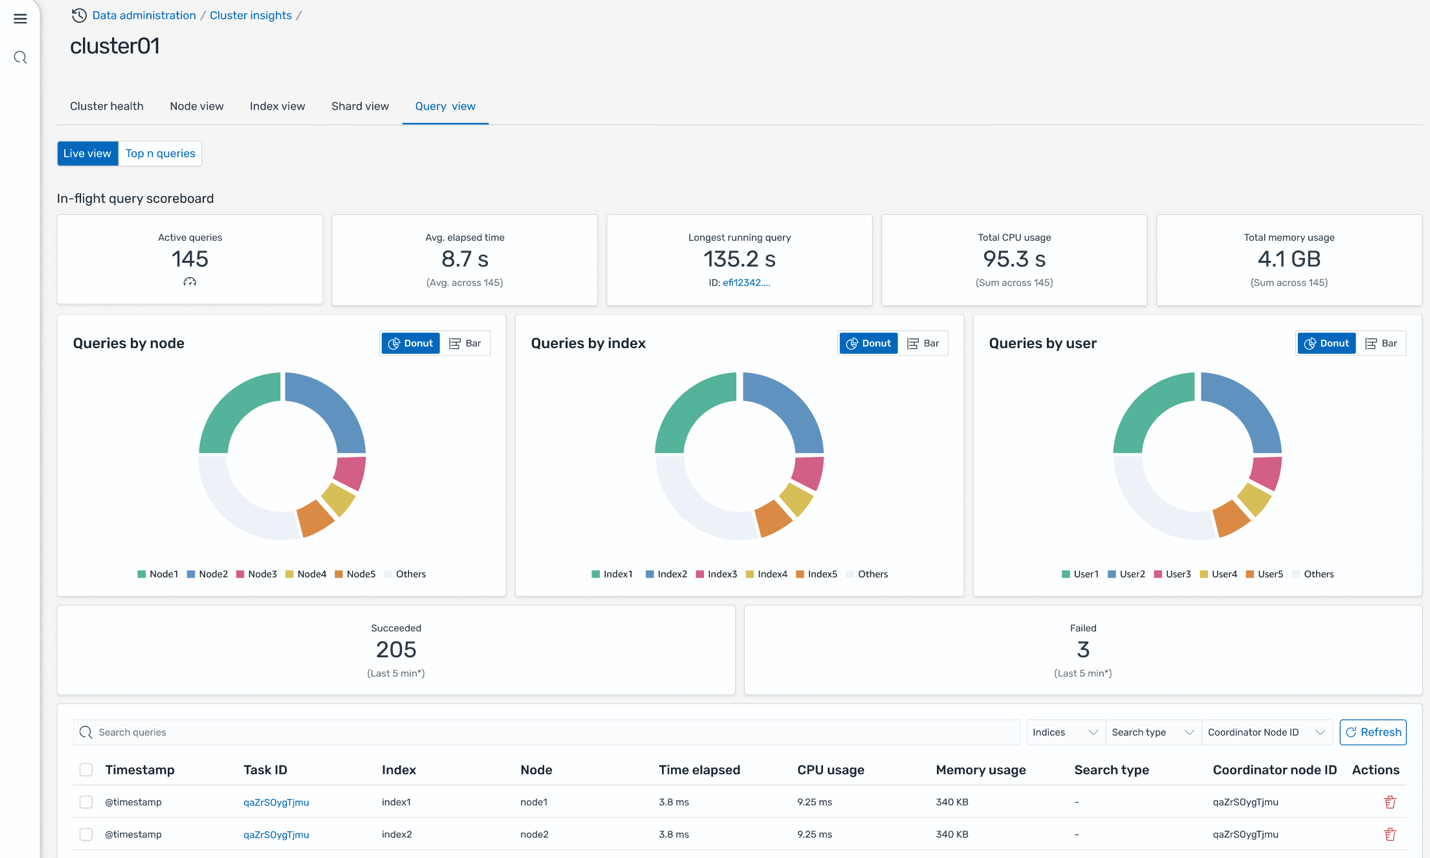
Query view
The Query view on the Cluster insights page solves presents live dashboards that break down execution stats, CPU and memory usage, and completion progress for every query. This helps monitor which queries are driving the biggest resource consumption (the Top-N queries). With intuitive donut charts and scoreboards showing distribution by node, index, and user, this interface helps operators to quickly pinpoint performance bottlenecks and heavy workloads, supporting targeted optimization and confident scaling decisions.
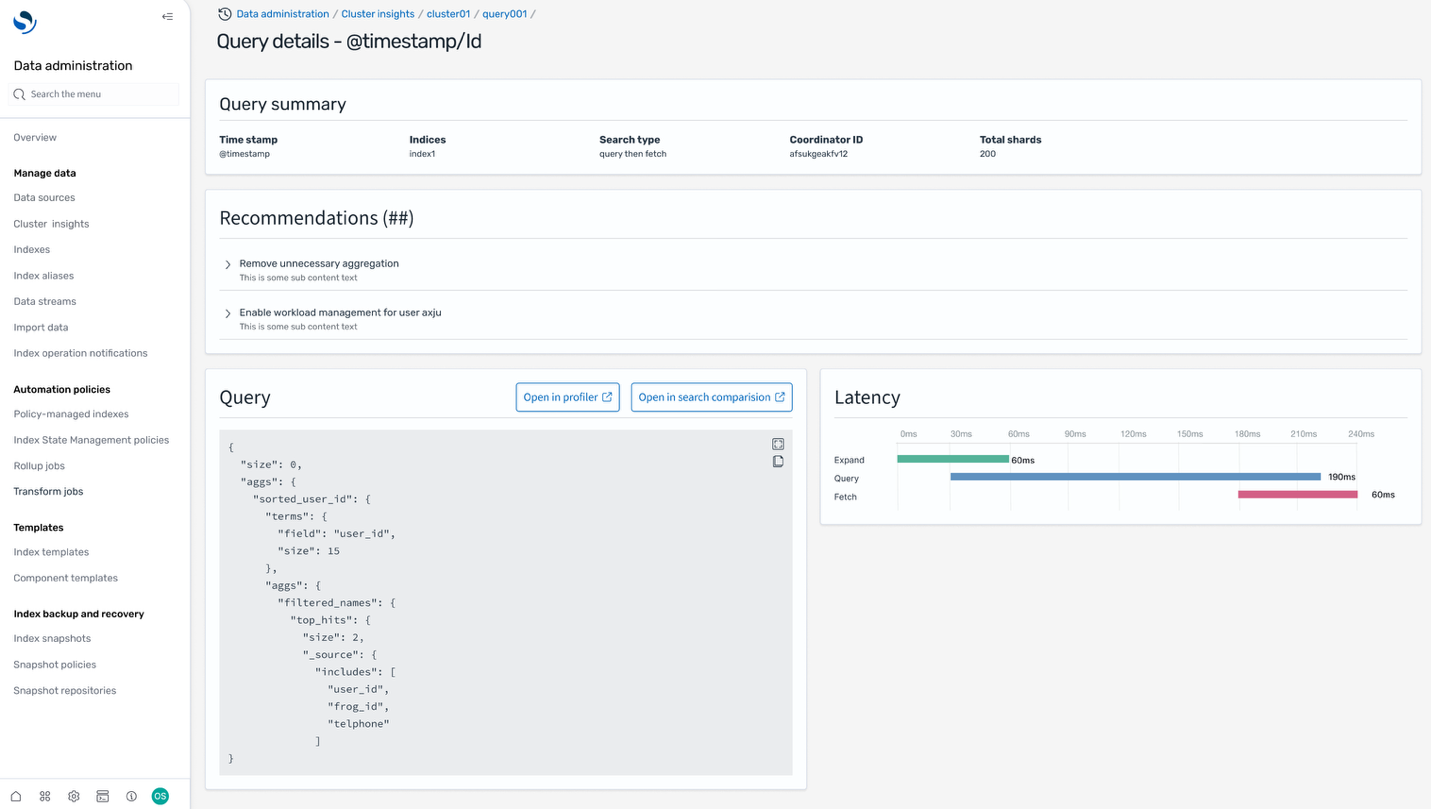
Query insights
In addition to Cluster insights, you can also get Query insights to view the exact queries running and latencies across Expand, Query, and Fetch phases that provides valuable insights for search developers to further fine-tune their queries.
Conclusion
Cluster Insights transforms OpenSearch Service cluster management from reactive troubleshooting to proactive optimization. By providing unified dashboards with heat score, and best practices across stability, resiliency, and security pillars, it offers visibility into your search infrastructure at the account level.
The actionable recommendations and step-by-step remediation guidance help users of all experience levels effectively resolve complex issues like shard imbalances and resource bottlenecks.
The integration with Query insights delivers real-time visibility into resource consumption patterns so that teams can identify and optimize performance-critical queries through detailed profiling and latency analysis.
For more information, see the AWS OpenSearch Service User Guide for additional details.