AWS Big Data Blog
Modernize business intelligence workloads using Amazon Quick
Traditional business intelligence (BI) integration with enterprise data warehouses has been the established pattern for years. With generative AI, you can now modernize BI workloads with capabilities like interactive chat agents, automated business processes, and using natural language to generate dashboards.
In this post, we provide implementation guidance for building integrated analytics solutions that combine the generative BI features of Amazon Quick with Amazon Redshift and Amazon Athena SQL analytics capabilities. Use this post as a reference for proof-of-concept implementations, production deployment planning, or as a learning resource for understanding Quick integration patterns with Amazon Redshift and Athena.
Common use cases
You can use this integrated approach across several scenarios. The following are some of the most common use cases.
- Traditional BI reporting benefits from bundled data warehouse and BI tool pricing, making generative BI the primary use case with significant cost advantages.
- Insurance: Automates Solvency II and IFRS 17 regulatory reporting, replacing manual spreadsheet consolidation.
- Banking: Accelerates FDIC call report generation and capital adequacy dashboards, cutting month-end close from days to hours.
- Interactive dashboards with contextual chat agents give BI teams conversational interfaces alongside their visual metrics.
- Gaming: Live ops teams query player retention and monetization KPIs in plain English—no SQL needed.
- Financial Services: Trading analysts chat with real-time P&L dashboards to surface anomalies and drill into positions on demand.
- Domain-specific analytics workspaces democratize enterprise data exploration through Quick Spaces and natural language queries.
- Insurance: Actuarial and underwriting teams query claims and risk data without waiting on data engineering.
- Banking: Risk and compliance teams explore credit, market, and operational data through a single natural language interface.
- Workflow automation removes repetitive tasks and accelerates self-service analytics.
- Financial Services: Automated AR reconciliation flows replace manual ledger matching, shrinking close cycle effort significantly.
- Gaming: Telemetry ingestion pipelines trigger reporting refreshes automatically, freeing data engineers from routine work.
Let us examine an end-to-end solution combining these technologies.
Solution flow
AWS offers two native SQL analytics engines for building analytics workloads. Amazon Redshift provides a fully managed data warehouse with columnar storage and massively parallel processing. Amazon Athena delivers serverless interactive query capabilities directly against data in Amazon S3.
You can use either Amazon Redshift or Amazon Athena as a SQL engine while implementing the steps in this post. The following are the steps involved in building an end-to-end solution.
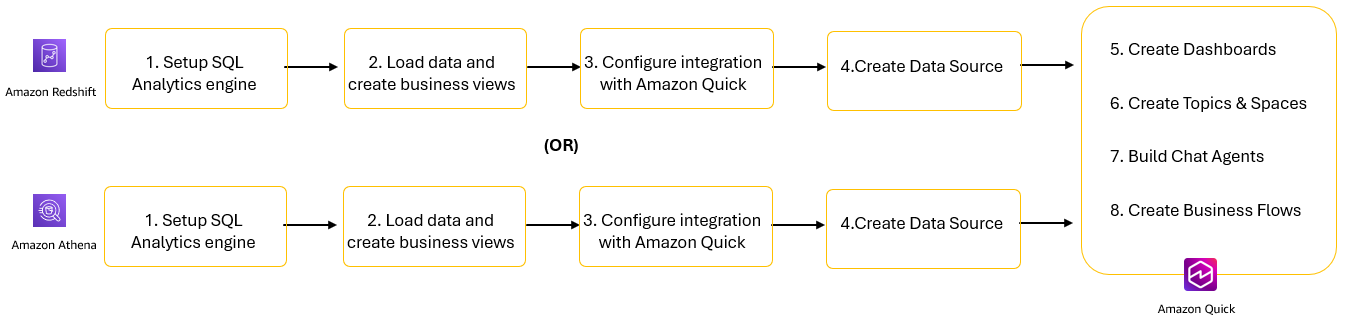
Figure1: Solution steps to integrate SQL Analytics engines with Amazon Quick
- Set up your SQL analytics engines: Amazon Redshift or Amazon Athena.
- Load data and create business views designed for analytics workloads.
- Configure integration between SQL analytics engines and Amazon Quick.
- Create data sources in Amazon Quick.
- Create datasets and dashboards for visual analytics.
- Use Topics and Spaces to provide natural language interfaces to your data.
- Deploy chat agents to deliver conversational AI experiences for business users.
- Implement business flows to automate repetitive workflows and processes.
Let’s start by walking through steps 1–4 for Amazon Redshift. We then describe the same four steps for Amazon Athena before explaining the Amazon Quick steps 5–8.
Configure and create datasets in Amazon Redshift
Amazon Redshift offers two deployment options to meet your data warehousing needs. Provisioned clusters provide traditional deployment where you manage compute resources by selecting node types and cluster size. Serverless automatically scales compute capacity based on workload demands with pay-per-use pricing. Both options are supported by Amazon Quick. For this walkthrough, we use Redshift Serverless.
Set up SQL analytics engine
To create a Redshift Serverless namespace and workgroup:
- Open the Amazon Redshift console.
- On the left navigation pane, select Redshift Serverless.
- Follow the steps described in the Creating a workgroup with a namespace documentation page to create a workgroup and a namespace. Note the username and password provided. You will use these details for configuring connections in Amazon Redshift and Quick.
- You should see the status as Available for both the workgroup and namespace in the Serverless dashboard.
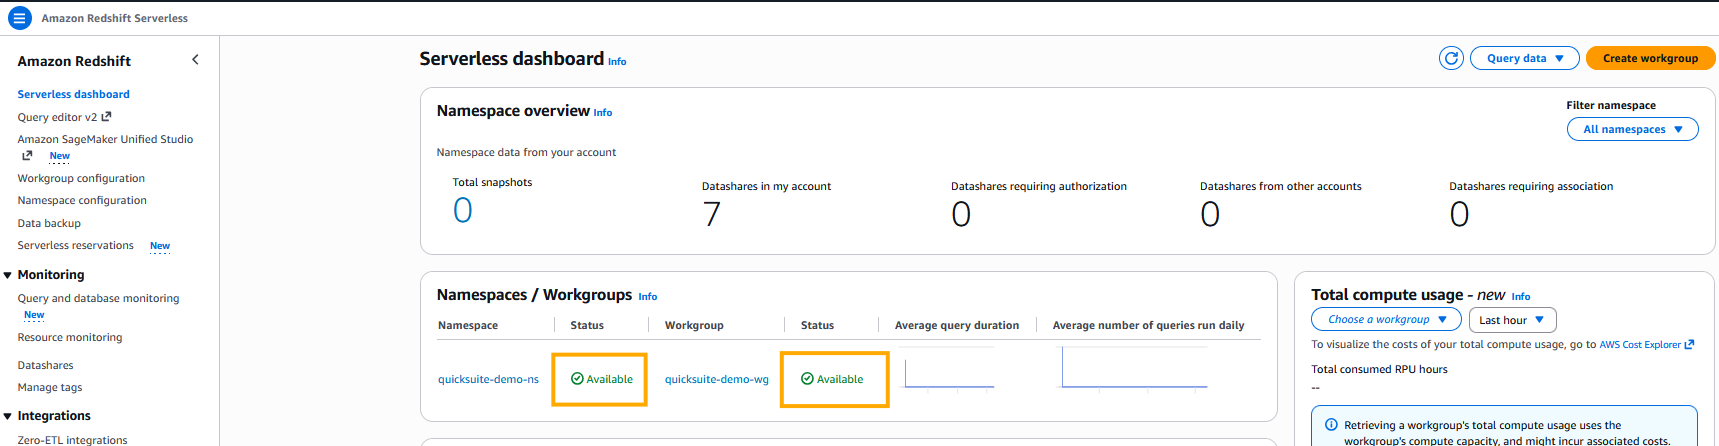
Figure 2: Amazon Redshift Serverless Workgroup and NamespacesThe deployment will be completed in approximately 3–5 minutes.
Load data and create business views
Now you can load data using the industry-standard TPC-H benchmark dataset, which provides realistic customer, order, and product data for analytics workloads.To load data into Amazon Redshift:
- Open the Amazon Redshift Query Editor V2 from the console.
- Run the TPC H DDL statements to create TPC-H tables.
- Run the following COPY commands to load data from the public S3 bucket:
s3://redshift-downloads/TPC-H/.
Ensure that the IAM role attached to the namespace is set as the default IAM role. If you didn’t set up the default IAM role at the time of namespace creation, you can refer to the Creating an IAM role as default for Amazon Redshift documentation page to set it now.
Run the following query to validate load status. The status column should show as completed. You can also review the information in other columns to see details about the loads such as record counts, duration, and data source.

Figure 3: Output of SYS_LOAD_HISTORY showing successful completion of COPY Jobs
- Create a materialized view to improve query performance:
Run the following SQL to create a materialized view that pre-compute results set for customer revenues and order volumes by market segment.
Run the following SQL to review the data in the materialized view.
Configure integration with Amazon Quick
Amazon Quick auto discovers the Amazon Redshift provisioned clusters that are associated with your AWS account. These resources must be in the same AWS Region as your Amazon Quick account. For Amazon Redshift clusters in other accounts or Amazon Redshift Serverless, we recommend that you add a VPC connection following the steps in Enabling access to an Amazon Redshift cluster in a VPC documentation. Usually, these steps are performed by your organization’s cloud security administration team.
For serverless, you will apply the same steps in the workgroup instead of the cluster. You can find the VPC and Security Group settings in the Data Access tab of a workgroup.
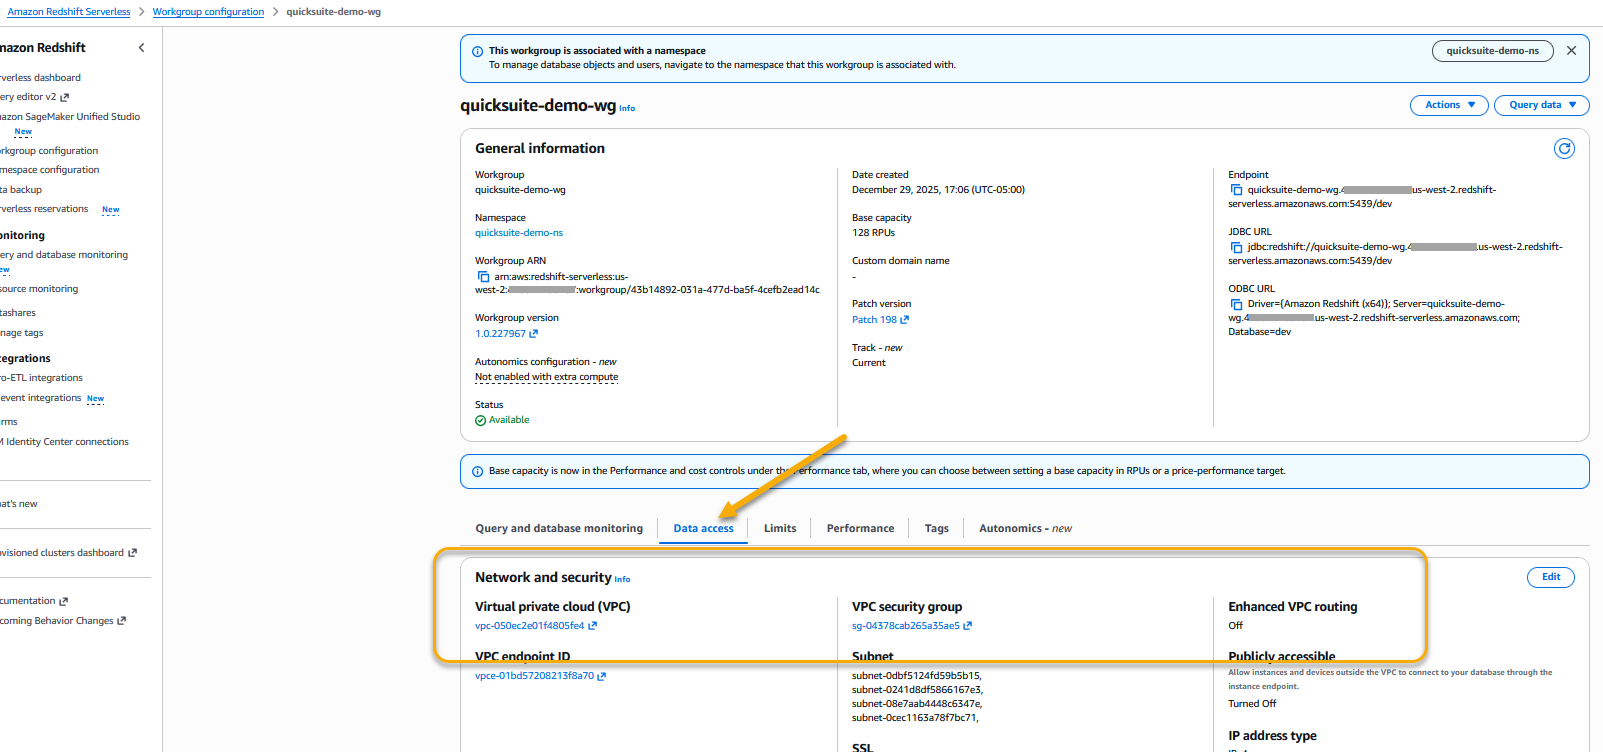
Figure 4: Amazon Redshift Serverless workgroup VPC and Security groups
You can also refer to How do I privately connect Quick to an Amazon Redshift or RDS data source in a private subnet? for a demonstration.
Create data source
To create a dataset connecting to Amazon Redshift, complete the following steps.
- In the Quick left navigation pane, go to Datasets.
- Choose the Data sources tab and select Create data source.
- Select Amazon Redshift and enter the following:
- Data Source Name: Provide
customer-rev-datasourceas data source name. - Connection type: Select the VPC connection created in the previous step.
- Database server: Enter the Amazon Redshift workgroup endpoint (for example,
quick-demo-wg.123456789.us-west-2.redshift-serverless.amazonaws.com). - Port: 5439 (default).
- Database:
dev. - Username/Password: Amazon Redshift credentials with access to the database.
- Data Source Name: Provide
- Choose Validate connection. The validation should be successful.
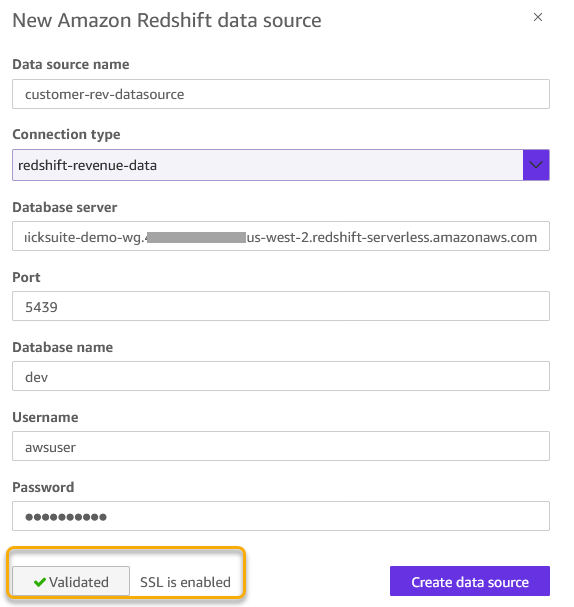
Figure 5: Amazon Redshift data source configuration
- Choose Create Data Source to create a data source.
Now let’s explore how to perform all these four steps to configure Athena in Amazon Quick.
Configure and create datasets in Amazon Athena
Amazon Athena provides immediate query capabilities against petabytes of data with automatic scaling to handle concurrent users. Let’s go through the steps to configure connections between Amazon Quick and Amazon Athena.
Set up SQL analytics engine
To create an Athena workgroup:
- Open the Amazon Athena console.
- In the navigation pane, choose Workgroups.
- Choose Create workgroup.
- For Workgroup name, enter
quick-demo. - For Query result configuration, select Athena managed.
- Choose Create workgroup.
Your workgroup is ready immediately for querying data.
Load data and create business views
For Athena, you create tables using the TPC-H benchmark dataset that AWS provides in a public S3 bucket. This approach gives you 1.5 million customer records already optimized in Parquet format without requiring data loading.
To create tables and views in Athena:
- Open the Athena Query Editor from the console.
- Create a database for your analytics (create S3 bucket if it exists already):
- Create an external table pointing to the TPC-H public dataset:
- Create a business-friendly view for analytics:
Run the following SQL to create a view that aggregates customer account balances grouped by market segments.
- Verify your view from Athena with:
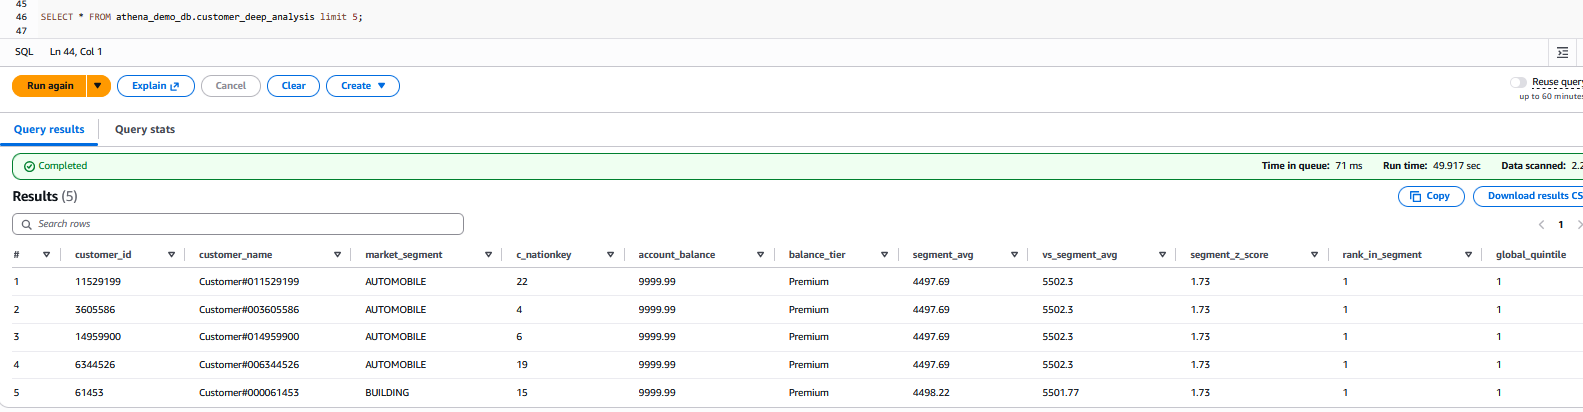
Figure 6: Output from the SELECT query
Configure integration with Amazon Quick
To connect to Amazon Athena in Amazon Quick, follow these steps, consolidated from official AWS documentation and authorizing connections to Amazon Athena.
Authorize Quick to Access Athena, S3 Bucket for data, and S3 bucket for Athena Results.
Open the Amazon Quick Security Settings
- Sign in to the Amazon Quick console as an administrator.
- In the top-right corner, choose your profile icon, then select Manage account.
- Under Permissions, choose AWS resources.
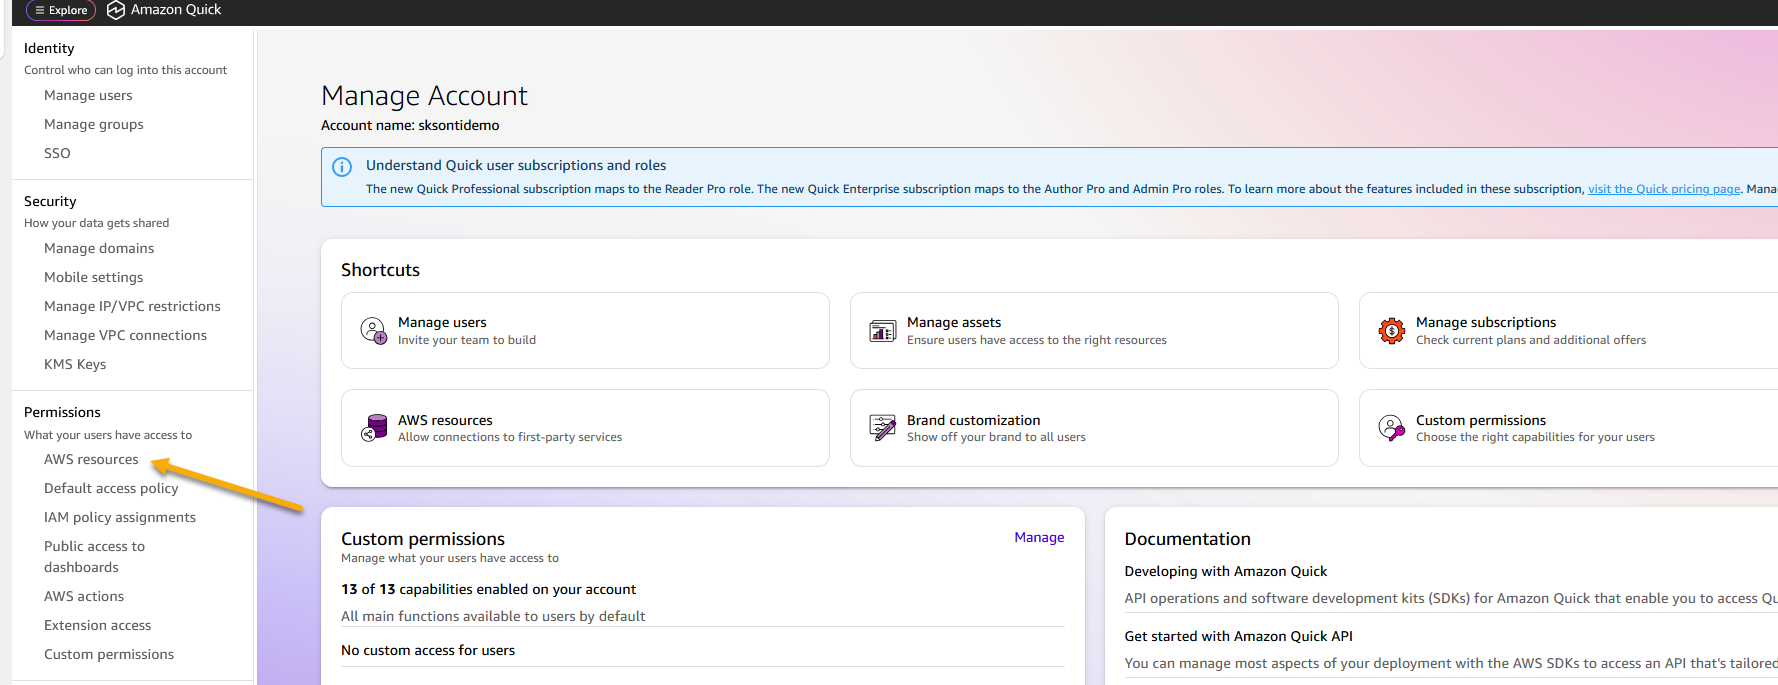
Figure 7: AWS resource permissions
Enable Athena Access
- Under Quick access to AWS services, choose Manage.
- Locate Amazon Athena in the list of AWS services.
- If Athena is already selected but access issues persist, clear the checkbox and re-select it to re-enable Athena.
- Under Amazon S3, select S3 buckets.
- Check the boxes next to each S3 bucket that Amazon Quick needs to access—including buckets used for Athena query results and any Redshift COPY source buckets.
- Enable Write permission for Athena Workgroup to allow Amazon Quick to write Athena query results to S3 and choose Finish.
- Choose Save to update the configuration.
The final step is to grant your Amazon Quick author permissions to query your database, Athena tables, and views. Configuration depends on whether AWS Lake Formation is enabled.
If AWS Lake Formation is not enabled
Permissions are managed at the Quick service role level through standard IAM-based S3 access control. Ensure that the Quick service role (for example, aws-quick-service-role-v0) has the appropriate IAM permissions for the relevant S3 buckets and Athena resources. No additional Lake Formation configuration is required.
If AWS Lake Formation is enabled
Lake Formation acts as the central authorization layer, overriding standard IAM-based S3 permissions. Grant permissions directly to the Amazon Quick author or IAM role.
To grant data permissions:
- Open the AWS Lake Formation console.
- Choose Permissions, then Data permissions, then Grant.
- Select the IAM user or role.
- Choose the required databases, tables, and columns.
- Grant SELECT at minimum; add DESCRIBE for dataset creation.
- Repeat for each user or role that requires access.
Create data source
Follow these steps to create an Athena data source on Amazon Quick.
- In the Amazon Quick console, navigate to Datasets and choose Data sources tab.
- Choose Create data source, then select the Amazon Athena card.
- Enter a Data source name (you can give any name of your choice), select your Athena workgroup (like quick-demo), and choose Validate connection.
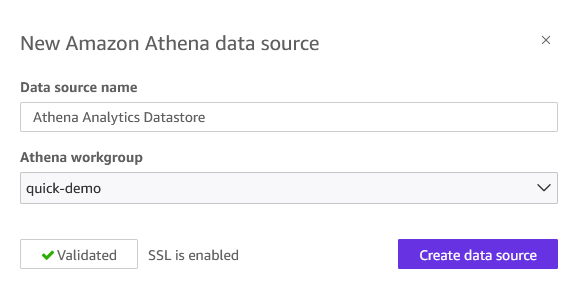
Figure 8: Athena data source creation
- Choose Create data source.
Your Athena data source is now available for building datasets, dashboards, and Topics.
Use Amazon Quick generative AI features
The next steps, from 5–8, demonstrate Amazon Quick generative AI capabilities using Amazon Redshift as a data source. While we use Amazon Redshift in this example, you can substitute with Amazon Athena based on your specific requirements.
Create dashboards
Let’s start by creating datasets from the Amazon Redshift data source.
- In the left navigation pane, choose Datasets.
- On the Datasets page, choose Create Dataset.
- For the data source, select Amazon Redshift data source
customer-rev-datasource. - From the menu, choose
mv_customer_revenue.
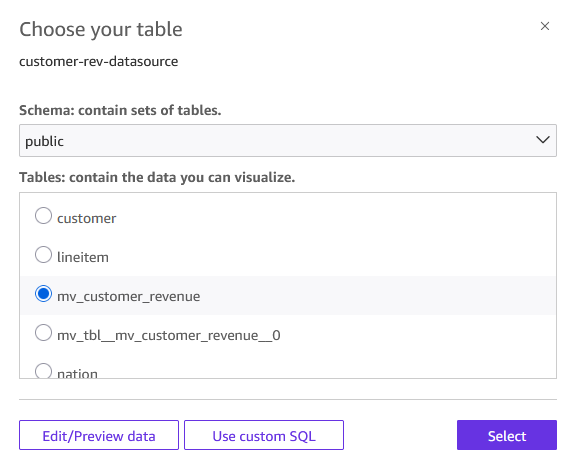
Figure 9: Select table to visualize
- You can choose one of the following query modes. For this post, select Directly query your data option and choose Visualize.
- Import to SPICE for quicker analytics – Quick loads a snapshot into its in-memory engine for faster dashboard performance.
- Directly query your data– Quick runs queries on demand against your query engine.
- Select Build icon to open a chat window. Enter “Show me orders by market segments” as the prompt. Note that you need Author Pro access to use this feature.
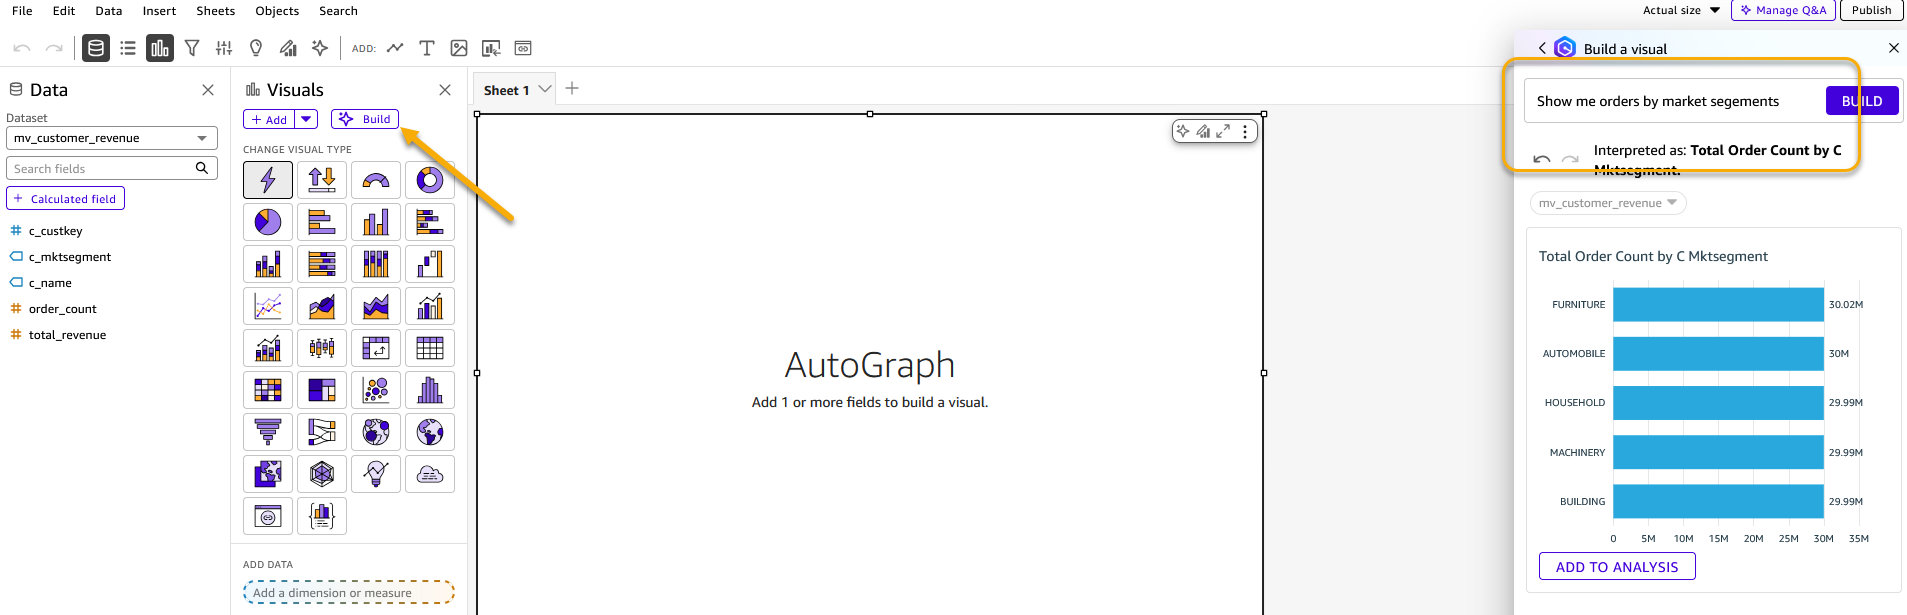
Figure 10: Build visualization using generative BI feature
- You can change the visual type to a pie chart and add it to the analysis.
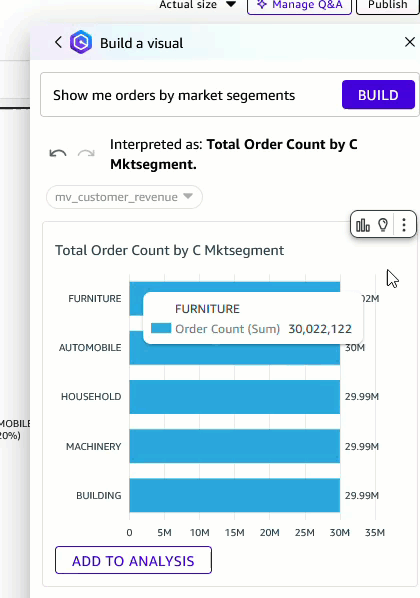
Figure 10: Change visual type
To publish your analysis as a dashboard
- After you add the visuals, choose Publish.
- Enter a name for the dashboard. For this post, use the Market Segment Dashboard.
- Choose Publish dashboard. Your dashboard is now available for viewing and sharing.
Create topics and spaces
To fully maximize enterprise data with AI, we must provide the right structure and context. That’s where Topics and Spaces come in. Topics act as natural language interfaces to your structured datasets, automatically analyzing your data, mapping fields, and adding synonyms. Business users can ask “What are total revenues by market segment?” and receive instant, visualized answers without writing a single line of SQL. Spaces bring together all of your related assets into a single collaborative workspace that democratizes data access, reduces context-switching, accelerates team onboarding, so everyone is working from the same trusted, AI-ready data sources.
To create a Quick topic
- From the Amazon Quick homepage, choose Topics, then choose Create topic.
- Enter a name for your topic. For this post, use Customer Revenue Analytics.
- Enter a description. For example:
The Customer Revenue Analytics topic is designed for business users (including analysts, sales operations teams, finance, and market segment owners who need to explore customer and revenue data without SQL expertise. It serves as a natural language interface over the mv_customer_revenue Amazon Redshift dataset, allowing users to ask plain-English questions like “What are total revenues by market segment?” and receive instant, visualized answers. By automatically mapping business language to the underlying schema, it democratizes access to revenue insights across the organization.
- Under Dataset, select
mv_customer_revenue. - Choose Create. The topic can take 15–30 minutes to enable depending on the data. During this time, Amazon Quick automatically analyzes your data, selects relevant fields, and adds synonyms.
- After the topic is enabled, take a few minutes to review and enrich it. The following are some example enrichments.
- Add column descriptions to clarify field meaning for business users.
- Define preferred aggregations (for example, sum compared to average for revenue fields).
- Confirm which fields are Dimensions and which are Measures.
- (Optional) To further refine how your topic interprets and responds to queries, add multiple datasets (for example, a customer CSV combined with a database view), custom instructions, filters, and calculated fields.
After your topic is created, its columns are available to add to a Space or to an Agent by selecting it as a data source.
Figure 11: Create a Quick Topic
Create a Space for your team
Spaces bring together dashboards, topics, datasets, documents, and other resources into organized, collaborative workspaces. By centralizing related assets in a single workspace, Spaces reduce context-switching, accelerate onboarding, so everyone is working from the same trusted data sources.
What to include in your Quick Space
- Dashboard – Add the dashboard Market Segment Dashboard published from your
mv_customer_revenueanalysis. This gives team members instant access to visualizations such as revenue by market segment, top customers by order volume, and revenue distribution. - Topic – Connect the Customer Revenue Analytics (built on the
mv_customer_revenuematerialized view) to enable natural language queries directly against your Amazon Redshift data. - Optionally, you can upload supporting context to ground your team’s analysis:
- Data dictionary or field definitions for
mv_customer_revenue - Market segment definitions (AUTOMOBILE, BUILDING, FURNITURE, MACHINERY, HOUSEHOLD)
- Business rules for revenue calculation (for example, how discounts are applied in the TPC-H model)
- This implementation guide, so new team members can onboard quickly
- Data dictionary or field definitions for
To create the Quick Space
- From the left navigation menu, choose Spaces, then choose Create space.
- Enter a name, for example, Customer Revenue & Segmentation.
- Enter a description. For example:
Centralized workspace for customer revenue analysis powered by Amazon Redshift includes interactive dashboards, natural language query access to customer and segment data, and supports documentation for the TPC-H revenue model.
- Add knowledge by connecting the Market Segment Dashboard and topic Customer Revenue Analytics.
- You can invite team members, such as finance, sales operations, and segment owners, and set appropriate permissions.
Your Space is now ready for collaborative data exploration.
Figure 12: Create a Quick Space
Build chat agents
A custom chat agent delivers conversational AI experiences that understand business context and provide intelligent, grounded responses to user queries. These agents go beyond question-and-answer interactions. They synthesize knowledge from your dashboards, topics, datasets, and documents to explain trends, surface anomalies, guide users through complex analytics workflows, and recommend next steps.
Rather than requiring users to navigate multiple tools or write SQL queries, agents serve as a single conversational interface to your entire analytics environment. Agents can also connect to Actions, pre-built integrations with enterprise tools such as Slack, Microsoft Teams, Outlook, and SharePoint, enabling them to answer questions and trigger real-world workflows, send notifications, create tasks, and interact with external systems directly from the conversation. Custom agents can be tailored to specific business domains, teams, or use cases so that responses align with organizational terminology, data definitions, and business processes. After created, agents can be shared across teams, enabling consistent, actionable, AI-powered data access at scale. For teams working with the mv_customer_revenue dataset, we recommend creating a dedicated Customer Revenue Analysis Agent. This is a purpose-built conversational assistant grounded in your Amazon Redshift data, dashboards, and the Customer Revenue & Segmentation Space.
Create a Quick chat agent
There are two ways that you can use Amazon Quick to create a Quick agent. You can use the navigation menu or directly from Space. The following steps walk you through creating one from the navigation menu.
To create a Quick chat agent
- From the left navigation menu, choose Agents, then choose Create agent.
- Enter a name for your agent, for example, Customer Revenue Analyst.
- Enter a description. For example:
An AI assistant for analyzing customer revenue, market segment performance, and order trends using our Amazon Redshift or data warehouse.
- Under Knowledge Sources, add the Customer Revenue & Segmentation Space as a data source. This gives your agent access to the dashboards, topics, and reference documents you’ve already built.
- (Optional) Define custom persona instructions to align the agent’s responses with your business context. For example, specifying preferred terminology, response style, or the types of questions it should prioritize.
- Choose Launch chat agent.
- Start having a conversation with your data. You are welcome to ask any questions. The following are some examples.
- Which market segment generated most revenue?
- Show me order trends
Figure 13: Create a Quick Chat agent
To share your Quick chat agent
After your agent is published, choose Share and invite team members or share it across your organization. Custom agents can be tailored to specific business contexts so that different teams can get AI assistance that speaks their language, without needing to configure anything themselves.
Create Quick Flows
Quick Flows automate repetitive tasks and orchestrate multi-step workflows across your entire analytics environment. This removes manual effort, reducing human error, and ensuring consistent execution of critical business processes. Flows can be triggered on a schedule or launched on demand, giving you flexible control over when and how automation runs.
You can build flows that span the full analytics lifecycle: monitoring data quality and flagging anomalies, generating and distributing scheduled reports to stakeholders, and triggering downstream actions in integrated systems such as Slack, Outlook. Amazon Quick gives you three ways to create a flow, so whether you prefer a no-code conversation or a visual step-by-step builder, there’s an option that fits how you work.
To create a flow from chat
- While conversing with My Assistant or a custom agent, describe the workflow that you want to automate in plain English.
- Amazon Quick generates the flow and offers to create it directly from your conversation — no configuration screens required.
To create a flow from a natural language description
- From the left navigation menu, choose Flows, then choose Create flow.
- Enter a plain-English description of your workflow. For example:
” Query revenue data by market segments. Filter by order count and all dates. Search web for comparable relevant market trends. Generate formatted summary reports providing market summary and look ahead per segment. ”
- Amazon Quick automatically generates the complete workflow with all the necessary steps.
- Optionally, you can add additional steps.
- Choose Run Mode to test the Flow.
- After your flow is created, share it with team members or publish it to your organization’s flow library, so everyone benefits from the same automation without having to rebuild it independently.
Figure 14: Create a Quick Flow to generate summaries and publish dashboards
For more complex flow, review weekly customer revenue summary flow as an example.
- Queries the
mv_customer_revenuematerialized view in Amazon Redshift for the latest weekly revenue figures by market segment. - Compares results against the prior week to calculate segment-level variance.
- Generates a formatted summary report and publishes it to the Customer Revenue & Segmentation Space.
- Sends a notification through email or Slack to finance, sales operations, and segment owners with a direct link to the updated dashboard.
- Flags any segment where revenue has declined more than a defined threshold, routing an alert to the appropriate owner for follow-up.
This flow transforms what might otherwise be a manual, multi-step reporting process into a fully automated pipeline, so stakeholders receive consistent, timely revenue insights without analyst intervention and saving analysts an estimated 3–5 hours per week. For detailed guidance on creating and managing flows, see Using Amazon Quick Flows. Also review Create workflows for routine tasks demo.
Cleanup
Consider deleting the following resources created while following this post to avoid incurring costs. We encourage you to use the trials at no cost as much as possible to familiarize yourself with the features described.
- Delete the Amazon Redshift Serverless workgroup and namespace.
- Delete Athena workgroup and S3 Buckets.
- Delete the Amazon Quick account used while following this post. If you used an existing account, delete the data sets, dashboards, topics, spaces, agents and flows created.
Conclusion
This integrated approach to business intelligence combines the power of AWS SQL analytics engines with Amazon Quick generative AI capabilities to deliver comprehensive analytics solutions. By following these implementation steps, you establish a foundation for traditional BI reporting, interactive dashboards, natural language data exploration, and intelligent workflow automation. The architecture scales from proof-of-concept implementations to production deployments, transforming how organizations access and act on data insights. For more information about Amazon Quick features and capabilities, see the Amazon Quick documentation. To learn more about Amazon Redshift, visit the Amazon Redshift product page. For Amazon Athena details, see the Amazon Athena product page.