AWS Compute Blog
Enhancing network observability with new AWS Outposts racks LAG metrics
When you deploy AWS Outposts racks, you can run AWS infrastructure and services in on-premises locations. Maintaining seamless connectivity, both to the AWS Region and your on-premises network, is fundamental to delivering consistent, uninterrupted service to your applications. Implementing an observability strategy that uses available network metrics is key to understanding the health of this connectivity.
In August 2025, we launched two new Amazon CloudWatch metrics, VifConnectionStatus and VifBgpSessionState, that helped provide greater visibility into these Layer 3 networking constructs. However, insight into Layer 2 networking was still missing. AWS has released a new metric LagStatus, that provides greater visibility into the hybrid infrastructure connectivity for both first-generation and second-generation Outpost racks.
Link aggregation group overview
Link aggregation combines multiple physical Ethernet connections into one logical link, referred to as a link aggregation group (LAG). This consolidation delivers benefits such as increased aggregate bandwidth and built-in redundancy through fault-tolerant connections between network devices. AWS Outposts uses LAG connections between Outpost network devices (ONDs) and customer network devices (CNDs). The links from each Outpost network device are aggregated into an Ethernet LAG to represent a single network connection.
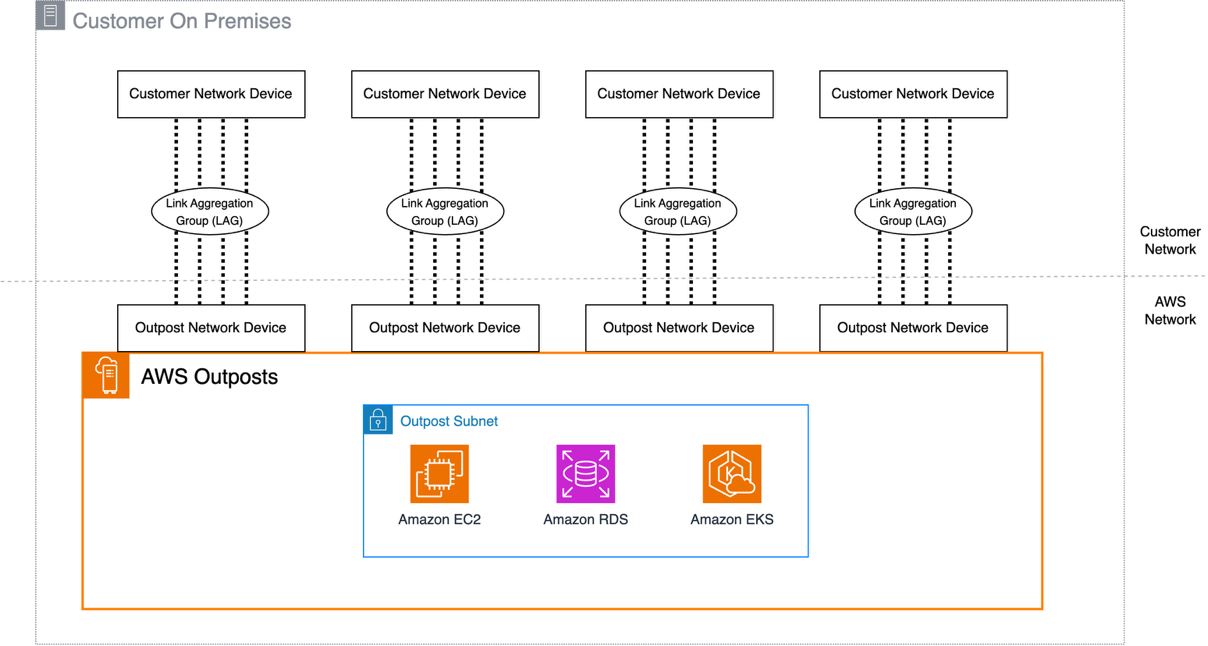
Figure : Second-Generation Outposts Rack network connections
Each LAG between an Outpost network device and a customer local network device is configured as an IEEE 802.1q Ethernet trunk. This enables the use of multiple VLANs for network segmentation between data paths. Each Outpost has the following VLANs to communicate with local network devices:
- Service link VLAN – Enables communication between the Outpost and customer network devices to establish a service link path to the AWS Region.
- Local gateway VLAN(s) – (If exists, and as single or multiple LGW routing domains), enables communication between Outpost and the customer network devices to establish a local gateway path to connect your Outpost subnets to the local area network.
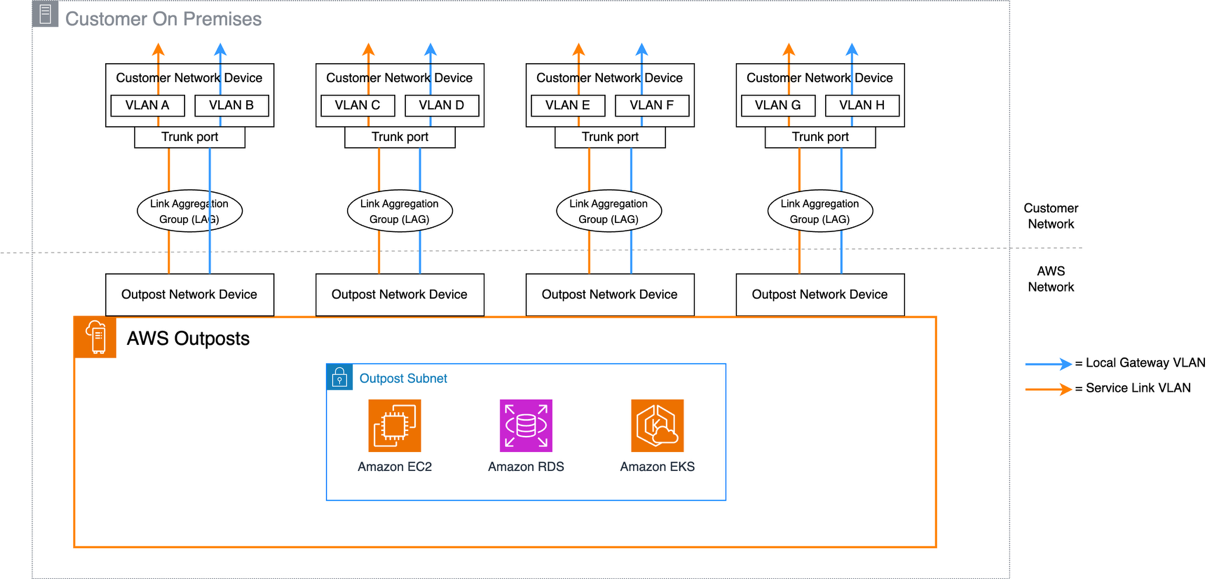
Figure : Second-Generation Outposts Rack VLAN layout
Using the LagStatus metric
The new LagStatus metric in CloudWatch provides visibility into the operational status of LAG connections between Outposts networking devices and on-premises infrastructure. The metric reports a binary status (1 for the LAG being UP, 0 for the LAG being down) and includes the OutpostId and LagId as dimensions to quickly identify non-operational resources.
You can view this metric on the CloudWatch console. As with all operational telemetry, access to these metrics should be appropriately restricted to authorized principals. The metric data points are published at 5-minute intervals, and like all CloudWatch metrics, there might be a time lag in the metric data being published. In the navigation pane, choose All metrics, followed by Outposts under the AWS namespaces section. The Outposts namespace can only be viewed by the Outposts owner account, unless CloudWatch cross-account observability is configured.
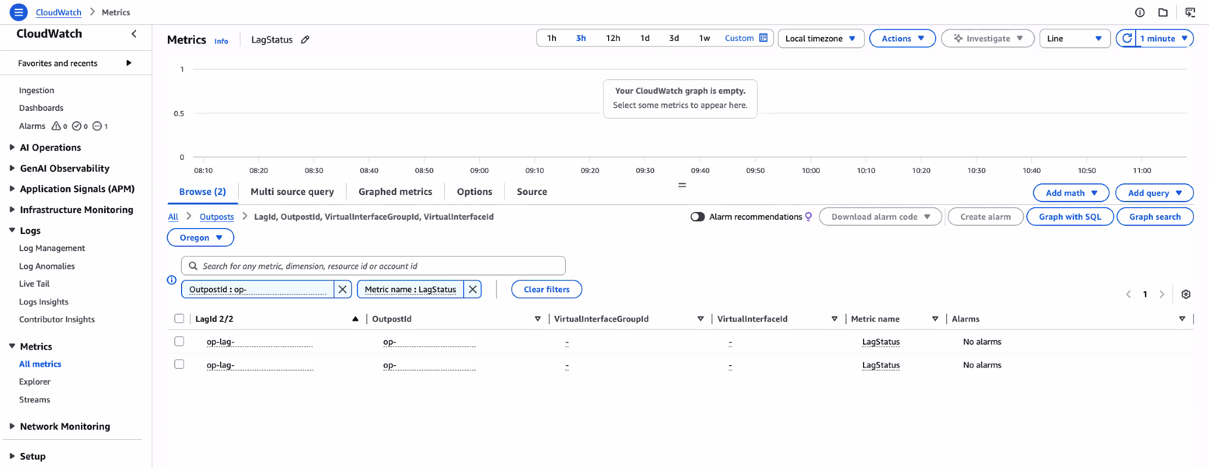
Figure : CloudWatch Metrics view of the LagStatus metric
While the LagStatus metric alone provides insight into the Outposts network connectivity, combining it with VifConnectionStatus and VifBgpSessionState delivers more immediate, actionable insights that expedite troubleshooting. In addition, to improve the clarity of the existing metrics, the related LagId is added as a new Outposts metric dimension. By observing the values of all three metrics, you can narrow down the potential cause of any issues. The following table gives some possible connectivity issue scenarios and how they can be identified using these metrics:
| LagStatus | LGW BGP | ServiceLink BGP | Potential issue |
| UP | UP | UP | Recommended state – all components working |
| UP | UP | DOWN | ServiceLink BGP issue – configuration issue |
| UP | DOWN | UP | LGW BGP issue – configuration issue |
| UP | DOWN | DOWN | Both BGP sessions down – configuration issue |
| DOWN | DOWN | DOWN | Lag configuration issue or Physical failure |
With these metrics, you can use CloudWatch Composite Alarms to alert operational teams when any of the components aren’t running as expected.
To create a composite alarm, alarms must first be defined for all three of the individual metrics. This can be done from the console, CLI, or AWS CloudFormation. Following the principle of least privilege, ensure that IAM permissions are restricted to the minimum actions required for CloudWatch alarm creation. For more information, see the CloudWatch documentation. If you prefer, you can configure these individual alarms without notification actions enabled to reduce potential notification noise. Each virtual interface (VIF) has its own set of metrics, so you would need to configure alarms for all VIFs used with your Outpost. The number of total VIFs will vary depending on the Outpost generation that’s deployed because of the different networking architectures.
First-generation Outposts racks use four VIFs per rack (two for Service Link, two for Local Gateway). Second-generation racks require a minimum of eight VIFs (four for Service Link, four for Local Gateway), because they support multiple local gateway routing domains, each with its own VIFs.
An example alarm configuration as seen in the console for a single VIF is shown in the following figure 4.
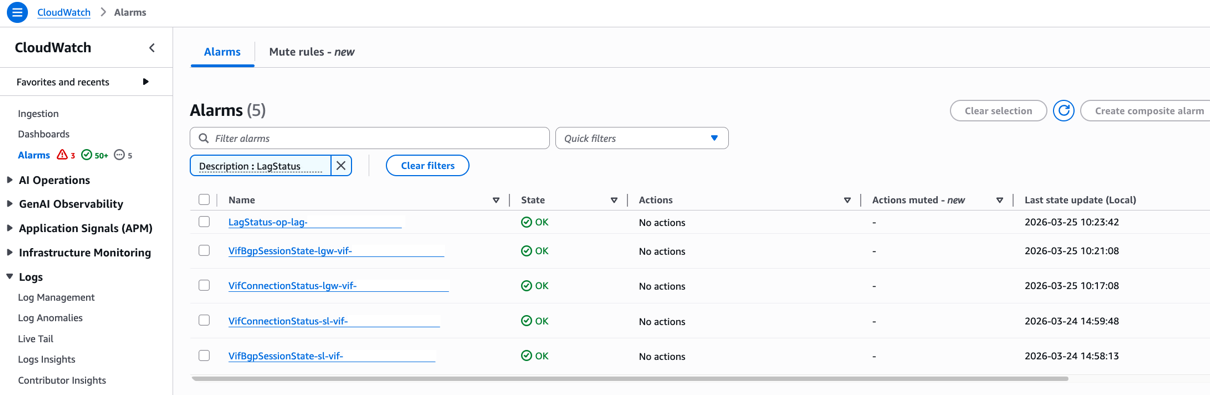
Figure : Individual CloudWatch alarms for VIF status
After these individual alarms are created, a composite alarm can be created that monitors for any of the component metrics going into an alarm status. In the following example, the AWS Command Line Interface (AWS CLI) is used to create the composite alarm called composite-alarm-lag1 and send a notification using an Amazon Simple Notification Service (Amazon SNS) topic called outpost-network-alarms. As this topic carries infrastructure health data, it’s recommended to encrypt it using an AWS Key Management Service key and restrict the subscription policy to authorized principals.
You can use this granular monitoring to quickly identify and troubleshoot connectivity issues, particularly in scenarios where LAG status is up but VIF BGP status is down.
Conclusion
This post provides details about the newly released LagStatus CloudWatch metric, and how this metric can be used with existing metrics such as VifConnectionStatus and VifBgpSessionState to build a comprehensive network connectivity observability solution. The LagStatus metric is now available in all commercial AWS Regions and the AWS GovCloud (US-East) and AWS GovCloud (US-West) Regions where Outposts racks are available, for both first-generation and second-generation racks at no additional cost.
For more information about Outposts rack networking patterns, see the Networking section of the Outposts High Availability Design and Architecture Considerations whitepaper.
Reach out to your AWS account team, or fill out this form to learn more about observability for Outposts.