AWS Contact Center
Visualize and optimize your Amazon Connect costs with the Cost Insight Dashboard
Contact center leaders continually seek enhanced visibility into their Amazon Connect costs to make informed operational decisions. Today, we’re introducing the Amazon Connect Cost Insight Dashboard, a powerful solution that transforms your raw billing data into actionable insights. This purpose-built tool provides comprehensive cost analysis capabilities specifically designed for contact center optimization, enabling you to identify efficiency opportunities while maintaining service excellence.
The Amazon Connect Cost Insight Dashboard offers comprehensive visibility into your contact center’s financial performance. It tracks monthly spending trends, breaks down costs by service components, and analyzes telephony expenses across countries and call directions. This dashboard enables channel cost comparisons, regional spending analysis, and provides key efficiency metrics like cost per contact. This powerful tool equips contact center managers with the data needed to make informed decisions and optimize operations.
How it works
The solution architecture uses AWS services to transform your billing data into accessible insights:
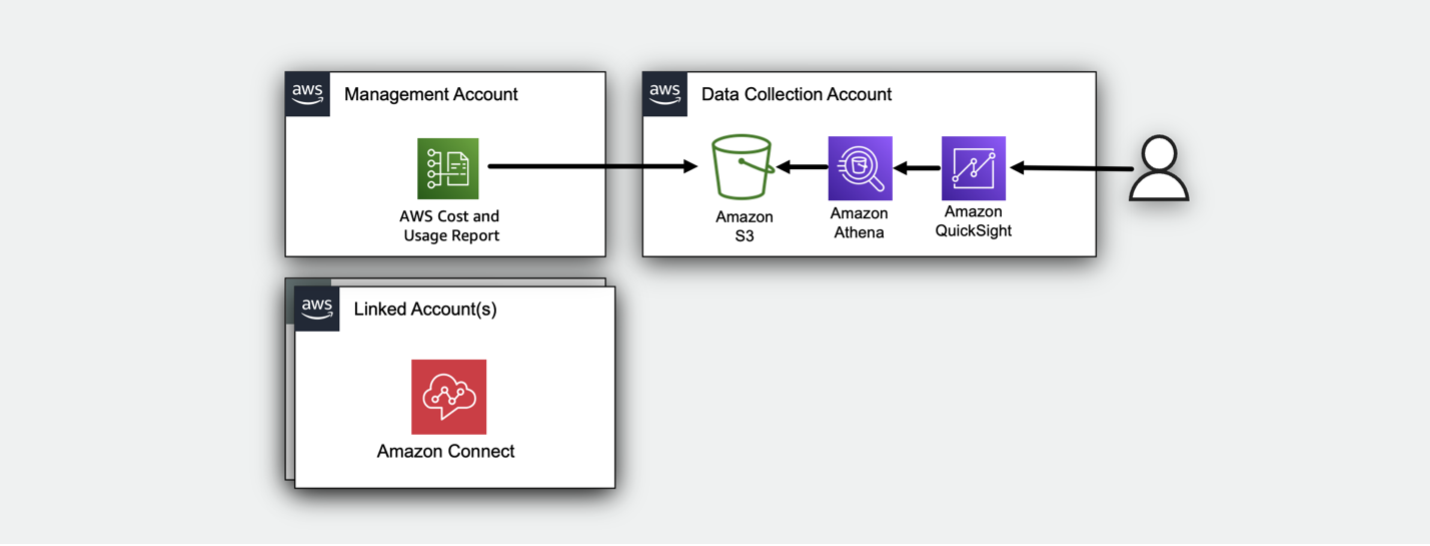
Figure 1: Cloud Intelligence Dashboards Framework Architecture Review
- AWS Cost and Usage Reports provide detailed cost data delivered to an S3 bucket
- AWS Glue crawlers create and maintain a data catalog of your cost information
- Amazon Athena queries extract and process the relevant Amazon Connect data
- Amazon QuickSight transforms this data into interactive visualizations
Six essential views for Amazon Connect cost analysis
Overview: Delivers high-level visibility into Amazon Connect usage and costs. Splits charges between Amazon Connect service and telecom. Shows month-over-month trends and current month metrics. Identifies top countries for inbound and outbound calls. Breaks down costs by account, region, and service.
Contact center: Tracks overall AWS service consumption within Amazon Connect-enabled accounts. Shows service adoption trends excluding Amazon Connect costs for clearer visibility. Reveals growth patterns of integrated services like Amazon Lex, Amazon DynamoDB, Amazon S3 etc. Provides month-over-month analysis of supporting services. Maps costs across the complete contact center solution. For example, the Bar chart shows Contact Center usage by Service Type (excluding Connect costs), giving visibility into additional services used alongside Connect. This helps customers understand their total technology spend beyond core Connect services.
Amazon Connect: Isolates core Amazon Connect service costs from telecom charges. Maps usage patterns across multiple regions and accounts. Shows detailed breakdown of service components – customer minutes, chat interactions, tasks, and agent evaluations. Computes per-unit costs for each service component.
Telecom: Dedicated to contact center telecom usage analysis. Breaks down inbound/outbound minutes and phone types. Maps telecom usage and costs by country. Visualizes global telecom usage on a world map. Pinpoints top cost contributors and expensive destinations.
Daily usage: Offers 30-day granular view of usage. Separates data into inbound, outbound, and phone numbers. Enables drill-down to specific days, countries, and calls. Uses bubble charts to visualize cost-quantity-price relationships. Facilitates investigation of individual call costs.
Call details: Aggregates usage types per contact ID. Visualizes distribution of call costs and durations. Flags most expensive and longest duration calls. Shows call duration patterns by country. Allows deep dive into specific call details and usage types.
Contact search: Provides advanced filtering for specific contacts. Enables searches by price, duration, and country. Offers geographical view of contact center usage. Supports detailed analysis of individual contact costs and characteristics.
Amazon Connect Cost Insight Dashboard demo
To experience the dashboard’s capabilities before deployment, explore our interactive demo . This demonstration uses sample data to showcase the dashboard’s intuitive interface and powerful visualizations.
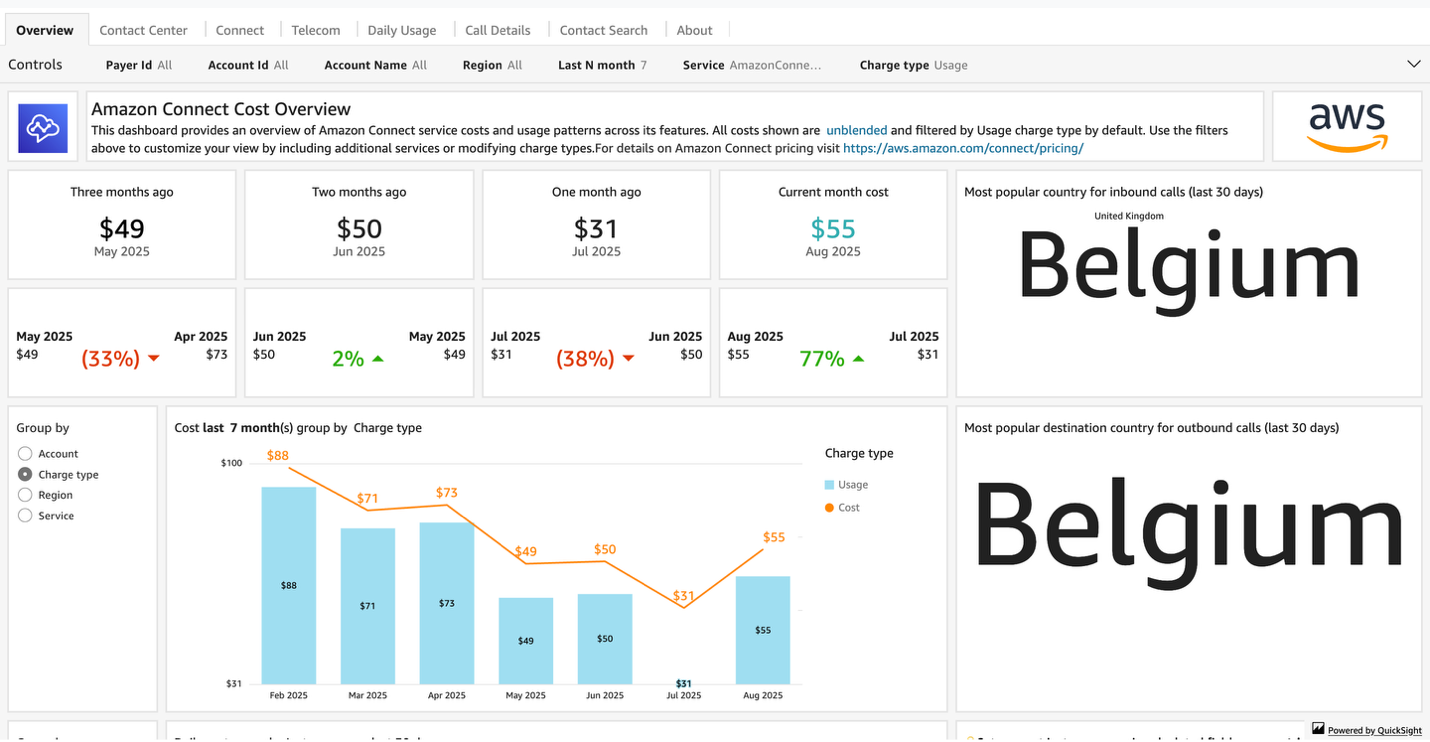
Figure 2: Amazon Connect Cost Insight Dashboard demo
The demo highlights key features including cost breakdowns by service component, regional spending comparisons, and channel cost analysis. FinOps teams, contact center managers, DevOps engineers, and business leaders can immediately see how these insights apply to their specific roles and responsibilities.
Contact center cost optimization examples

Cost analysis through high-value call monitoring
By accessing the call details view, you can pinpoint and analyze your top 50 highest-cost calls. Take for example a $0.62 call – selecting this specific data point instantly filters the view to show its complete breakdown. The dashboard reveals both end customer and toll-free minute allocations, clearly displaying the unit price components that add up to $0.62. This detailed visibility into expensive calls helps identify patterns in high-cost interactions, enabling targeted cost reduction strategies and more efficient resource allocation.
Duration-based cost analysis by country
The country-specific call duration distribution reveals cost patterns across different time segments, from quick 10-second interactions to extended 20-minute conversations. For example, examining Belgium’s call patterns by selecting its duration bucket shows all related contact IDs as interactive bubbles, each with associated costs. Clicking through to specific contacts unveils detailed cost breakdowns between end customer and toll-free minutes. This granular view, combined with contact lens analytics, helps identify which call durations and countries drive higher costs, enabling data-driven decisions for optimizing international call routing, staffing adjustments, and process improvements to reduce operational expenses.
Call to action
Get complete visibility into your Amazon Connect costs. This dashboard reveals your usage patterns and spending across all channels, helping you identify optimization opportunities immediately.
Access our workshop guide to implement this solution and optimize your contact center costs.
About the Authors