Containers
Automate java performance troubleshooting with AI-Powered thread dump analysis on Amazon ECS and EKS
Picture this: your containerized Java application that was running smoothly yesterday is now consuming 90% CPU and barely responding to user requests. Now your customers are experiencing timeouts, and your ops team is under pressure to resolve the issue quickly. When debugging unresponsive applications or excessive CPU consumption, one of the most valuable diagnostic tools available is the thread dump. A thread dump provides a snapshot of the threads in a Java Virtual Machine (JVM) at a specific moment, revealing thread states, stack traces, and lock information. While thread dumps are essential for diagnosing complex performance issues, traditional thread dump analysis presents several challenges. Analyzing thread dumps requires deep JVM expertise. In many teams, only a handful of engineers know how to interpret them, which slows down troubleshooting. Manual analysis can also be time‑consuming, taking hours, if not days to sift through, especially with hundreds of threads. Furthermore, this reactive approach only identifies issues after degradation has already occurred, potentially impacting your customers.
Generative AI can make proactive, expert-level troubleshooting faster and more straightforward for developers and operations teams. In this blog post, we’ll walk through how to build an automated thread dump analysis pipeline that uses Prometheus for monitoring, Grafana for alerting, AWS Lambda for orchestration, and Amazon Bedrock for AI‑powered analysis. The solution works on both Amazon Elastic Container Services (Amazon ECS) and Amazon Elastic Kubernetes Service (Amazon EKS), helping teams go from raw thread dumps to actionable insights within seconds of detecting an issue.
The solution code and deployment instructions are available through Java on AWS Immersion Day Workshop and on GitHub.
Overview of the solution
The thread dump analysis workflow includes the following steps:
- Continuous Monitoring — Prometheus scrapes JVM thread count metrics from containerized Java applications running on Amazon ECS or EKS.
- Threshold Detection — Grafana monitors thread count metrics and triggers alerts when predefined thresholds are exceeded.
- Automated Collection — When an alert fires, Grafana sends a webhook to AWS Lambda containing metadata about the affected container.
- System Detection — The Lambda function analyzes the alert payload to determine whether the application runs on ECS or EKS.
- Thread Dump Capture — Based on the system, Lambda captures thread dumps using different methods:
- Amazon ECS: Direct HTTP calls to Spring Boot Actuator endpoints using container IP addresses.
- Amazon EKS: Kubernetes API execution of native JVM diagnostic commands.
- AI Analysis — The captured thread dump is sent to Amazon Bedrock, which uses LLMs to analyze thread states, identify deadlocks and performance bottlenecks, and generate structured recommendations.
- Storage and Reporting — Both raw thread dumps and AI analysis reports are stored in Amazon S3, and results are available for immediate review.
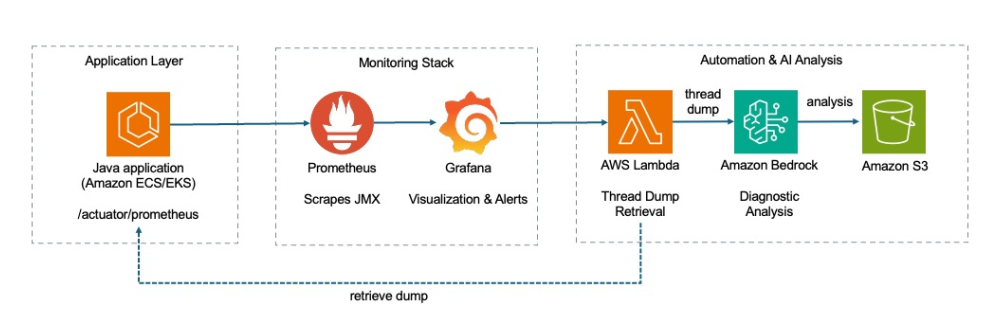
Figure 1: Observability data flow
The automated thread dump analysis solution is deployed as infrastructure as code (IaC) using AWS CloudFormation. Prometheus and Grafana provide monitoring and alerting capabilities, while Amazon Bedrock serves as the primary engine for intelligent thread dump analysis.
AWS Lambda is used to orchestrate the thread dump collection workflow and handle system-specific collection methods for ECS and EKS. The solution automatically detects the container system and adapts its collection strategy accordingly. Thread dumps and AI-generated analysis reports are stored in Amazon S3 for historical reference and trend analysis.
The monitoring infrastructure continuously scrapes JVM metrics from Spring Boot applications using Prometheus. When thread count thresholds are exceeded, Grafana triggers a webhook that invokes the Lambda function. The function then captures thread dumps using system-appropriate methods and sends them to Amazon Bedrock for analysis using large language model (LLM).
Prerequisites
The solution is based on the infrastructure as a code (IaC) of “Java on AWS Immersion Day”, which streamlines the setup of the environment. You only need an AWS account and AWS CloudShell to bootstrap the environment.
Walkthrough
Step 1: Deploying the base infrastructure
To get started with automating Java thread dump analysis, use IaC to create the solution infrastructure. Here, you create a Java app called “UnicoreStore” that will troubleshoot later. Complete the Workshop setup step under the In your own AWS account tab.
The initial setup of the workshop only involves the deployment of an AWS CloudFormation-template in AWS CloudShell:
Step 2: Setting up container environment and deploy the monitoring and analysis stack
Complete the workshop modules for monitoring setup:
- Preparation – Configure the monitoring infrastructure
- Run the script
~/java-on-aws/infrastructure/scripts/setup/jmx-bedrock-setup.shin VSCode Server Terminal
Implementation details
While the previous walkthrough showed how to deploy and configure the automated thread dump analysis solution, it’s just as important to understand the implementation details. These details matter when you want to customize the solution, troubleshoot issues, or extend it for your organization’s specific needs. In this section, we’ll dig into the key architecture decisions, code structure, and integration patterns that make the solution work reliably in both ECS and EKS. With this foundation, you’ll be able to adapt the solution for other Java frameworks, connect it with existing monitoring setups, customize the AI prompts for domain‑specific insights, and even experiment with advanced use cases such as automated remediation or predictive performance analytics.
Design principles
The thread dump automation solution follows the below guiding principles:
- System abstraction to support multiple container orchestration systems
- Event‑driven architecture for real‑time responsiveness
- Modular components to simplify maintenance and future extensions.
JMX metrics with Spring Boot
Our UnicornStore Spring Boot application showcases a sophisticated approach to observability and monitoring in cloud-native Java applications running on Amazon EKS and Amazon ECS. By using Spring Boot Actuator with spring.jmx-enabled=true and integrating Micrometer with Prometheus registry, the application provides comprehensive metrics exposure through multiple channels. Beyond standard Java Virtual Machine (JVM) metrics, the MonitoringConfig class automatically enriches metrics with contextual tags including cluster identification, container metadata, and environment-specific information for both Amazon ECS and Amazon EKS deployments. This additional metadata is required in our Lambda-function to decide how to create the appropriate thread dump.
Automated thread dump collection via Grafana webhook
The Lambda function serves as the orchestration layer that bridges Grafana monitoring alerts with thread dump collection across heterogeneous container environments. When Grafana detects anomalous JVM thread behavior and triggers an alert, the function parses the incoming webhook payload to extract deployment metadata—including the cluster type, cluster name, task- or pod-id, container name, namespace (required for Amazon EKS), and IP address of the container (required for Amazon ECS). The function employs environment-specific collection strategies: for Amazon ECS deployments, it leverages the extracted container IP to invoke Spring Boot Actuator’s /actuator/threaddump endpoint directly.
For Amazon EKS environments, it utilizes the Kubernetes API to execute native JVM diagnostic commands (jcmd Thread.print or jstack) within the target pod.
AI-powered analysis with Amazon Bedrock
The Lambda function leverages Amazon Bedrock to transform raw thread dumps into actionable performance insights, minimizing the need for specialized JVM expertise. Once a thread dump is captured, the function constructs a structured prompt that instructs the model to analyze thread states, identify performance bottlenecks, detect deadlocks, and provide optimization recommendations across six key sections: executive summary, thread states, key issues identification, optimization recommendations, detailed technical analysis, and system context analysis.
Triggering a thread dump analysis
After deploying the solution, log into Grafana and explore the metrics sent by your application. You can find more information how to log into Grafana here. If you choose Explore, you can build a query. For our purpose, we use the jvm_threads_live_threads metric. If you choose Run query, Grafana starts showing a graph.
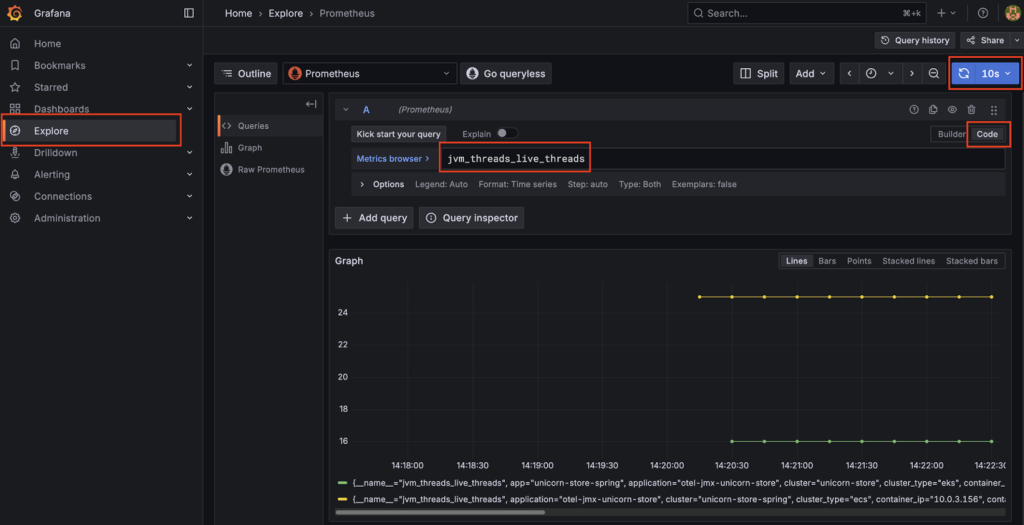
Figure 2: Metrics exploration in Grafana
We see additional data like the application name, cluster name, cluster type, namespace (in ECS this would be a default value), and the pod or task id (depending if it’s EKS or ECS). This information is necessary to create a thread dump initiated by our AWS Lambda function.
Now let’s start 500 threads in our application and trigger an alarm in Grafana. First we have to get the endpoint of the application, for Amazon ECS this can be done using:
SVC_URL=http://$(aws elbv2 describe-load-balancers —names unicorn-store-spring —query "LoadBalancers[0].DNSName" —output text)
For Amazon EKS, we have a slightly different approach:
SVC_URL=http://$(kubectl get ingress unicorn-store-spring -n unicorn-store-spring -o jsonpath='{.status.loadBalancer.ingress[0].hostname}')
Now we can trigger the creation of 500 threads in our UnicornStore-application by sending an HTTP POST request to the corresponding API-endpoint:
curl —location —request POST $SVC_URL'/api/threads/start' —header 'Content-Type: application/json'; echo
sleep 2
curl —location —request GET $SVC_URL'/api/threads/count' —header 'Content-Type: application/json'; echo
The API-endpoint is implemented in ThreadGeneratorService which is a Spring service designed to create artificial CPU load for testing. This service can spawn multiple threads that perform dummy computational work to simulate high CPU usage, in this case, 500 threads are being created. Now you can navigate to JVM Metrics – EKS & ECS under Unicorn Store Dashboards from Dashboards in the left navigation, to see the current state of the JVM.
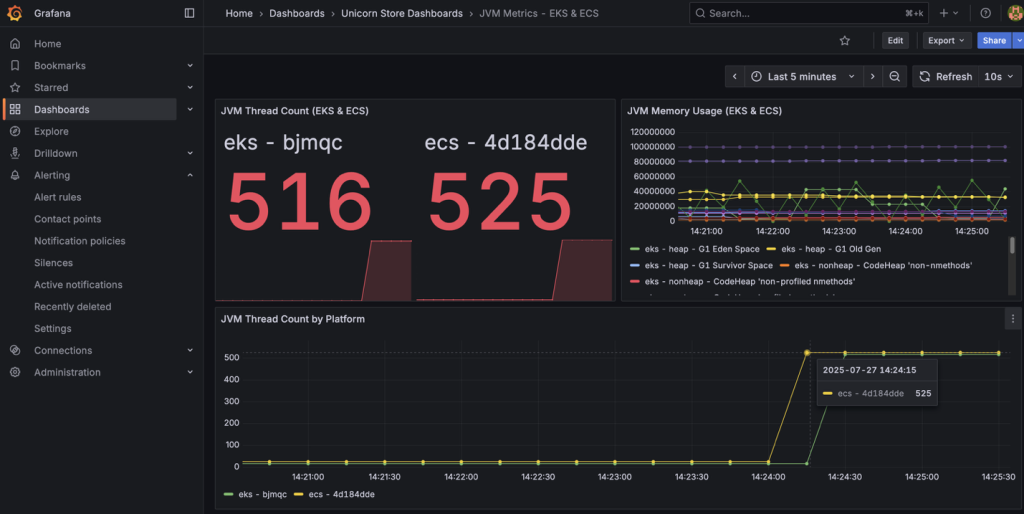
Figure 3: Grafana alert triggering
After a short period of time, you can see that our Grafana alert is triggering. You can find the Alert rules under Alert rules in Alerting.
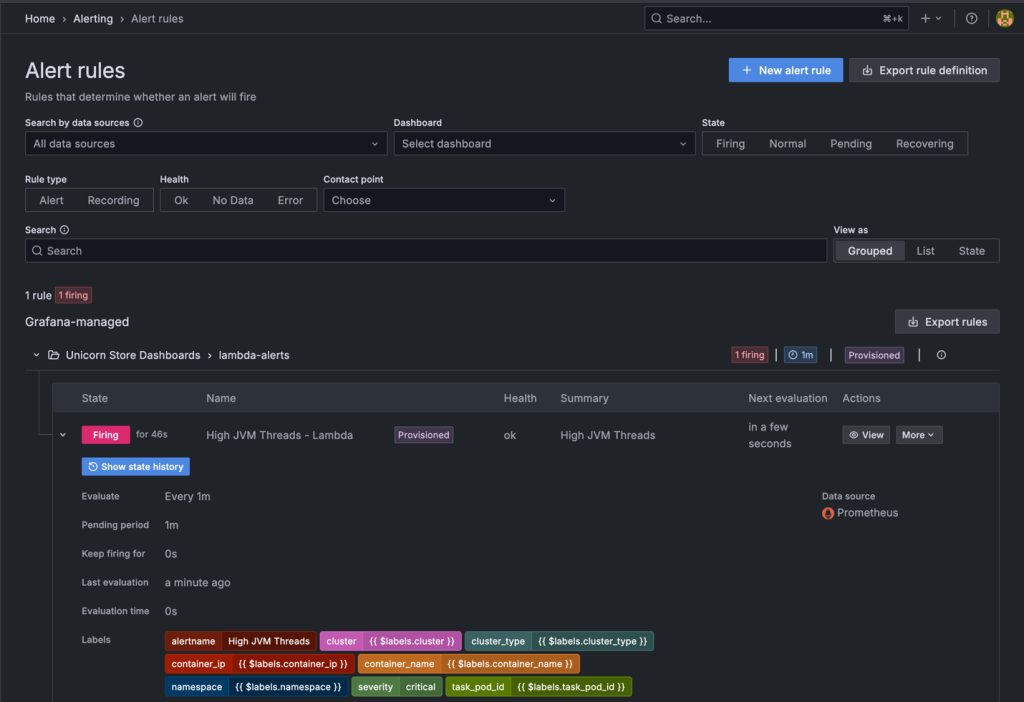
Figure 4: Grafana alert rules
The Grafana alert is calling the thread dump-Lambda function using a webhook 60s after the alarm is firing. Approximately one minute later, you can take a closer look into your Amazon S3 bucket which contains thread dumps as well as thread dump analysis-files.
Example Analysis Output
Here’s an example of the analysis provided by Amazon Bedrock containing important information and suggestions how to improve the application:
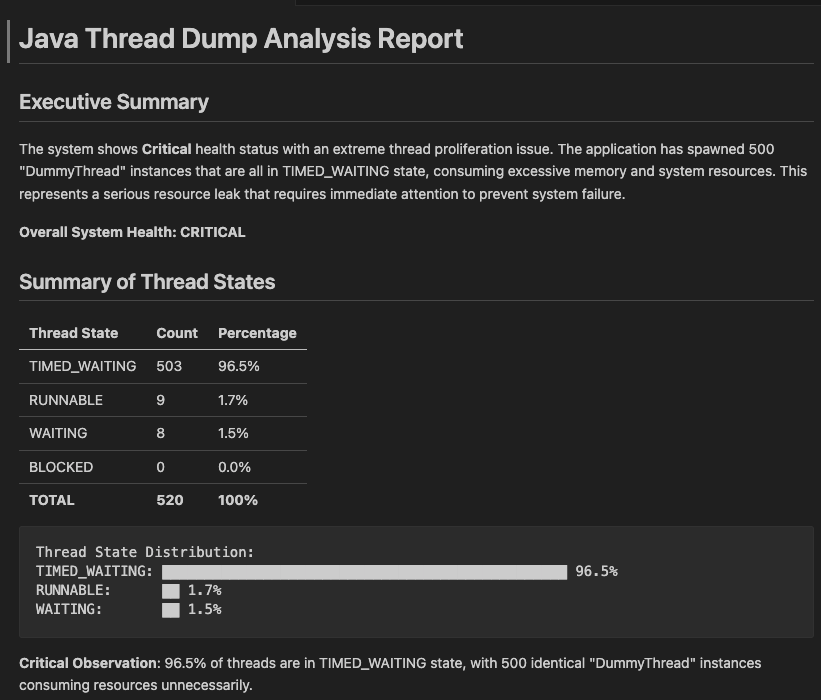
Figure 5: Thread dump analysis report
Cleaning up
To remove the resources created by this solution, run the following commands in the VS Code terminal:
Close the tab with VS Code, open AWS CloudShell, and complete the cleanup:
aws cloudformation delete-stack --stack-name unicornstore-stack
Delete the S3 bucket that you used to deploy the AWS CloudFormation template. Check the remained resources and stacks and delete them manually if necessary.
Conclusion
Automating thread dump analysis with Amazon Bedrock integration brings real improvements to the day‑to‑day troubleshooting of Java applications. You can now proactively troubleshoot your application rather than reactive firefighting. Instead of waiting for a JVM expert to step in and parse dumps manually, teams can now get diagnostic insights within seconds of an alert. This shortens the gap between detecting a problem and starting to fix it, while also making JVM performance issues accessible to engineers who don’t have deep thread dump expertise. Further, dumps and their AI‑generated analyses are stored in Amazon S3, creating a history that teams can use for spotting recurring issues and long‑term trends. The same architectural patterns can be extended to other diagnostic tools such as heap dump analysis, log analysis, or even automated remediation workflows.
We hope we have given you some ideas on how you can automate thread dump analysis for Java applications using AWS services and Open Source Software. If you want to learn more about Java performance optimization in Amazon EKS, you can find a blog post about async-profiler here. Please feel free to explore the source repository and submit enhancements to make Java performance troubleshooting even better for the community.
About the authors
 Stacey Hou is a Senior Product Manager – Technical at AWS, where she focuses on GenAI initiatives and observability for Amazon Elastic Container Service (ECS). She works closely with customers and engineering teams to drive innovations that simplify the experience of building, operating, and troubleshooting containerized applications.
 Sascha Möllering has been working for more than ten years as a Solutions Architect and Solutions Architect Manager at Amazon Web Services EMEA in the German branch. He shares his expertise with a focus on Automation, Infrastructure as Code, Distributed Computing, Containers, and JVM in regular contributions to various IT magazines and blogs.