AWS Database Blog
Cross-account and cross-Region monitoring for Amazon RDS and Aurora with Database Insights
This post shows you how to set up centralized cross-account and cross-Region monitoring for Amazon Relational Database Service (Amazon RDS) and Amazon Aurora databases using Amazon CloudWatch Database Insights. It covers all supported Amazon RDS engine types, including MySQL, PostgreSQL, SQL Server, Oracle, and MariaDB, as well as Amazon Aurora MySQL-Compatible and PostgreSQL-Compatible editions. Whether your databases are spread across two AWS accounts or ten, and across one Region or several, this walkthrough gives you a single monitoring account with visibility across your entire database fleet.
What Amazon CloudWatch Database Insights monitors
Amazon CloudWatch Database Insights is the next generation of database performance monitoring on AWS, building on the foundation of Performance Insights with a broader fleet-level view across your entire database fleet rather than one instance at a time. It tracks wait events, resource consumption, connection patterns, and query performance so you have the context to diagnose issues quickly. For supported engine types, see the introduction earlier in this post.
Database Insights captures:
- Query performance and top SQL.
- Wait events.
- CPU, memory, storage, and network utilization.
- Database connection counts.
- Performance telemetry and logs.
This visibility helps you identify and troubleshoot database performance issues across linked accounts and configured AWS Regions from a single monitoring account.
When to use cross-account monitoring and its operational impact
Most teams running AWS at scale split workloads across separate accounts: production in one, staging in another, dev and shared services elsewhere. That structure makes sense for security and cost control. The problem shows up during troubleshooting, when correlating metrics across these environments means signing in to multiple accounts, switching Regions, and repeating the same steps before you can identify the root cause.
Global workloads make this harder still. If your databases run in us-east-1, eu-west-1, and ap-southeast-2, a single traffic spike can mean checking three Regions before you even know where to focus. Note that the Fleet Health dashboard supports up to three AWS Regions at once when cross-account and cross-Region monitoring is active. For large global setups, plan your monitoring layout with that limit in mind.
Cross-account Database Insights monitoring addresses this by routing visibility through a central monitoring account. That account gets read-only access to database metrics shared by your source accounts. It can view the shared monitoring data, but it can’t modify database resources in those accounts. This means observability only, with no configuration changes and no accidental deletions.
Two terms come up throughout this post, so it is worth defining them upfront:
Key terminology
Monitoring account – A central AWS account that views and interacts with observability data from multiple source accounts. It has read-only access and can’t modify or delete databases in source accounts.
Source account – An AWS account that contains Amazon RDS or Amazon Aurora database instances and generates observability data shared with the monitoring account.
With cross-account and cross-Region monitoring configured, operational teams can view Amazon RDS and Amazon Aurora database performance data from linked accounts and configured AWS Regions through a centralized monitoring account. This helps reduce operational overhead, simplifies troubleshooting workflows, and streamlines identification of performance anomalies without repeated console navigation or account switching. For example, an engineer investigating a slow query across three accounts and two Regions previously required six separate console sessions to gather metrics, wait events, and query data. With a centralized monitoring account, the same investigation runs from a single dashboard, reducing the number of console switches to one. For environments operating across multiple AWS accounts and Regions, this approach can meaningfully reduce mean time to identify database performance issues during incidents.
Prerequisites for cross-account monitoring
Before you start, check that the following are in place. Skipping these might cause the setup to fail partway through.
AWS Identity and Access Management (IAM) permissions
You need permissions to configure CloudWatch cross-account observability, create and manage IAM roles, create AWS CloudFormation stacks, and configure Amazon RDS and Amazon Aurora monitoring settings. See required IAM permissions for cross-account setup for full details on required permissions for cross-account monitoring.
AWS infrastructure
- At least two AWS accounts: one monitoring account and one or more source accounts (see Key terminology earlier in this post for definitions).
- Permissions to create and manage IAM roles across the monitoring and source accounts.
- Amazon RDS or Aurora instances running supported engine versions. For the full list of supported engine versions, instance classes, and AWS Regions, see Amazon RDS for Database Insights and Amazon Aurora for Database Insights.
- Database Insights enabled on the instances you want to monitor (either Standard mode or Advanced mode).
Note: Database Insights Advanced mode and Enhanced Monitoring incur additional charges. Review the Amazon CloudWatch pricing page before you enable these features.
CloudWatch configuration covered in this post
- CloudWatch cross-account observability setup in monitoring account.
- Cross-account cross-Region CloudWatch console access enabled.
- Data sharing configured (Logs, Metrics, Traces, and Application Signals).
- Appropriate permissions granted in the monitoring account (CloudWatch automatic dashboards and read-only access for Database Insights).
Optional (for advanced features)
- Enhanced Monitoring enabled on your databases if you plan to use Advanced mode features like OS-level metrics.
Set up central monitoring
The monitoring account is where you spend most of your time after setup is complete. It’s the central account that aggregates read-only data from linked source accounts. Here’s how to configure it.
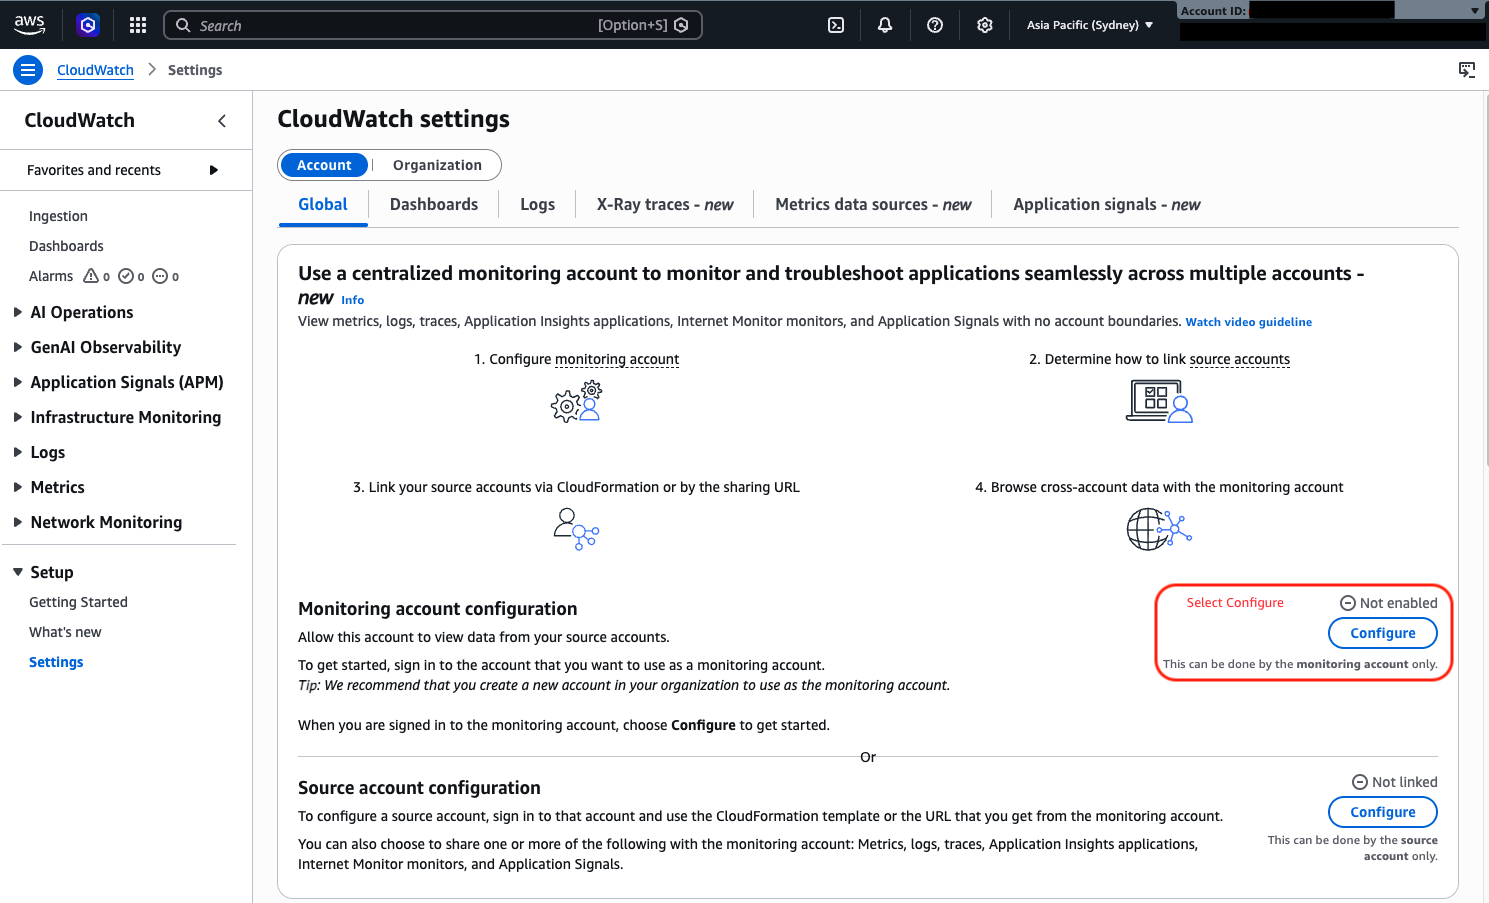
- Open the Amazon CloudWatch console, select the AWS Region, and choose Settings in the left navigation pane.
This walkthrough uses the Asia Pacific (Sydney) ap-southeast-2 Region. The steps are identical for any other Region you want to configure.
- In the Monitoring account configuration section, select Configure.
Configuring your monitoring account
- Choose the data types to share with the monitoring account (for example, Logs, Metrics, and Traces and Application Signals).
- Paste the source account IDs (SrcAcc1, SrcAcc2, SrcAcc3).
- Choose Configure.
A confirmation message, “You have successfully enabled the monitoring account,” appears at the top of the settings page.
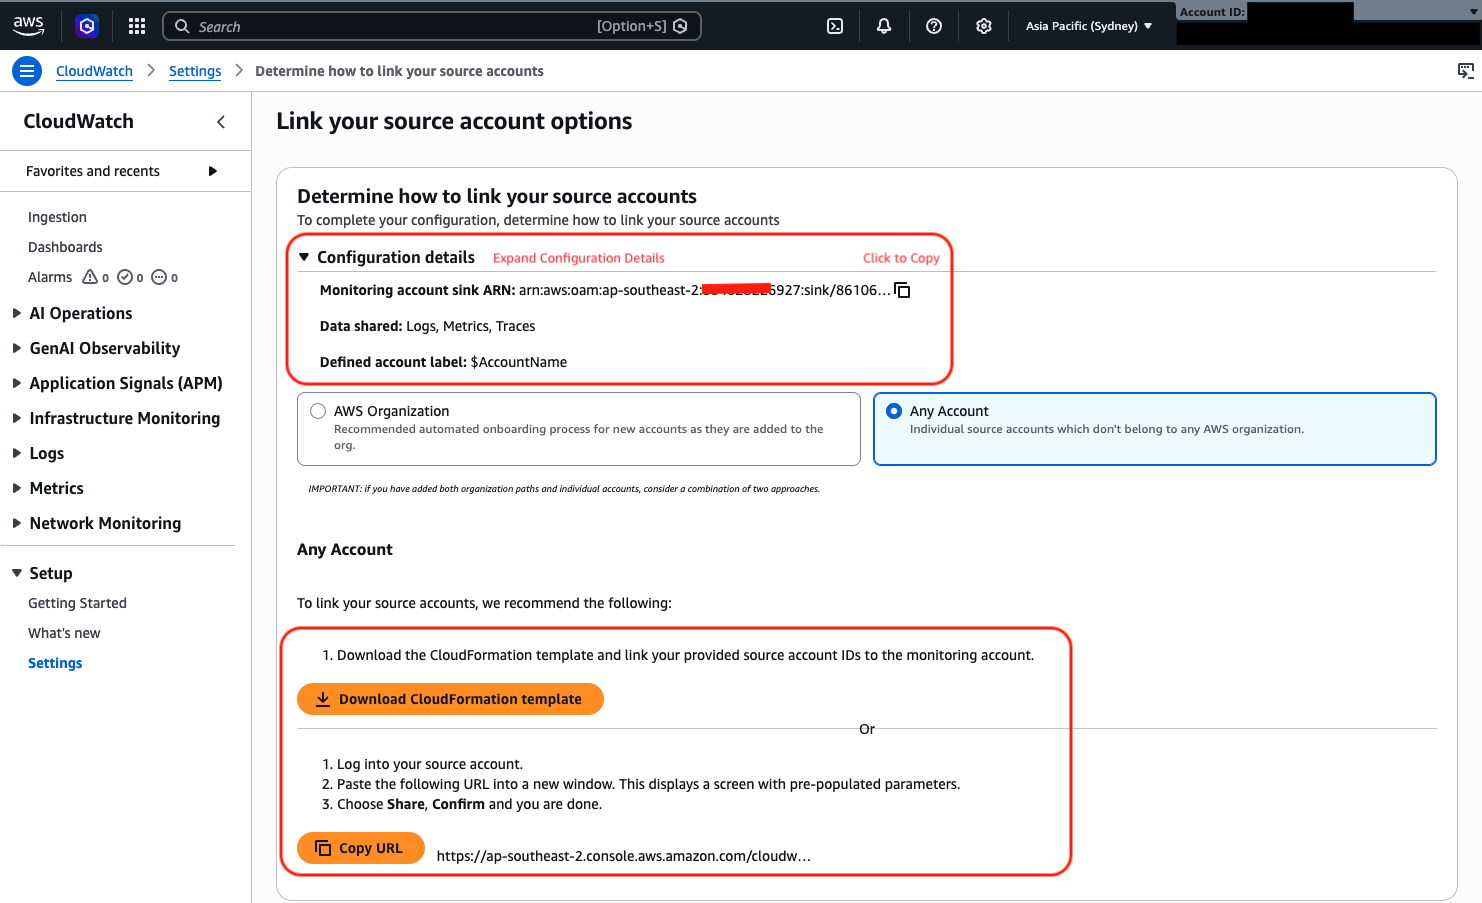
- Before you link your source account, either download the AWS CloudFormation template, copy the URL, or collect information from the configured monitoring account. This includes the monitoring account sink Amazon Resource Name (ARN), which you use in source account linking.
There are two main ways to link source accounts. You can use AWS Organizations to link accounts in bulk, or link individual accounts one at a time. This walkthrough covers the individual account approach.
On the Resource to link accounts page, you have the following options:
- Option 1: The quickest is to download the AWS CloudFormation template or copy the generated URL and share it with whoever manages your source accounts. Both options automate the linking steps on the source side.
- Option 2 (manual): If you want to configure manually, expand the Configuration details section and copy the Monitoring account sink ARN and save it. You need this when linking the source account.
Linking the source account to the monitoring account
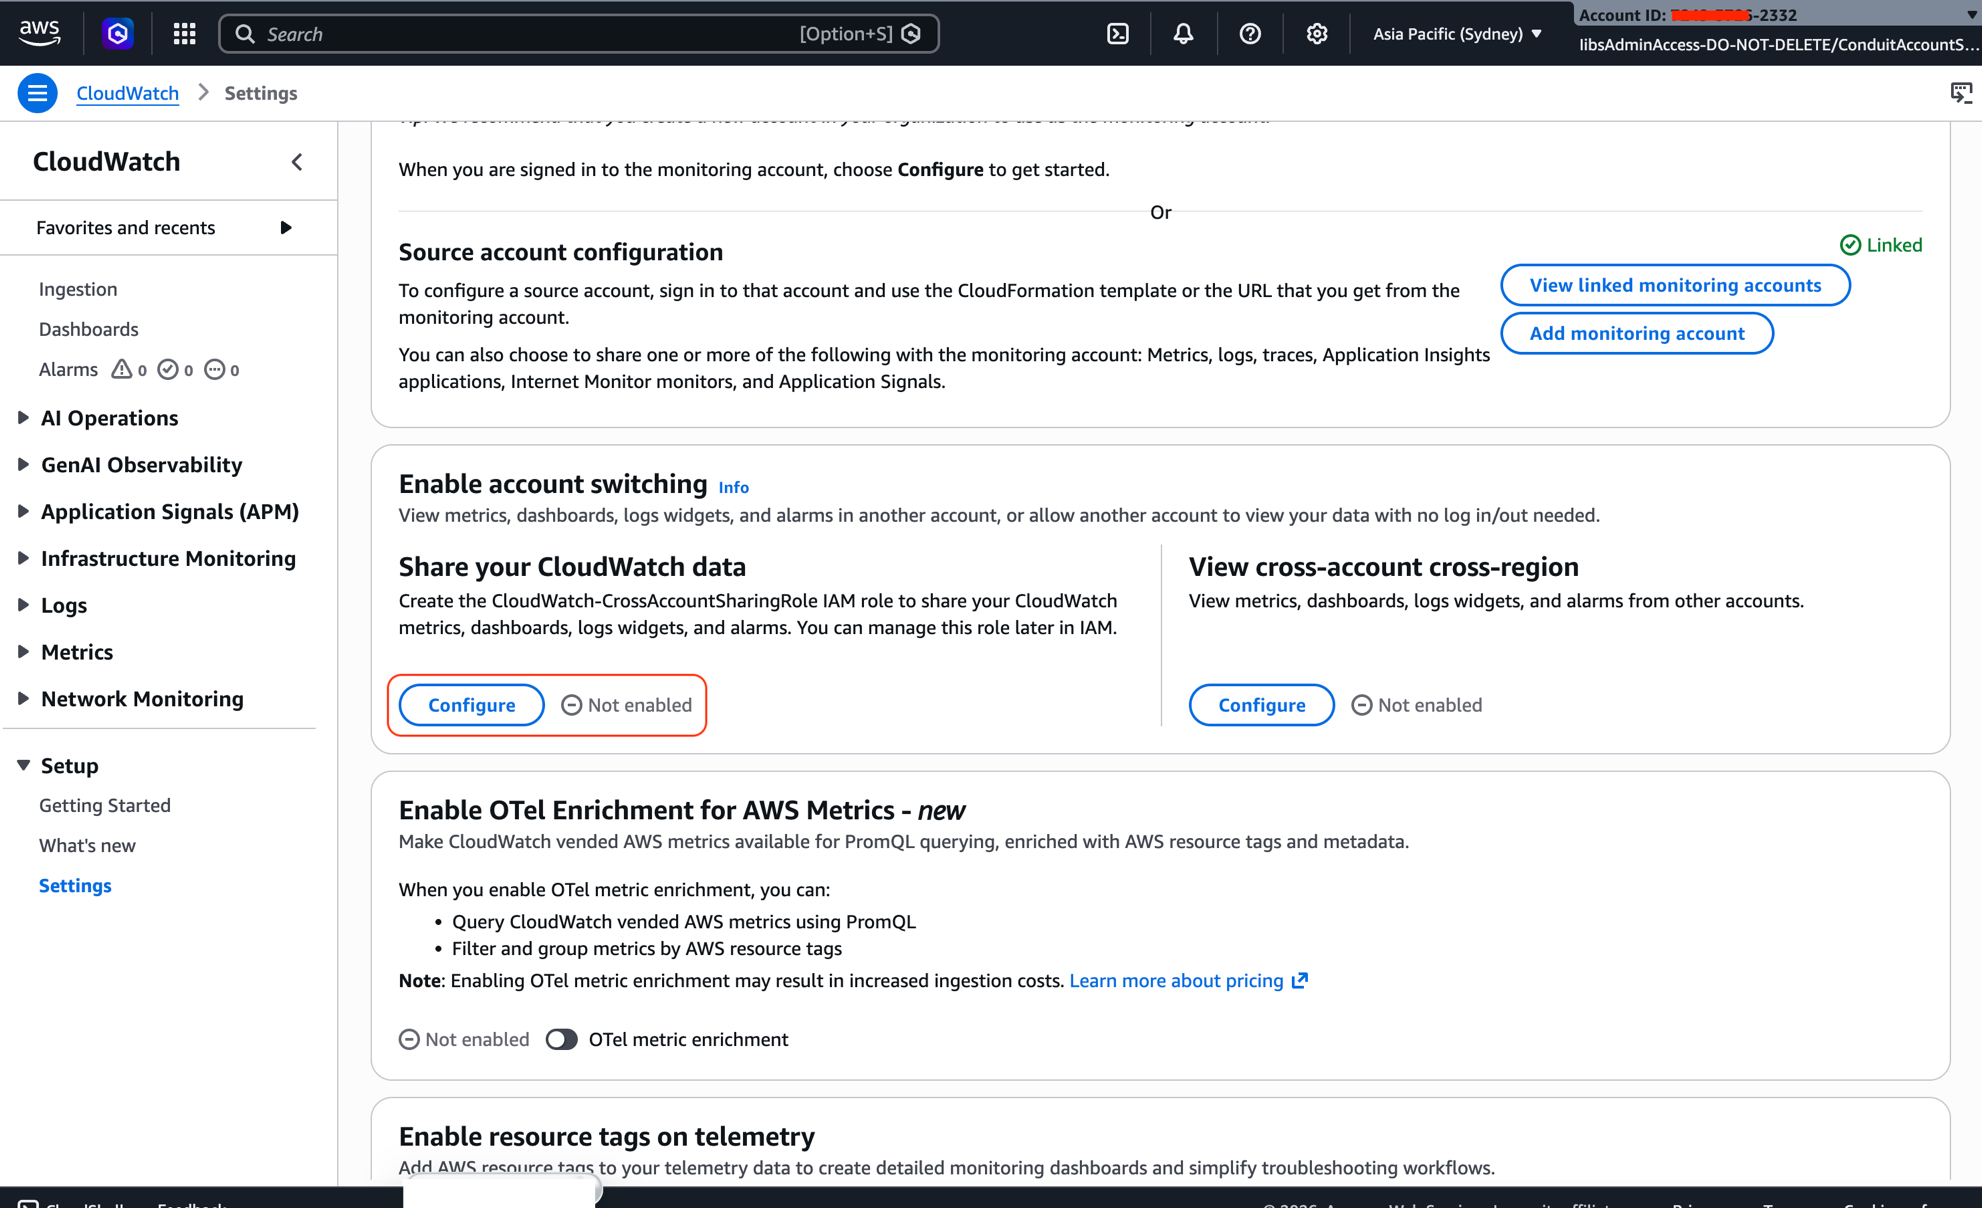
- After you link the source account, enable cross-account cross-Region functionality. Use the CloudWatch console to set up a monitoring account to view cross-account CloudWatch data.
The Amazon CloudWatch cross-Region console setting is global, which means you only need to configure it once per account. It applies across configured Regions automatically after you save.
- Under View cross-account cross-Region choose Configure to share your CloudWatch data.
Enabling cross-account and cross-Region monitoring
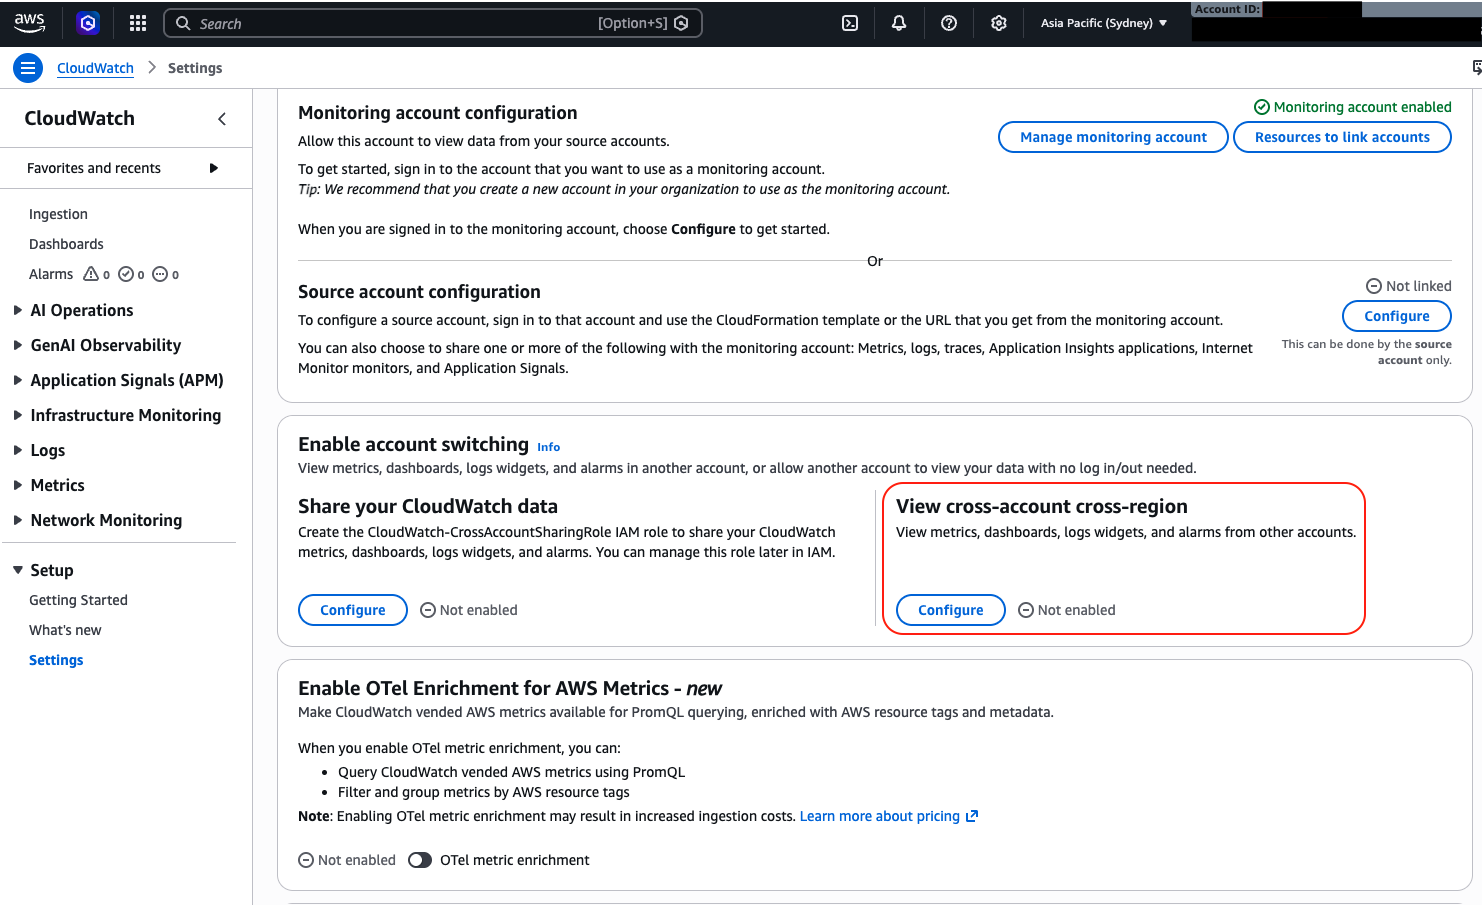
- Choose one of the following options based on your use case and choose Save changes. View cross-account cross-Region is now enabled.
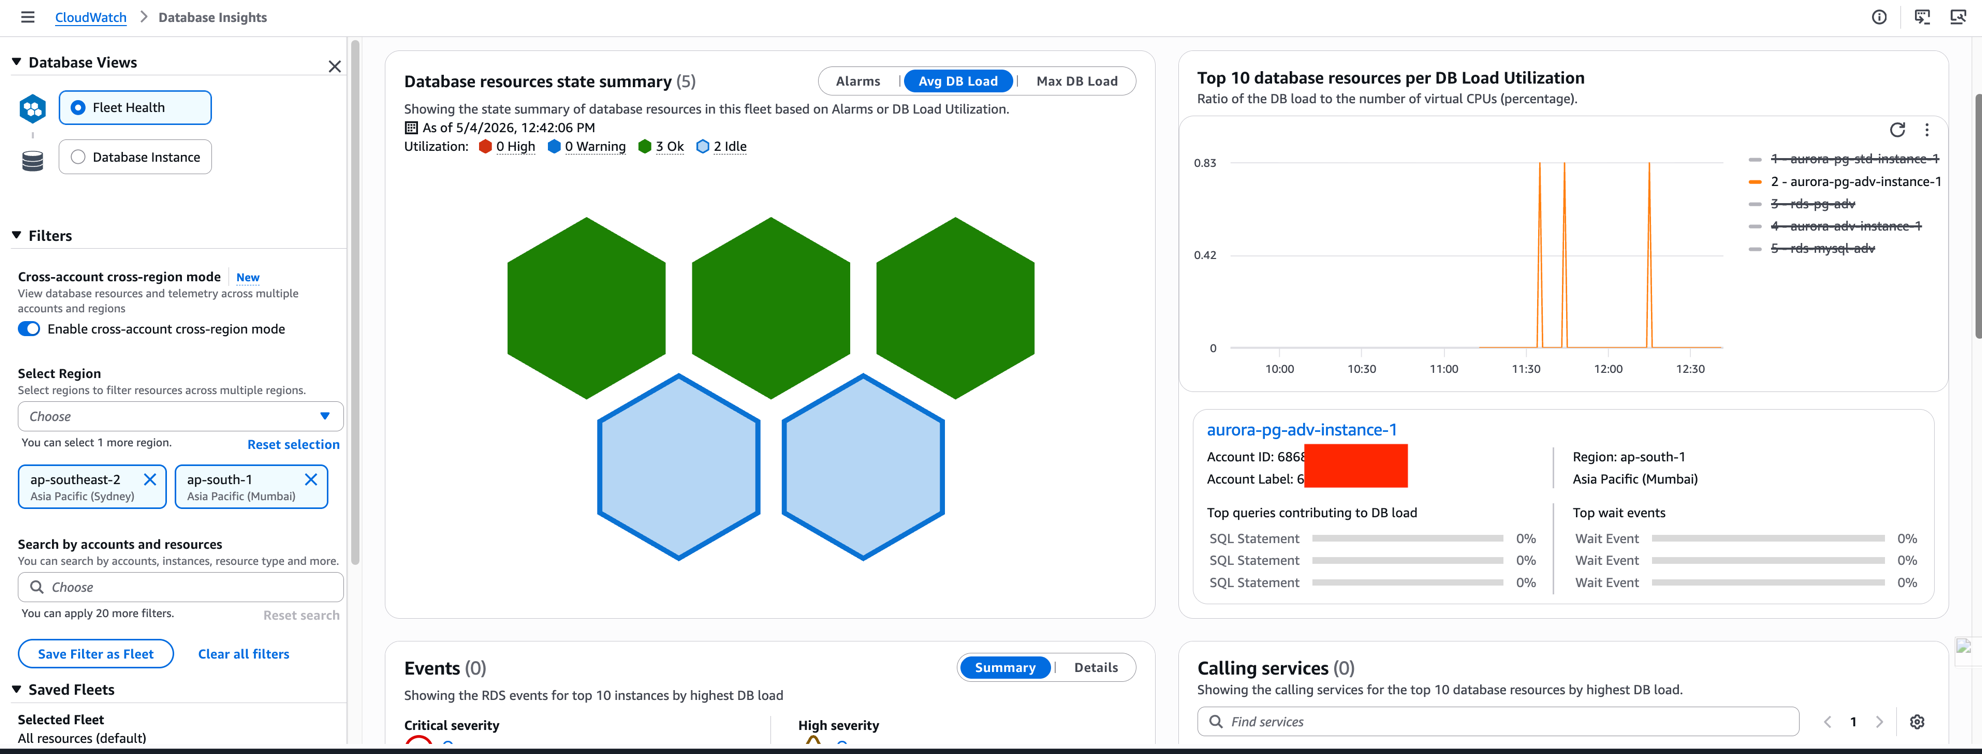
Note: After completing the monitoring account setup, open Database Insights from the Amazon CloudWatch console. In the left panel under Database Views, expand the Filters section and toggle on Enable cross-account cross-Region mode. For Select Region, choose the AWS Regions that you want to monitor. You can select up to three Regions simultaneously.
Configure source accounts
Run through the following steps in each source account that holds the Amazon RDS or Aurora databases that you want visible from the monitoring account.
- From the source account, open the Amazon CloudWatch console, select the AWS Region where your Amazon RDS or Aurora databases reside, and choose Settings in the left navigation pane.
- Open the Source account configuration section and choose Configure.
Setting up data sharing in the source account
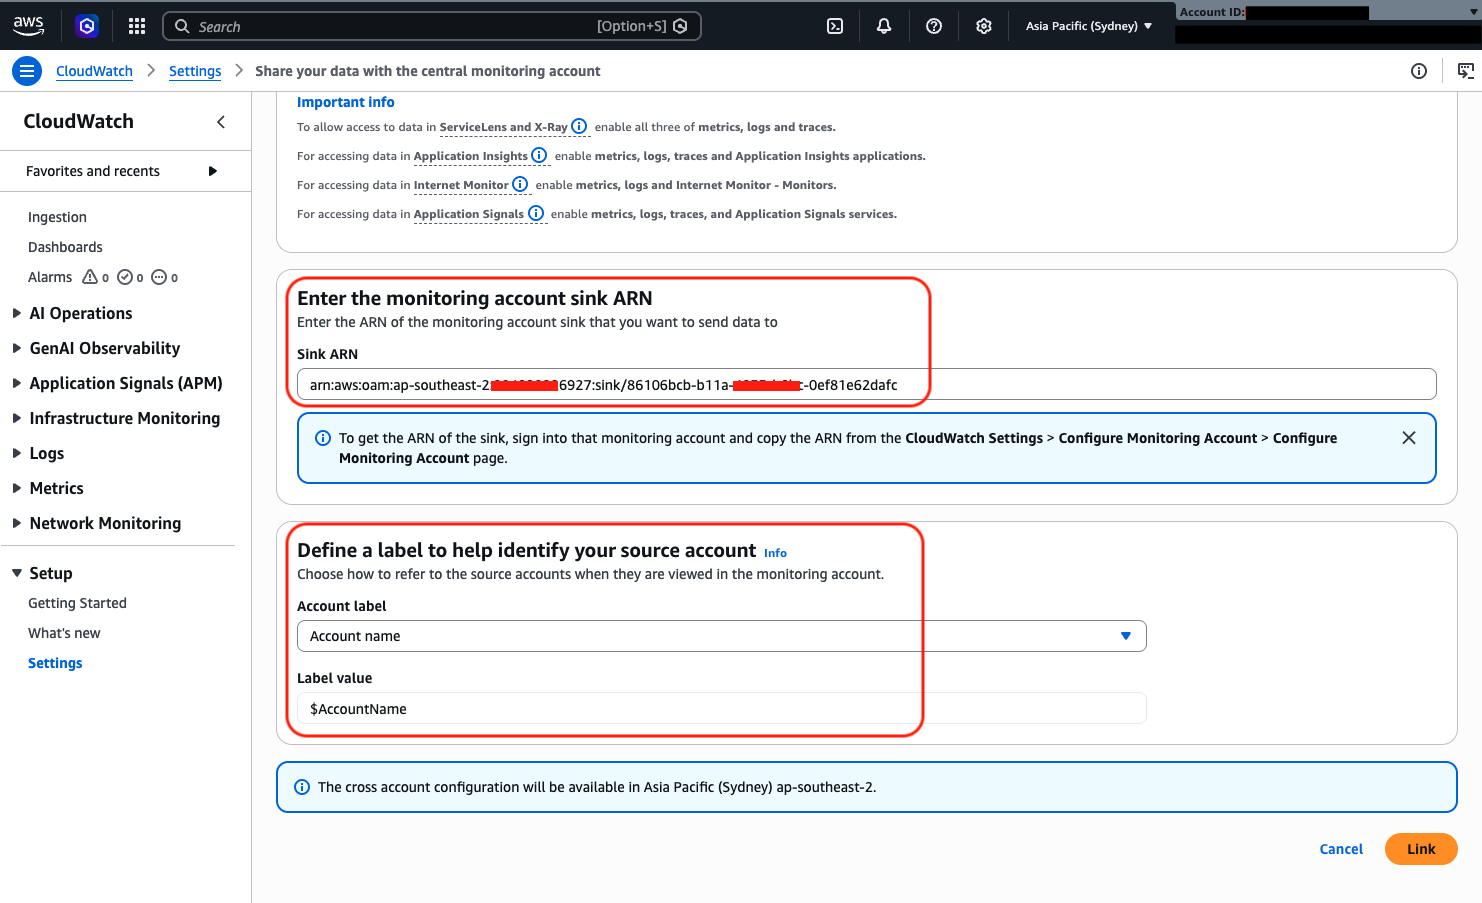
- Choose the data to share with the monitoring account (for example, Logs, Metrics, and Traces).
- (Optional) To be more granular, filter the Logs and Metrics that you want to share with the monitoring account.
- Either enter the monitoring account sink ARN, or use the AWS CloudFormation template or URL that you copied earlier when you configured the monitoring account. Then define a label to identify the source account. In the monitoring account, this label is displayed with data from that source account. The account label appears in charts and search experiences to help you identify account contexts.
Entering monitoring account details
- After you choose Link, confirm that the monitoring account receives shared data from the source account. Confirm this action by entering “Confirm” in the confirmation dialog box.
The status changes to Linked in the Source account configuration section of the settings page.
Repeat the steps to add other source accounts from the same Region.
Note: If you have resources across AWS Regions, repeat the steps to configure both monitoring and source in that Region.
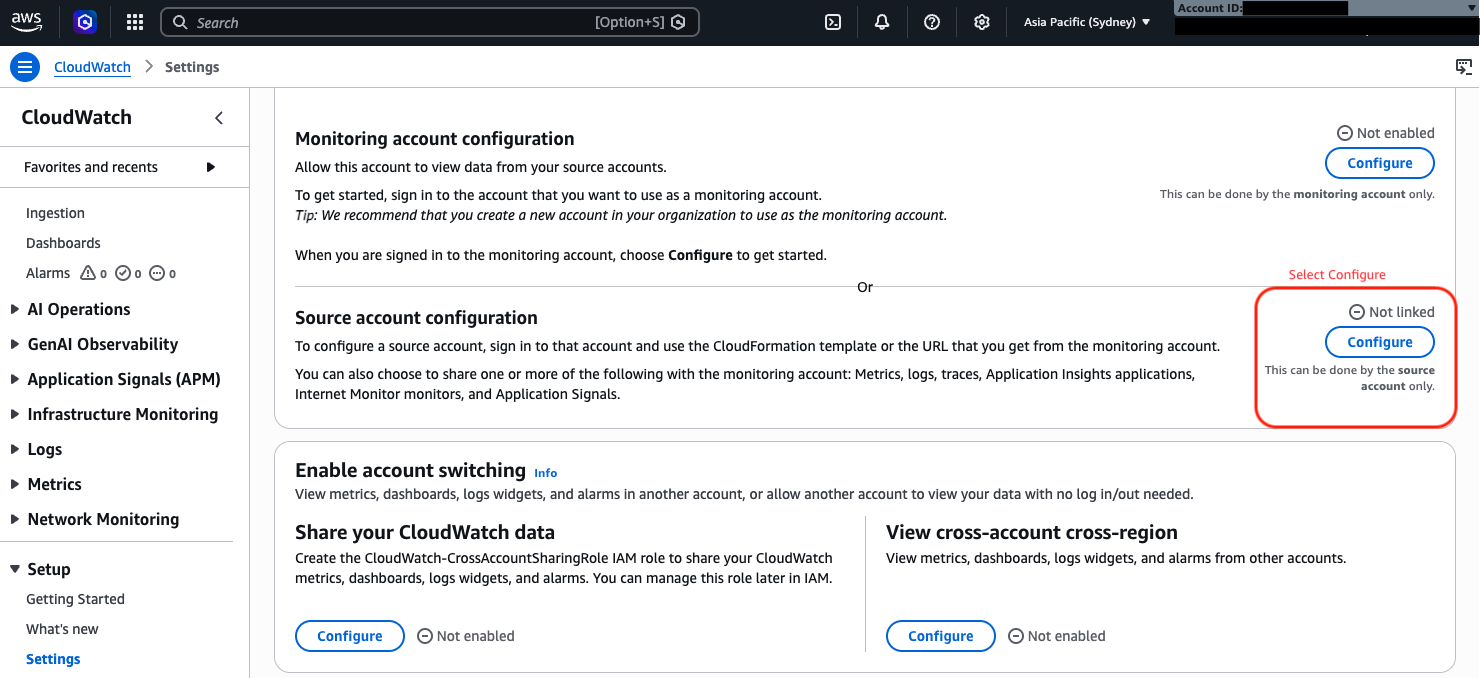
- After you link the source account, enable cross-account cross-Region functionality. This step tells CloudWatch in the source account to make the configured data available to the monitoring account. Open the Amazon CloudWatch console in the source account and go to Settings.
- Under Enable account switching select Configure to share your CloudWatch data.
Enabling account switching for source accounts
- For Sharing, choose Specific accounts.
- Enter the IDs of the accounts that you want to share data with (the monitoring account ID).
- Choose the Permissions accordingly.
- Choose Launch AWS CloudFormation template.
- In the confirmation screen, enter “Confirm” and choose Launch template.
- Select the I acknowledge checkbox.
- Choose Create stack.
After the stack is created, the monitoring account has read-only access to the shared CloudWatch data in this source account. Behind the scenes, this deploys an IAM role that permits the monitoring account to view data without being able to make changes. If you later need to extend sharing to an entire AWS organization instead of individual accounts, you can modify that IAM role accordingly.
Sharing CloudWatch data with an entire AWS organization
Note: Cross-Region support is built into the feature automatically. You don’t need to perform additional configuration steps to display metrics from different Regions side by side on the same graph or dashboard. The one exception is alarms. You can’t create an alarm in one Region that monitors a metric in a different Region.
To integrate cross-account functionality with AWS Organizations, see the AWS Organizations integration guidance for CloudWatch cross-account observability.
If you face issues related to “access denied” or “don’t see an account list in the Amazon CloudWatch console,” refer to Troubleshooting your CloudWatch cross-account setup.
One thing to keep in mind for multi-Region setups: the monitoring account configuration has to be active in every AWS Region where you want to see data. The same goes for source accounts. Complete the linking and sharing steps in each Region separately. If a Region is missing from either side, metrics from that Region won’t show up on the dashboard.
Validate the configuration
After the setup is complete, open the Database Insights dashboard in the monitoring account to confirm everything is working. Sign in to the monitoring account, open the Amazon CloudWatch console, and choose Database Insights. You should see database resources from your linked source accounts listed there.
In the Amazon CloudWatch console, the Database Insights dashboard provides a unified view of Amazon RDS and Amazon Aurora database resources across linked AWS accounts and Regions.
Dashboard highlights
- Account selector – Switch between linked source accounts from the monitoring account.
- Region filter – View database resources across selected AWS Regions.
- Fleet Health summary – Identify healthy, warning, or high-utilization database instances.
- Performance metrics – Monitor key database metrics such as:
- Database load (average active sessions).
- Top SQL queries.
- Wait events.
- CPU, memory, and I/O utilization.
- Database resource view – View Amazon RDS and Amazon Aurora instances from multiple accounts in a single centralized dashboard.
Note: The monitoring account provides read-only visibility into linked source account database resources.
Database Insights Fleet Health dashboard
Advanced Database Insights unlocks the Fleet Health dashboard. It provides a centralized view of database health, database load, resource utilization, and database inventory across linked accounts and configured Regions.
Fleet Health dashboard overview
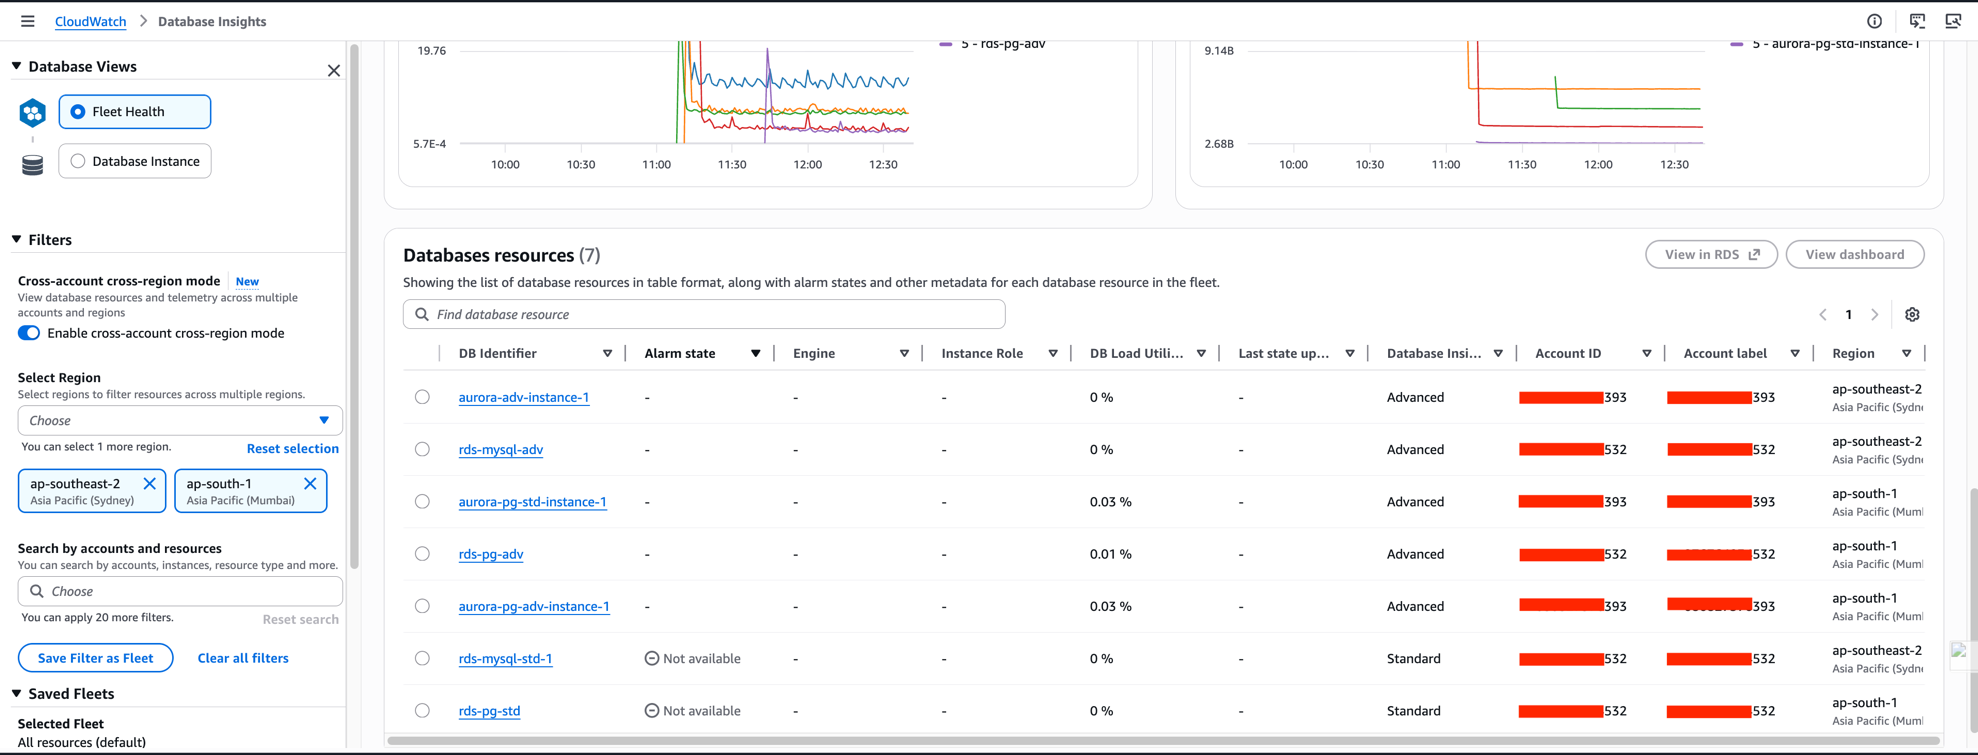
From the Fleet Health view, you can select an individual database instance to get a more detailed breakdown. You can review database load, wait events, slow queries, and resource metrics through a centralized monitoring view, without ever leaving the monitoring account.
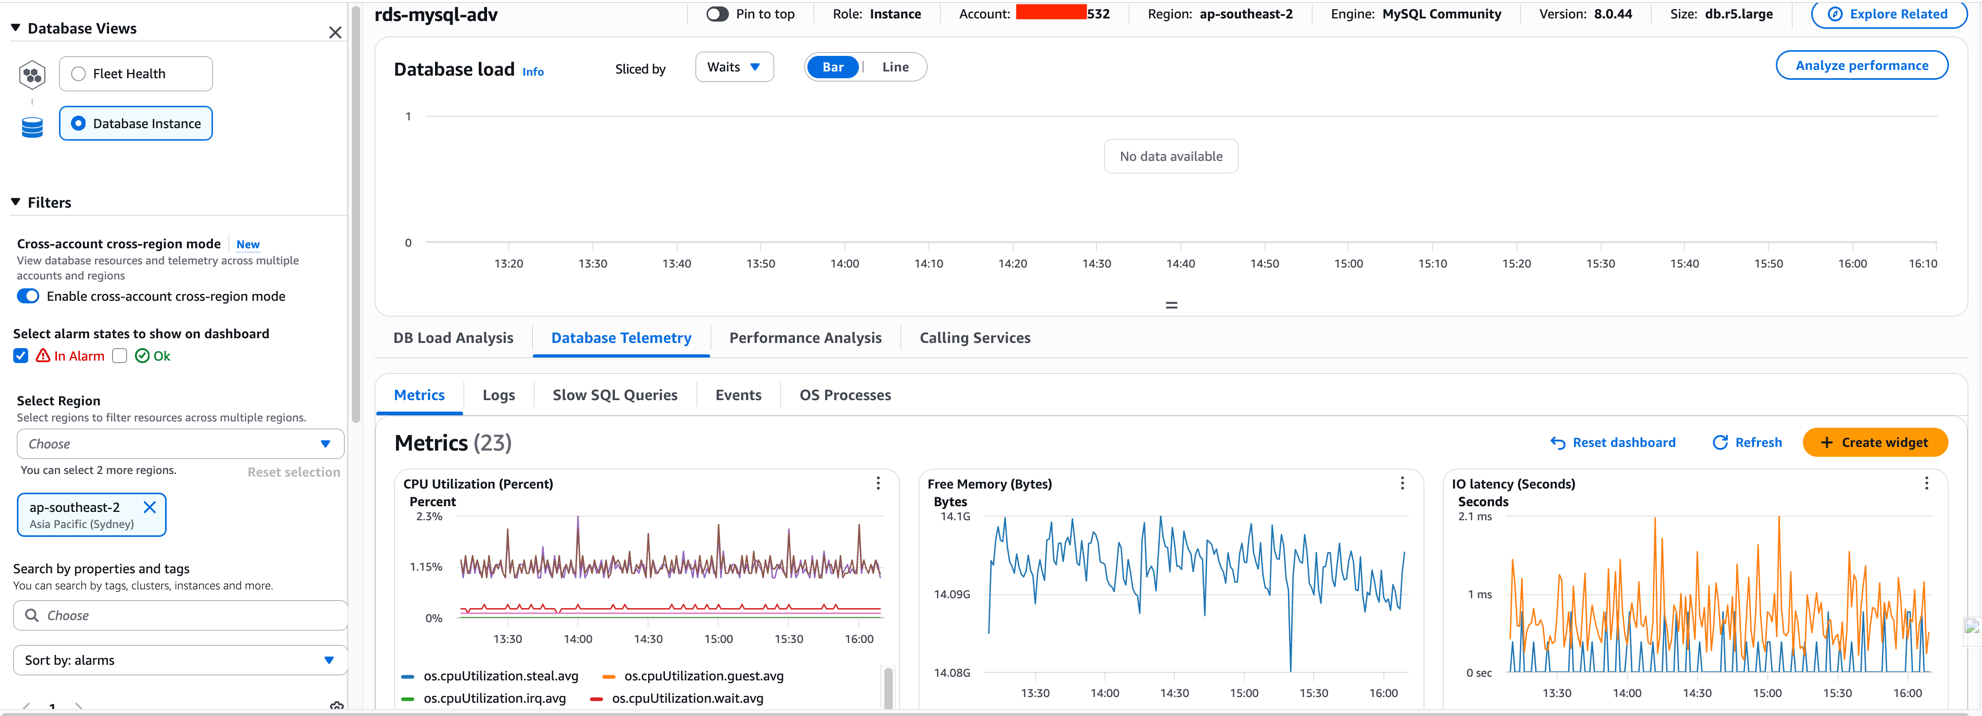
Exploring database details in Database Insights
Clean up resources
If you don’t need cross-account monitoring, here’s how to remove the configuration cleanly without affecting Database Insights in the individual source accounts.
Note: This cleanup removes the cross-account monitoring infrastructure but doesn’t disable Database Insights or Enhanced Monitoring on your database instances. If you enabled Advanced Database Insights or Enhanced Monitoring, those features continue to incur charges until you disable them on each instance.
- In the source account, open CloudWatch.
- Choose Settings.
- Unlink the monitoring account to stop data sharing.
- Delete the CloudFormation stack created during setup to remove IAM roles and cross-account permissions.
- In the monitoring account, open CloudWatch.
- Choose Settings.
- Disable cross-account cross-Region viewing if no longer required.
- Under Monitoring account configuration, choose Manage.
- Remove the sink configuration to fully clean up the monitoring account setup.
- Remove unused source account IDs from the monitoring account configuration.
- Verify cleanup by confirming that source accounts no longer appear on the dashboard, associated IAM roles are removed, and no residual AWS CloudFormation stacks remain.
- If you enabled Advanced Database Insights and want to stop incurring charges, disable Database Insights on each Amazon RDS or Aurora instance: in the Amazon RDS console, select the instance, choose Modify, and set Database Insights to Disabled.
Important: Removing cross-account monitoring doesn’t disable Database Insights within individual source accounts. Only the centralized monitoring view is removed. If you enabled Advanced Database Insights, charges continue until you disable it on each instance.
Conclusion
In this post, you learned how to configure cross-account and cross-Region monitoring for Amazon RDS and Aurora using CloudWatch Database Insights. Instead of switching between accounts during an incident, your team can check fleet health, database load, top SQL, and wait events from one place.
The read-only access model means you get visibility into shared metrics without weakening security controls in linked source accounts. For teams managing databases across many accounts and Regions, that trade-off is worth the setup time.
If you’re running large fleets across several Regions, keep the Fleet Health dashboard three-Region limit in mind when planning your layout. To configure your monitoring account, sign in to the Amazon CloudWatch console and navigate to Settings. For full reference material, see the CloudWatch Database Insights documentation.