AWS Database Blog
Deep dive into Amazon Aurora PostgreSQL lock analysis with CloudWatch Database Insights
Lock contention is one of the common performance challenges in relational databases such as Amazon Aurora PostgreSQL and Amazon Relational Database Service (Amazon RDS) for PostgreSQL. While PostgreSQL relies on locks to enforce ACID (Atomicity, Consistency, Isolation, and Durability) guarantees and coordinate concurrent access to shared data, excessive locking can become a bottleneck under high concurrency, increasing latency, reducing transaction throughput, and in severe cases, causing deadlocks.
In this post, we show you how to use Amazon CloudWatch Database Insights for lock analysis in Amazon Aurora PostgreSQL. You learn how to enable the feature, interpret lock tree visualizations, resolve common lock-related issues, and maintain optimal database performance. This lock tree analysis feature also applies to Amazon RDS for PostgreSQL.
Solution overview
Amazon CloudWatch Database Insights is a database observability tool that aggregates logs, metrics, and events from Amazon Aurora databases and other Amazon RDS databases into a centralized dashboard. The tool helps you monitor performance, optimize databases, and troubleshoot issues. For Amazon Aurora PostgreSQL, CloudWatch Database Insights offers an advanced mode feature, lock tree analysis, that provides a hierarchical visualization of real-time and historical lock contention. With this feature, you can identify blocking and waiting sessions, understand lock contention patterns, and trace the root causes of transaction delays.
Key capabilities include:
- Lock tree visualization – Displays the relationships between blocking and waiting sessions, with detailed metrics like session IDs, queries, and wait times.
- Real-time monitoring – Captures snapshots every 15 seconds, and flags high locking when contention persists for 15 minutes.
- Historical analysis – Retains locking data for 15 months in Advanced Mode, for both Aurora PostgreSQL and RDS for PostgreSQL, so you can perform trend analysis and post-incident reviews. Lock tree analysis isn’t available in Standard Mode.
Understanding PostgreSQL lock fundamentals in Amazon Aurora
Before exploring CloudWatch Database Insights, it’s important to establish a solid understanding of how PostgreSQL manages locking, the foundation for diagnosing and resolving concurrency issues.
PostgreSQL lock management
PostgreSQL provides a sophisticated locking framework that operates at multiple levels of detail, including table-level, row-level, and page-level locks. The database engine applies the least restrictive lock necessary for any given operation. This fine-grained approach minimizes contention by locking only the specific resource being accessed, rather than broader structures. These locks are particularly valuable for application-controlled locking scenarios where Multi-Version Concurrency Control (MVCC) alone is insufficient. In most cases, PostgreSQL automatically acquires the appropriate lock mode at the minimal required level of detail to enforce the requested transaction isolation level and maintain ACID compliance. This prevents referenced tables from being dropped or modified in ways that would conflict with an active transaction.
Prerequisites
Amazon CloudWatch Database Insights helps with troubleshooting performance issues for all Amazon Aurora PostgreSQL versions and provides features such as lock analysis, execution plan analysis, and fleet-wide monitoring. To analyze lock trees, you must have CloudWatch Database Insights enabled in Advanced Mode. For more information, see Turning on the Advanced mode of Database Insights for Amazon Aurora.
Lock tree analysis is also supported for Amazon RDS for PostgreSQL. To enable Advanced Mode for RDS, see Turning on the Advanced mode of Database Insights for Amazon RDS. There is a cost associated with enabling Advanced Mode. Review the CloudWatch pricing page for more details.
Accessing lock analysis
After you enable CloudWatch Database Insights Advanced Mode, you can access lock analysis through the Amazon CloudWatch Database Insights console:
- Sign in to the AWS Management Console and open the Amazon CloudWatch console.
- In the navigation pane, choose Insights, then Database Insights.
- Select Database Instance on the left-hand panel.
- Choose your Amazon Aurora PostgreSQL DB instance.
- In the DB Load Analysis tab, select the Lock analysis tab.
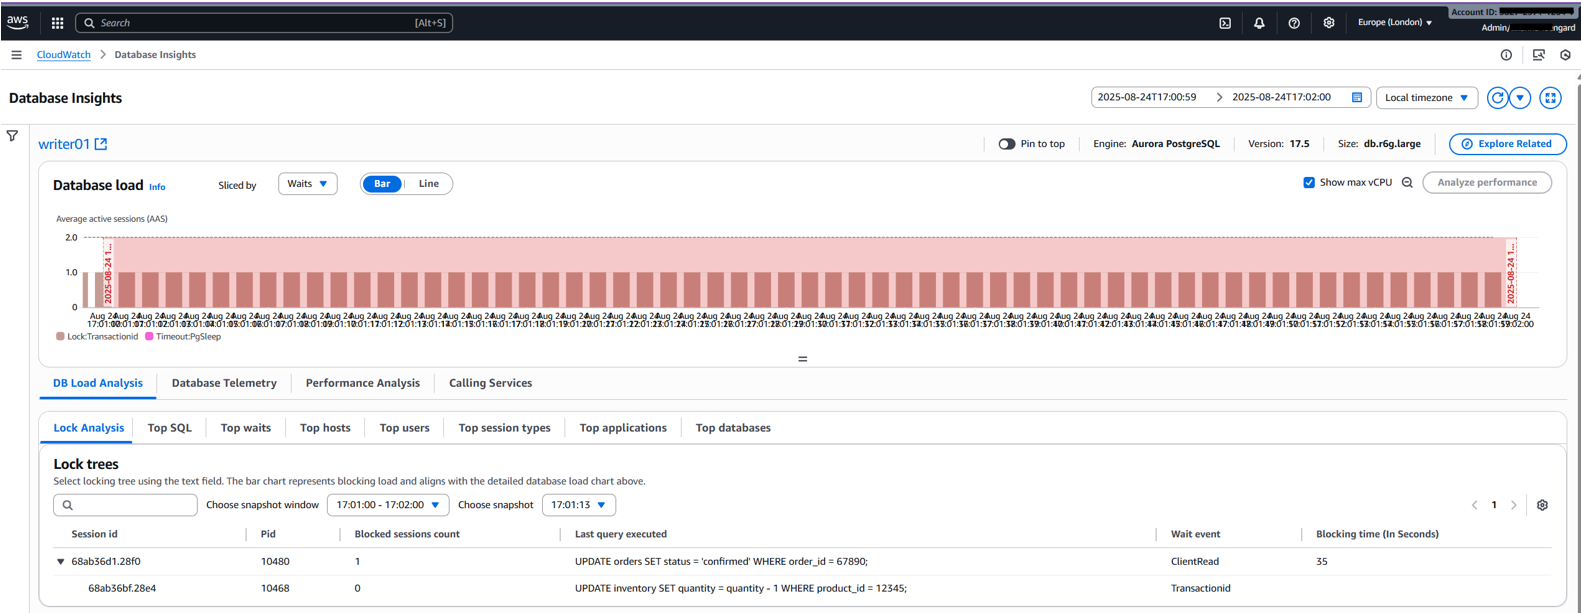
The Lock analysis tab displays lock contention information. Use the Sliced by menu to filter by dimensions such as Blocking object, Blocking session, or Blocking SQL. These dimensions help identify top blockers contributing to database load over time. The following screenshot shows CloudWatch Database Insights.
Understanding lock tree analysis
A lock tree is a hierarchical visualization of locking relationships, illustrating:
- Blocking sessions: Sessions holding locks that prevent others from proceeding.
- Waiting sessions: Sessions waiting for locks to be released.
- Lock modes: Lock mode held or requested.
Viewing the lock tree
- Select a snapshot time from the list of available snapshots. Snapshots are captured every 15 seconds, with high locking flagged if contention persists for 15 consecutive minutes.
- Expand nodes by choosing the arrow just below the session id to view the hierarchy of blocking and waiting sessions.
Each node provides detailed metrics, customizable through the Settings icon:
| Column name | Definition | Default column |
session_id |
Unique session ID, derived from HEX(pg_stat_activity.backend_start).HEX(pg_locks.pid) |
Yes |
pid |
Process ID of the backend, from pg_locks.pid |
Yes |
blocked_sessions_count |
Number of sessions blocked by this lock | Yes |
last_query_executed |
Last query executed, from pg_stat_activity.query |
Yes |
wait_event |
Wait event name if waiting, NULL otherwise, from pg_stat_activity.wait_event |
Yes |
blocking_time_(In Seconds) |
Time since lock start in seconds, from pg_locks.waitstart |
Yes |
blocking_mode |
Lock mode held by blocking session, from pg_locks.mode |
No |
application |
Application name connected, from pg_stat_activity.application_name |
No |
For more column definitions, see the Lock snapshot data documentation. To troubleshoot performance issues caused by locks, you can analyze lock trees for Amazon Aurora PostgreSQL databases with Amazon CloudWatch Database Insights using the preceding metrics.
Real-world scenario examples
In this section, we explore two scenarios that demonstrate how lock tree analysis helps you resolve common lock-related issues in Amazon Aurora PostgreSQL.
Scenario 1: E-commerce order processing — identifying and resolving lock contention
Background: During a Black Friday sales surge, an ecommerce platform running on Aurora PostgreSQL (version 17.5, db.r7g.4xlarge) began experiencing order processing delays. Users reported that order confirmations were hanging, and the support team suspected a database issue.
Problem identification: Using CloudWatch Database Insights, the DBA navigated to the Lock analysis tab and immediately identified the source of the problem. The Database load chart, when sliced by Blocking SQL, revealed that a single transaction was dominating the DB load. This is a clear indicator of lock contention.
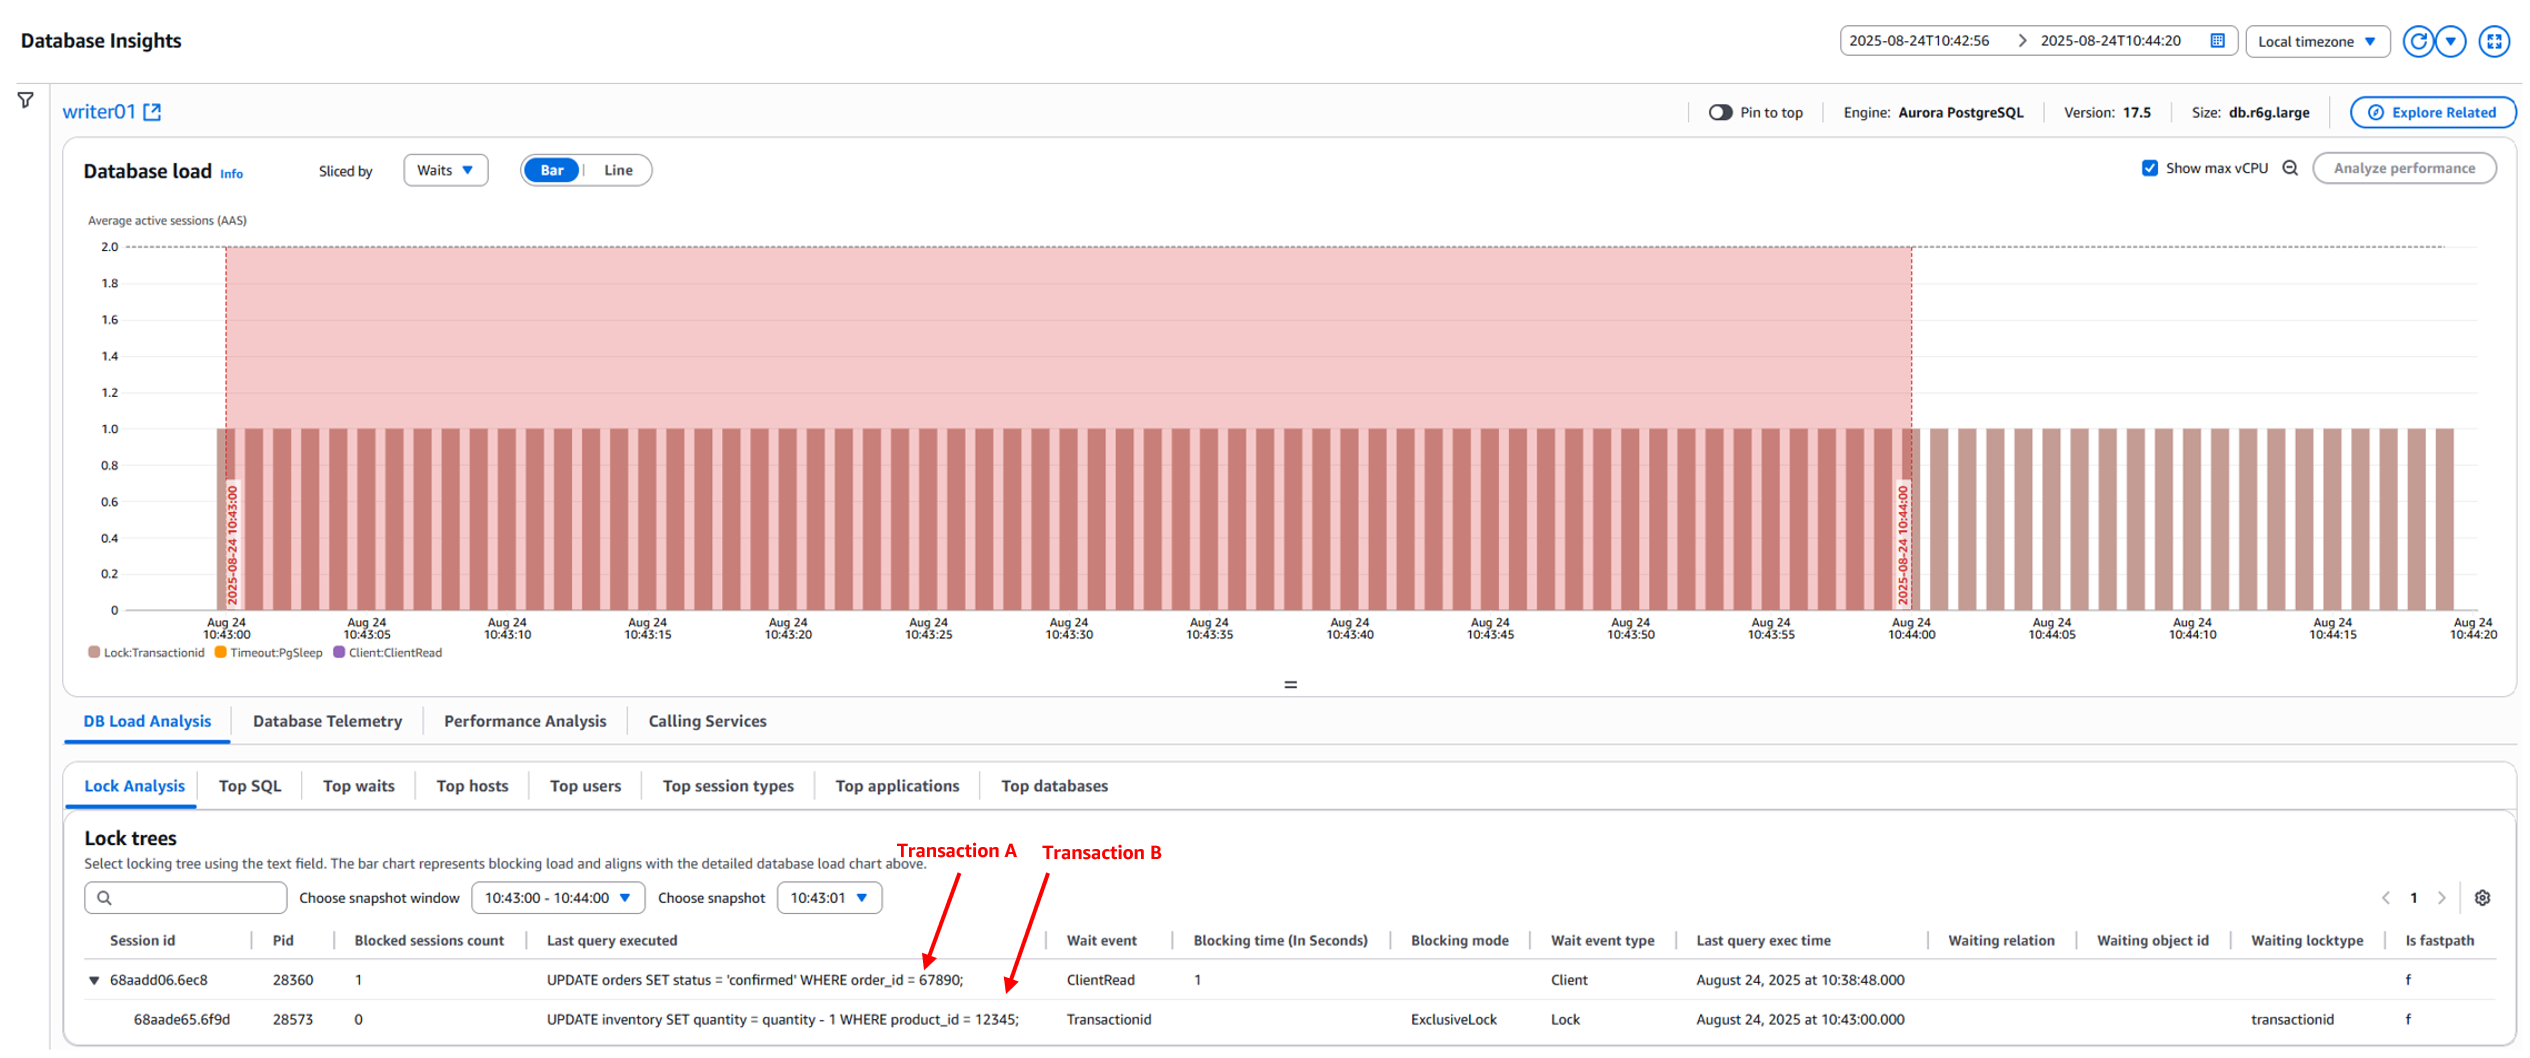
Transaction A:
Transaction A executed both statements but hasn’t yet committed. The transaction is open and holding locks on both tables.
Transaction B (concurrently):
Transaction B attempts to update the same inventory row (product_id 12345) but can’t proceed because Transaction A holds a conflicting lock.
Lock tree analysis: The lock tree visualization shows the blocking relationship clearly:
Pid 28560(Transaction A) is the root blocker. It’s blocking 1 session. Its wait event isClientRead, which means the database has finished executing the transaction’s statements but is waiting for the client application to send the next command (such asCOMMITorROLLBACK). This is the telltale sign that the application failed to properly close its transaction.Pid 28573(Transaction B) is the blocked session. It’s waiting on theTransactionIdwait event withExclusiveLockblocking mode. This confirms that it’s waiting for Transaction A’s transaction to either commit or roll back before it can acquire its own lock on the same row.
Important note: The SQL displayed under the column Last query executed might not be the blocked or blocking SQL statement. It represents the last SQL statement executed by the blocked or blocking session. Alternatively, you can run the following query to find the exact blocking or blocked SQL statement:
Resolution strategy:
In this case, terminating the blocking session (Pid 28560) is the appropriate action using pg_terminate_backend():
Note: Before you terminate transactions, evaluate the potential effect that each transaction has on the state of your database and your application.
pg_cancel_backend– Usepg_cancel_backend(pid)to send a SIGINT signal that cancels the current long-running query while keeping the database connection active. The backend can continue processing other queries after gracefully terminating the current operation.pg_terminate_backend– Usepg_terminate_backend(pid)to send a SIGTERM signal that forcefully terminates the connection, ending the query and rolling back any open transactions or held locks associated with the process.
Also, consider the following:
- Lock ordering: Enforce consistent lock acquisition. For example, always process the inventory table before the orders table.
- Catch and retry logic: Implement exponential backoff retries in the application.
- Transaction scope reduction: Preprocess data outside transactions to minimize lock duration.
Scenario 2: Idle-in-transaction
Database concurrency and performance can degrade when sessions remain idle in a transaction state. This is typically caused by missing COMMIT statements or improper exception handling (such as a missing ROLLBACK). These sessions continue to hold locks even when no active work is being performed, blocking other sessions that need to modify the same data.
Background: A telecommunications application’s billing module acquires a ROW EXCLUSIVE lock while updating call costs for call detail record (cdr_id 9001) in the call_detail_records table. Because the transaction is missing a COMMIT or ROLLBACK statement, it remains open and continues to hold the lock. When the Fraud Detection System subsequently attempts to update the same call detail record for scoring, it is blocked, stalling processing for the call_detail_records table.
Problem analysis: The billing module calculates and applies the call cost for cdr_id 9001, completing its intended work. However, because of a bug in the application, neither COMMIT; nor ROLLBACK; is run after the update. As a result, the transaction remains open and the session enters an idle in transaction state, continuing to hold the ROW EXCLUSIVE lock on the record.
Concurrently, the Fraud Detection System attempts to update the same call detail record (cdr_id 9001) as a high-risk record. This session hangs indefinitely (and never returns) because the previous session holds a conflicting lock.
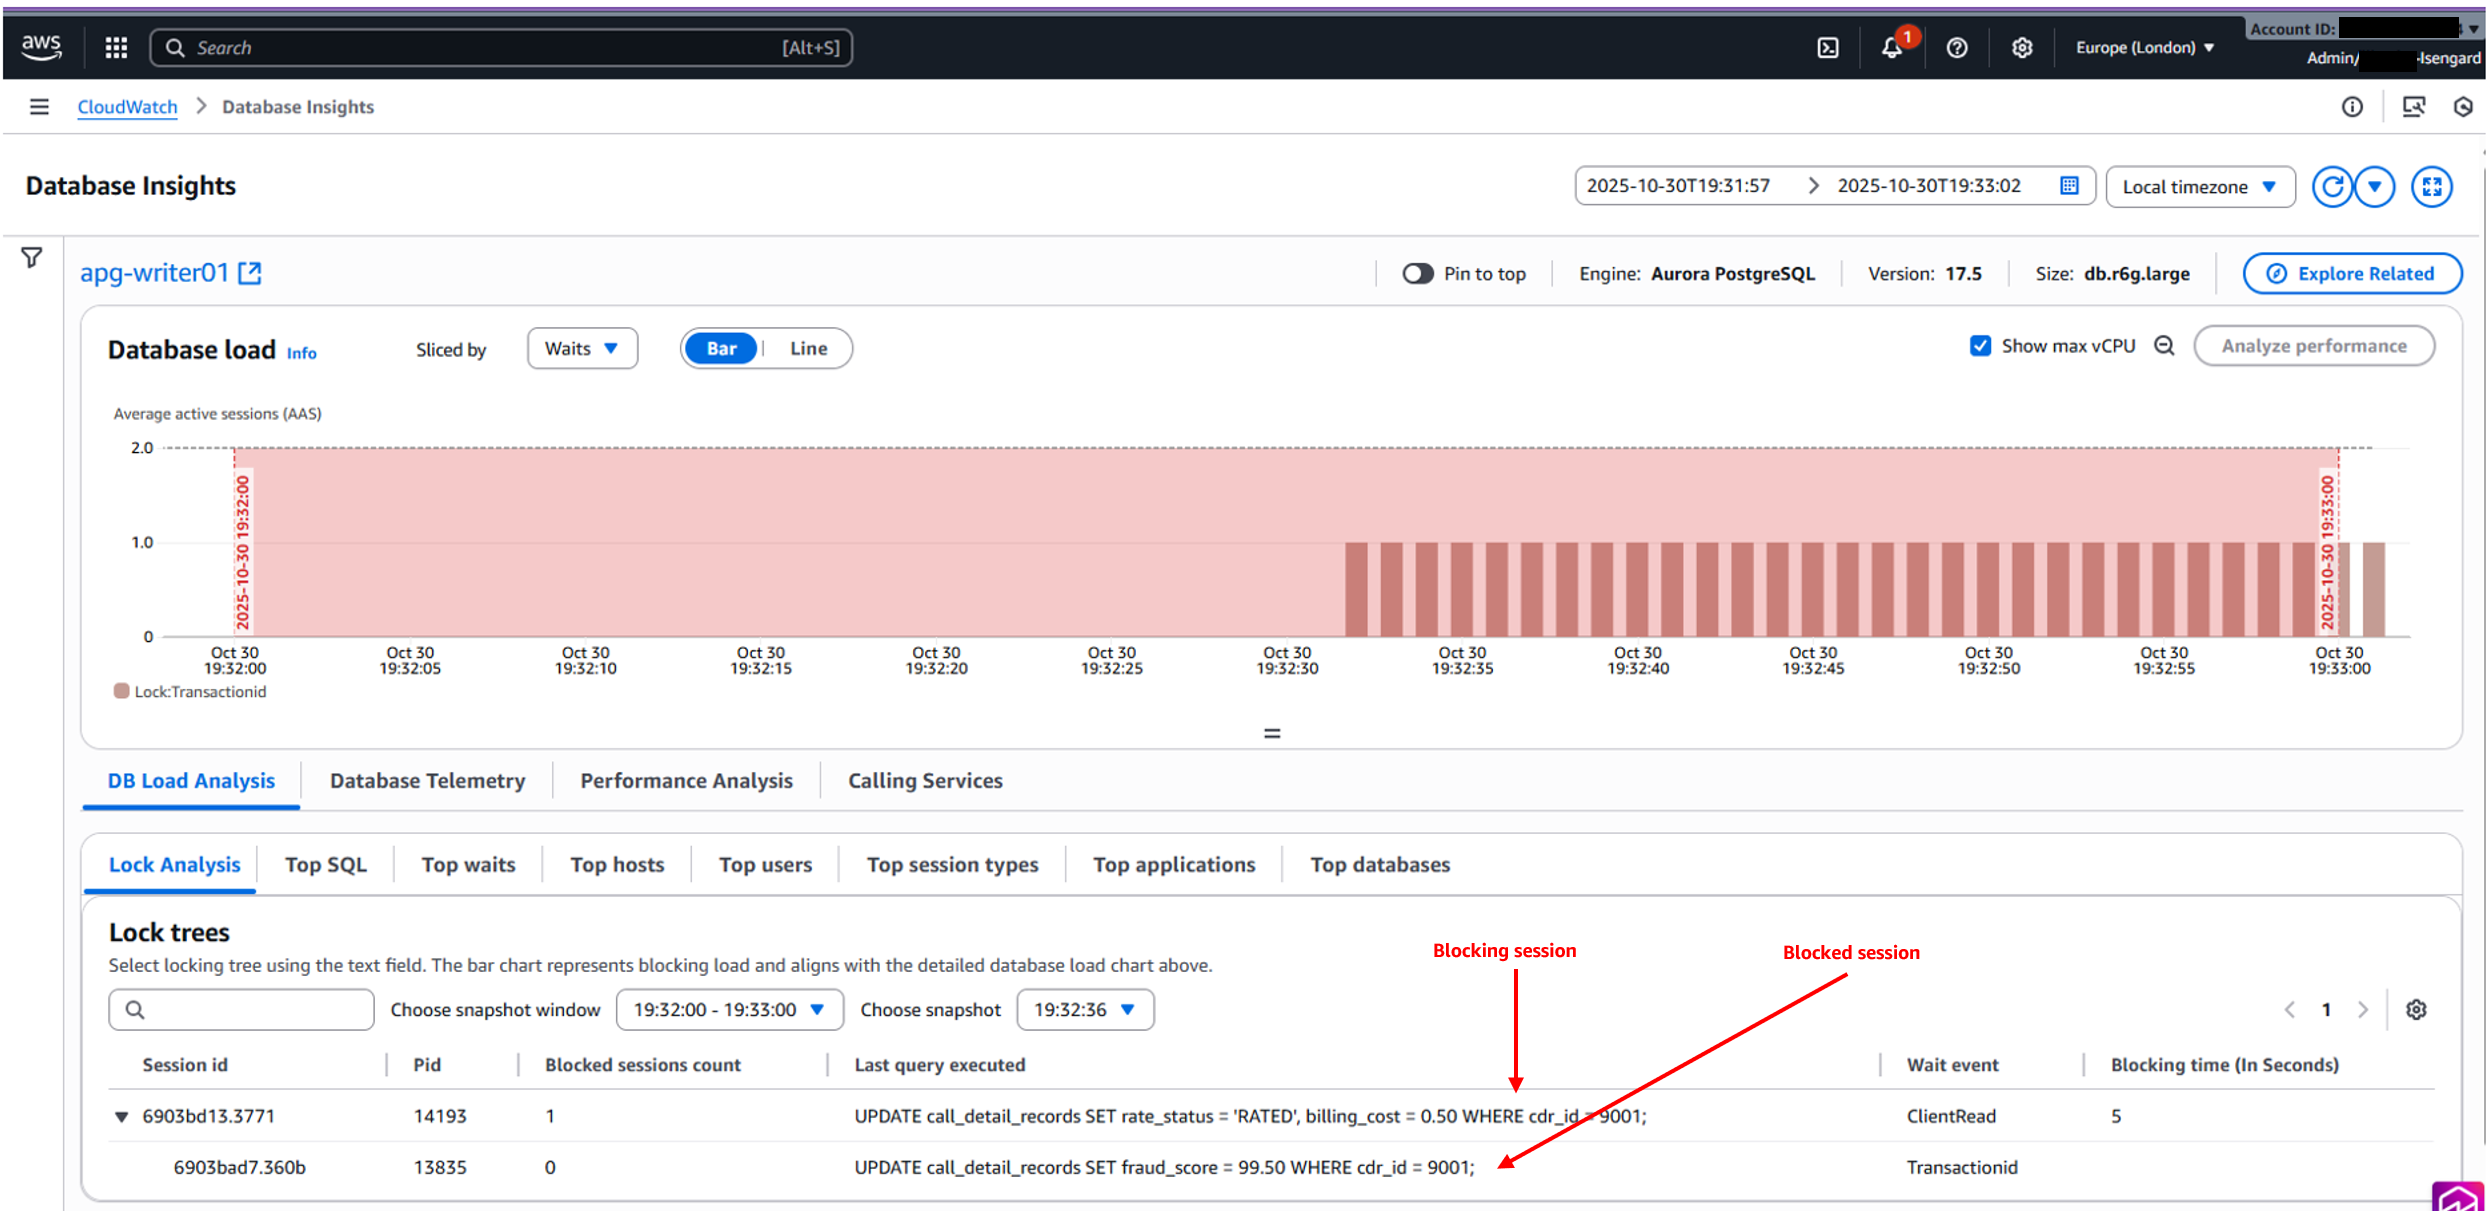
Lock dependency visualization: The lock tree shows PostgreSQL process id (Pid 13835, the Fraud Detection System) as the blocked session. It’s blocked by the PostgreSQL process id (Pid 14193, the billing module session) with a wait on the TransactionId wait event. This indicates that Pid 13835 is waiting for Pid 14193 to release the transaction lock before it can proceed.
Pid 14193, the main blocking session, is in a ClientRead wait event. It has completed its work (calculating and applying the call cost) and is now waiting for the client to send the next command. This is the expected state for an idle in transaction session: the database has finished running the update, but the transaction remains open because the application hasn’t issued a COMMIT; or ROLLBACK.
Resolution strategy:
In this case, canceling the blocking process (Pid 14193) is the option using pg_terminate_backend().
Note: Before you terminate transactions, evaluate the potential effect that each transaction has on the state of your database and your application.
Best practices to prevent lock contention and idle-in-transaction issues
In this section, we cover key practices across application design, database configuration, and monitoring that help you minimize lock contention and avoid idle-in-transaction issues in your PostgreSQL environments.
1. Application design and code practices
- Always use explicit transaction boundaries (
BEGIN/COMMIT/ROLLBACK). Every code path, including exception handlers, must close the transaction. - Keep transactions short to minimize the duration locks are held.
- Implement robust error handling with try-catch blocks, placing
COMMITorROLLBACKin afinallyblock. - Avoid long-running
SELECT...FOR UPDATEoperations that hold row-level locks for extended periods. - Use row-level locking instead of table-level locking wherever possible to reduce contention.
2. Database configuration
- Set
idle_in_transaction_session_timeout(recommended: 30 seconds–5 minuted) to automatically terminate sessions that remain idle within an open transaction. - Configure
lock_timeoutfor DDL operations to prevent long waits on schema changes. - Set
statement_timeoutto enforce query execution limits and prevent runaway queries. - Access shared resources in a consistent order across transactions to remove circular wait conditions that cause deadlocks.
3. Monitoring and observability
- Use
pg_stat_activityto identify sessions in an idle-in-transaction state:
- Use
pg_locksto investigate blocking and waiting sessions. - Implement CloudWatch alarms for long-running transactions and lock wait events.
- Monitor the
Lock:transactionidwait event in CloudWatch Database Insights to detect sessions blocked by open transactions.
Conclusion
In this post, we showed you how to use Amazon CloudWatch Database Insights to diagnose locking issues in Aurora PostgreSQL. By combining lock tree analysis with sound database design and proactive monitoring, you can improve the performance and reliability of your databases. We encourage you to explore these capabilities in your environments and share your experiences with the AWS community.
For more information, see the CloudWatch Database Insights documentation and the AWS Database Blog.