AWS Database Blog
Troubleshooting SQL Server query performance on Amazon RDS
Database administrators managing SQL Server workloads on Amazon Relational Database Service (Amazon RDS) often face a familiar challenge. A query runs fine on Friday but experiences performance degradation on Monday. The application team insists nothing changed. Identifying the root cause requires the right combination of monitoring and diagnostic tools. The issue could be a shifted execution plan, resource contention, or workload interference.
This post demonstrates a complete database administrator (DBA) workflow for monitoring, diagnosing, and resolving T-SQL query performance issues on Amazon RDS for SQL Server. This walkthrough demonstrates a real-world scenario using three integrated tools:
- Amazon CloudWatch Database Insights: Detects performance anomalies and identifies problematic queries from fleet-level and instance-level views.
- Query Store: A SQL Server native feature that tracks execution plan changes and identifies query regressions over time.
- Resource Governor: A SQL Server native feature that manages workload resource consumption by setting CPU and memory limits for different workload groups.
By the end of this post, you learn how to use these tools together to move from “performance issues occur” to a targeted resolution. You follow the same troubleshooting path a DBA would use in production.
Solution overview
Our scenario simulates a mixed workload environment running on Amazon RDS for SQL Server. We have 10 databases serving different business functions:
- Analytical (OLAP) databases: A set of databases running complex reporting queries with multi-table joins, window functions, and aggregations.
- Transactional (OLTP) databases: A set of databases handling inserts, updates, deletes, and periodic schema changes.
Note: The specific database names and table structures used in this demo are illustrative. Your environment will have different names and configurations.
Under this combined load, the RDS instance experiences high CPU utilization. Certain reporting queries begin to regress in performance. This troubleshooting workflow follows this path:
- Detect: Use Database Insights to observe high database load and identify the top resource-consuming queries.
- Diagnose: Use Query Store to determine whether the identified query has experienced an execution plan change.
- Resolve: Use Resource Governor to separate analytical and transactional workloads, preventing reporting queries from consuming all available CPU.
- Validate: Use Database Insights and Query Store together to confirm the resolution is effective.
Prerequisites
To follow along with this post, you need the following:
- An Amazon RDS for SQL Server DB instance running SQL Server 2019 or later. In this walkthrough, we use a db.m5.xlarge instance (4 vCPU, 16 GB RAM) with GP3 storage configured at 3,000 IOPS.
- CloudWatch Database Insights enabled in Advanced mode on your RDS instance. See the Modes for Database Insights documentation for a detailed comparison.
Note: CloudWatch Database Insights Advanced mode incurs additional charges. See the CloudWatch pricing page for current Database Insights pricing details.
Enabling Query Store on Amazon RDS for SQL Server
Query Store is a SQL Server feature that captures a history of queries, execution plans, and runtime statistics directly within the database. It acts as a “flight recorder” for your query workload. You can compare performance over time and identify when and why a query’s behavior changed.
To enable Query Store on your RDS databases, connect to the instance using SSMS. Run the following T-SQL command for each database you want to monitor:
Note: The preceding example uses BI_SalesAnalytics as the database name, which reflects the analytical database used in our demo environment. Replace this with the name of your target database when applying this configuration in your own environment.
The following table explains each configuration parameter:
| Parameter | Value | Description |
| OPERATION_MODE | READ_WRITE | Query Store actively captures query data. Set to READ_ONLY to pause collection without losing existing data. |
| DATA_FLUSH_INTERVAL_SECONDS | 900 | How often (in seconds) Query Store writes in-memory data to disk. 900 seconds (15 minutes) balances durability with I/O overhead. |
| INTERVAL_LENGTH_MINUTES | 30 | The time window for aggregating runtime statistics. 30-minute intervals provide sufficient granularity for troubleshooting while keeping storage manageable. |
| MAX_STORAGE_SIZE_MB | 1024 | Maximum disk space Query Store can use per database. 1 GB is appropriate for most workloads. Monitor usage with sys.database_query_store_options. |
| QUERY_CAPTURE_MODE | AUTO | Query Store only captures queries with meaningful resource consumption, filtering out trivial queries. This reduces storage overhead compared to ALL mode. |
| SIZE_BASED_CLEANUP_MODE | AUTO | When storage approaches the maximum, Query Store automatically purges the oldest data to make room for new entries. |
Note: Query Store consumes additional resources on your RDS instance. Tune the preceding parameters based on your workload requirements. For best practices on managing Query Store, see Monitoring performance by using the Query Store.
Repeat this configuration for each database you want to monitor. You can verify Query Store is enabled across all databases with the following T-SQL query:
Step 1: Detect the problem with Database Insights
With our mixed workload running against all 10 databases, we start by opening CloudWatch Database Insights. This provides a fleet-level view of our database health.
For a comprehensive introduction to Database Insights and its full capabilities, see the post Amazon CloudWatch Database Insights applied in real scenarios. In this section, we focus specifically on how to use Database Insights to identify the problematic query. We will then investigate further with Query Store.
In production systems, we recommend configuring Amazon CloudWatch Alarms for critical database metrics such as CPUUtilization, DatabaseConnections, and ReadLatency. When an alarm triggers (for example, CPU exceeding 90% for 5 consecutive minutes), the DBA begins the troubleshooting workflow described in the following steps. For guidance on setting up CloudWatch Alarms for RDS, see Monitoring Amazon RDS with CloudWatch.
Responding to the alert
You can access CloudWatch Database Insights through the Amazon CloudWatch console:
- In the CloudWatch console navigation pane, choose Insights, then choose Database Insights.
Our RDS for SQL Server instance shows elevated CPU utilization. This confirms a performance issue requires investigation. The following screenshot shows a detailed view of the CPU utilization graph over time, demonstrating the sustained high CPU usage pattern.
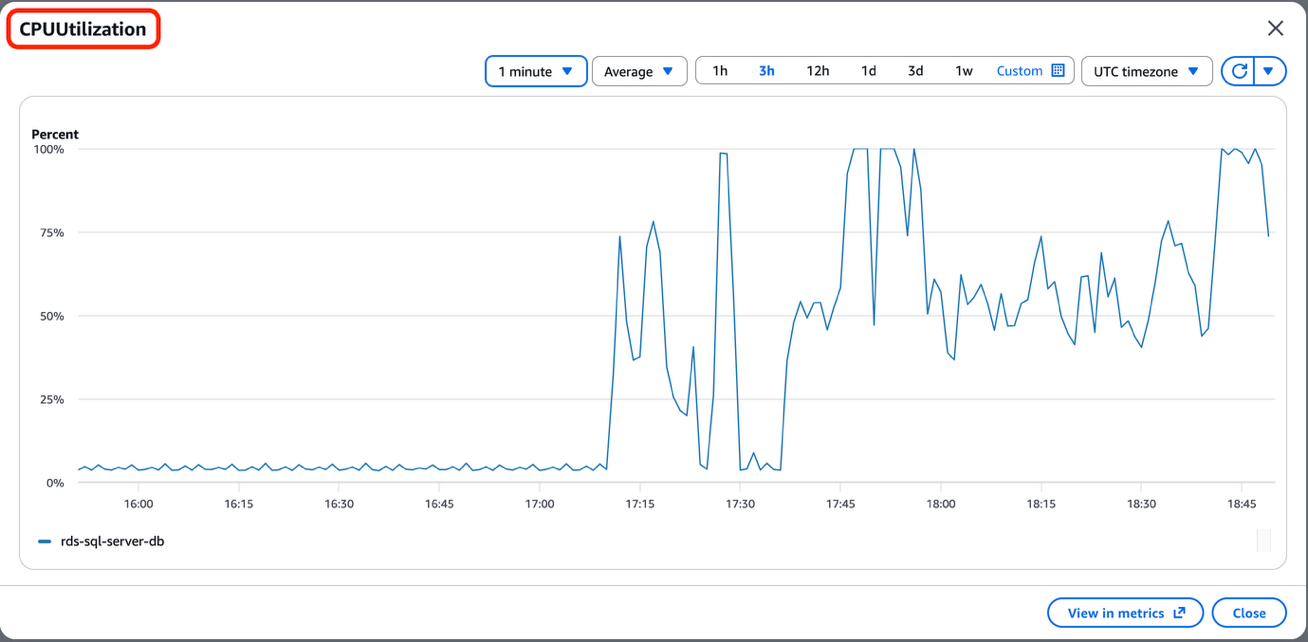
CPU utilization graph showing sustained 99%+ usage with significant fluctuations
Identifying the bottleneck with the DB Instance view
To investigate further, select DB Instance on the left panel under Database Views. Then we choose our RDS for SQL Server instance. The DB Instance view shows the Database Load metric expressed as Average Active Sessions (AAS).
The following screenshot shows the DB Instance view with several important indicators:
- The dashed vCPU line at 4: This represents the number of vCPUs on our instance. The AAS bars show the active workload relative to this capacity.
- Wait event breakdown: The legend shows the wait event types contributing to the load:
- CPU (green): Active CPU processing.
- CXPACKET (purple): Parallelism coordination waits from MAXDOP 4 queries.
- PAGEIOLATCH_EX / PAGEIOLATCH_SH: Waiting for data pages to be read from disk.
- LCK_M_IX: Waiting for intent exclusive locks (DML contention).
- BACKUPIO: Backup-related I/O.
- WRITELOG: Waiting for transaction log writes.
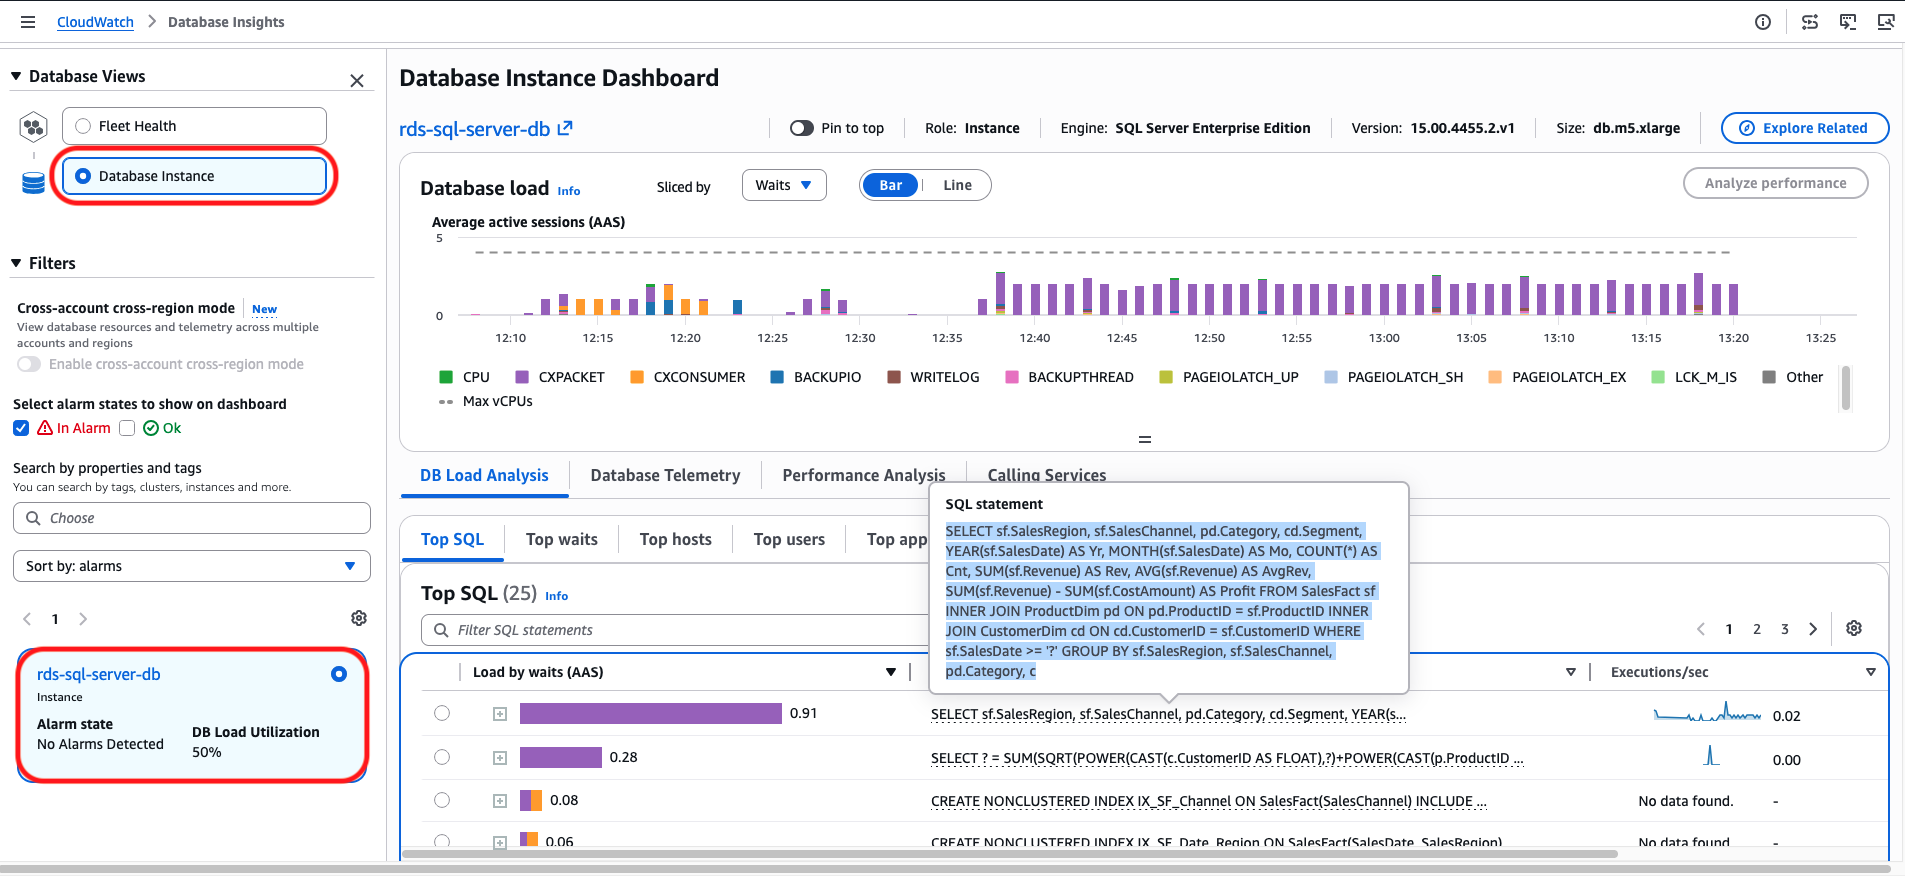
DB Instance view showing the AAS graph with wait event colors and the Top SQL section
Identifying the problematic query
The Top SQL section (visible in the preceding screenshot) shows 25 queries ranked by their AAS contribution. From this view, we can identify a specific reporting query that is consuming a disproportionate amount of CPU. Note the SQL text of this query. We will need to find it in Query Store in the next step.
Step 2: Diagnose with Query Store
A common cause of sudden query performance degradation is an execution plan change. The SQL Server query optimizer chooses the most efficient plan based on available statistics, indexes, and data distribution. However, this choice can change over time, and a new plan isn’t always better than the previous one.
Query Store tracks which execution plan was used for each query and when. This helps us determine whether the query flagged by Database Insights has experienced a plan change.
Opening the Regressed Queries report
In SSMS, we connect to the database that contains the problematic query identified in Database Insights. In this scenario, it is BI_SalesAnalytics, one of our analytical databases.
To access the Regressed Queries report:
- In Object Explorer, expand your RDS instance connection.
- Expand Databases → BI_SalesAnalytics.
- Expand the Query Store folder.
- Open the context (right-click) menu for Regressed Queries and choose View Report.
The Regressed Queries report is a built-in Query Store report. It automatically identifies queries whose recent performance is worse than their historical baseline. It compares recent execution metrics (CPU time, duration, logical reads) against historical averages. Then it surfaces queries that have degraded.
Identifying the plan change: The key finding
Select the reporting query that Database Insights identified as the top resource consumer.
Important: Change the time interval in the report to an appropriate time window using the time range selector at the top of the report. This verifies we can see both the old and new execution plans, even if the plan change happened hours ago.
After selecting the query and adjusting the timeline, we can see that this query has been executed with two different execution plans. The following screenshot shows query 10 with two distinct Plan IDs: 13 and 20.
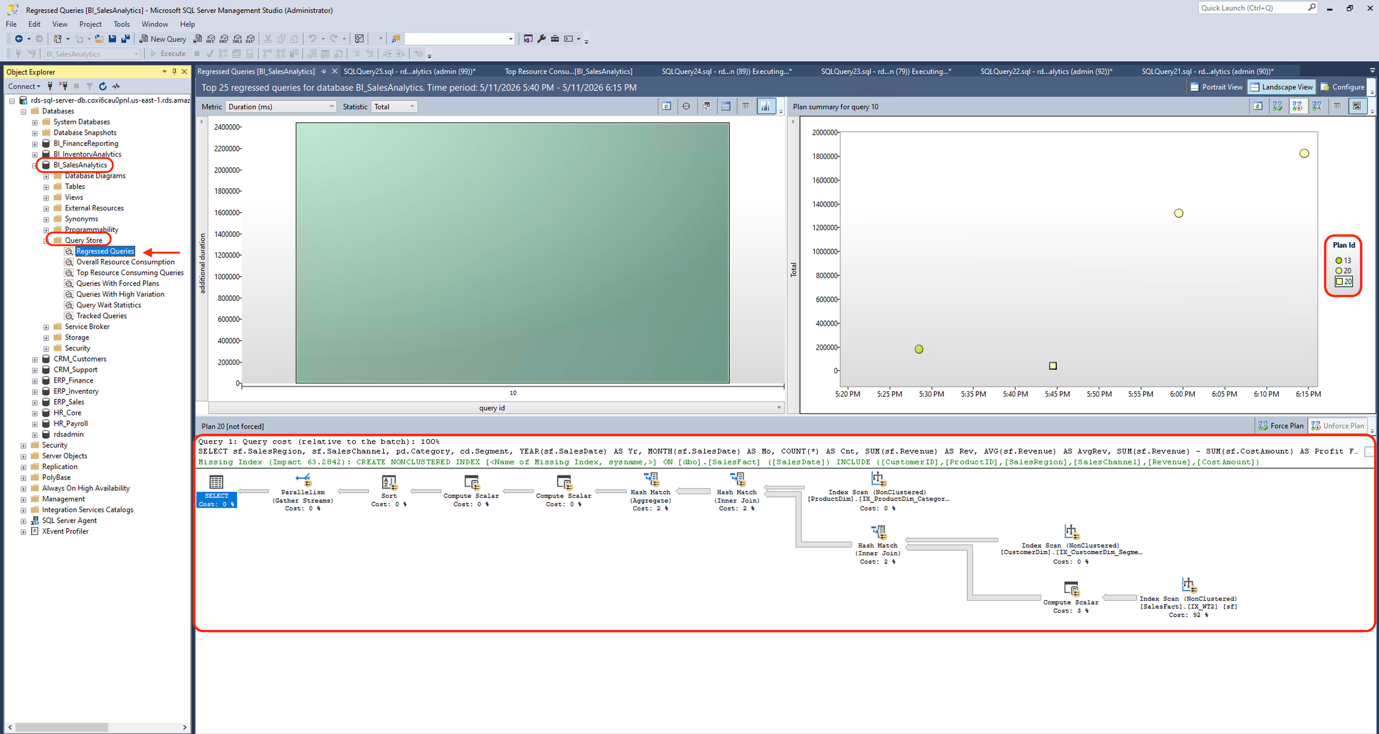
Query Store showing query 10 with two Plan IDs (13 and 20) visible in the timeline
The query text is identical. But the SQL Server optimizer chose a different execution plan that happens to be less efficient for the current data distribution.
Examining both plans reveals the key difference:
- Plan 13 (original, better-performing): Includes an Index Seek operator that navigates the B-tree index directly to qualifying rows, reading only the data needed. The plan also uses Parallelism (Gather Streams), Sort, and Hash Match operators.
- Plan 20 (newer, regressed): Uses an Index Scan operator that reads the entire index sequentially, regardless of query predicates. This is significantly more expensive for large tables. The plan also uses Parallelism (Gather Streams), Compute Scalar, and Hash Match operators.
Why do execution plans change?
SQL Server might generate a new execution plan for several reasons:
- Statistics updates.
- Schema changes.
- Large data modifications.
- Parameter sniffing: when a stored procedure is first compiled, the optimizer creates a plan optimized for the parameter values used in that first execution. If subsequent executions use very different parameter values, the cached plan might be suboptimal.
- Server restarts or memory pressure.
Remediation options from Query Store
Note: Evaluate the following remediation options carefully based on your workload characteristics and maintenance windows. Operations such as forcing plans, updating statistics, creating indexes, and using query hints each carry trade-offs including resource overhead, potential over-subscription, and latency impact. We recommend testing these changes in a non-production environment first and scheduling resource-intensive operations (such as statistics updates and index creation) during low-traffic or maintenance windows. We recommend treating plan forcing as a temporary measure while you address the underlying root cause (stale statistics, missing indexes, parameter sniffing).
After you identify a plan regression in Query Store, you have several options to address it. These range from immediate tactical fixes to longer-term strategic solutions:
Force a plan
With Query Store, you can force SQL Server to always use a specific execution plan. In the Regressed Queries report, select the better-performing plan and choose Force Plan. This is the most immediate remediation option.
To force a plan using T-SQL:
To unforce a plan:
Update statistics
If the plan change was caused by stale statistics, updating them can help the optimizer make better decisions. Use the following T-SQL command:
Add or modify indexes
Review the execution plans for missing index recommendations. SQL Server includes missing index suggestions directly in the execution plan. It detects when an index could significantly improve performance.
Use query hints
For persistent parameter sniffing issues, you can use query hints to guide plan selection:
Beyond the Regressed Queries report, Query Store provides additional reports in the Query Store folder in Object Explorer including Top Resource Consuming Queries, Overall Resource Consumption, and Tracked Queries.
Step 3: Manage workload isolation with Resource Governor
After addressing the immediate plan regression using the remediation options in Step 2 (force plan, update statistics, add indexes), we apply Resource Governor as a protective measure to isolate analytical workloads from transactional workloads. Resource Governor is one of several resolution approaches and is most appropriate when you want to limit resource consumption at the workload level while root cause remediation takes effect or for ongoing workload isolation.
Resource Governor is particularly well-suited for scenarios such as:
- Mixed OLTP and OLAP workloads: Preventing reporting queries from consuming all available CPU and starving transactional workloads.
- Multi-tenant environments: Ensuring one tenant’s workload cannot consume all resources and impact other tenants.
- Scheduled batch jobs: Capping resource usage for ETL or maintenance jobs running alongside production workloads.
For a comprehensive walkthrough of enabling Resource Governor, see the post Optimize database performance using resource governor on Amazon RDS for SQL Server. For the official documentation, see Microsoft SQL Server resource governor with RDS for SQL Server.
In this section, we focus specifically on how to use Resource Governor to resolve the performance issue we identified with Database Insights and Query Store.
Prerequisites for Resource Governor
Before configuring Resource Governor, you must enable it on your RDS instance.
Designing the workload separation
In this scenario, we identified that the problematic queries are analytical/reporting queries. They run against our three BI databases (BI_SalesAnalytics, BI_FinanceReporting, BI_InventoryAnalytics). Our design goals are:
- OLTP workloads (ERP, CRM, HR databases) should have access to the majority of CPU resources. This maintains consistent transaction processing performance.
- Analytical workloads (BI databases) should be capped at 25% CPU. This prevents them from starving transactional queries.
This means the reporting queries will still execute. However, they will take longer to complete because they are limited to 25% of the available CPU. This is the intended trade-off. Transactional workloads maintain consistent, predictable performance. Reporting queries run within their allocated resource budget.
Configuring Resource Governor on Amazon RDS for SQL Server
The following T-SQL creates the resource pool, workload group, and classifier function. Connect to your RDS instance using SSMS and execute each step.
The following screenshot shows the SSMS query window with the Resource Governor registration T-SQL code and success messages.
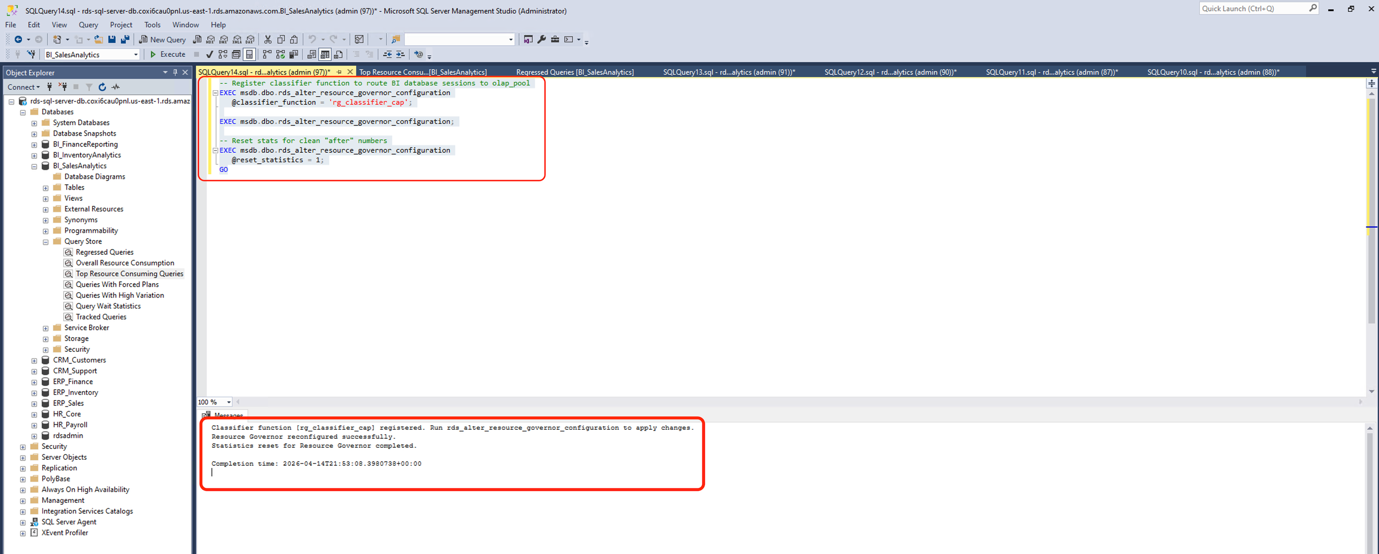
SSMS showing Resource Governor registration with success messages
Step 1: Create the resource pool
The following T-SQL command creates a resource pool for reporting workloads:
This creates a resource pool named reporting_pool with a hard CPU cap of 25%. When sessions in this pool collectively try to use more than 25% of CPU, SQL Server throttles them.
Step 2: Create the workload group
The following T-SQL command creates a workload group within the reporting pool:
This creates a workload group named reporting_group and assigns it to the reporting_pool. All sessions classified into this group will share the 25% CPU budget.
Step 3: Create the classifier function
The following T-SQL command creates a classifier function to route sessions based on the database they connect to:
The classifier function uses ORIGINAL_DB_NAME() to check which database the session is connecting to. If it’s one of the three BI databases, the session is assigned to the reporting_group. This means it’s limited to 25% CPU. Other sessions go to the default group with no additional CPU restrictions.
Note: You can also classify sessions based on other properties. These include SUSER_SNAME() (login name), APP_NAME() (application name), or HOST_NAME() (client hostname). Choose the classification strategy that best fits your environment.
Step 4: Apply the configuration
The following T-SQL command applies the Resource Governor configuration:
This final step activates the Resource Governor configuration. After this, new sessions connecting to the BI databases are classified into the reporting_group and subject to the 25% CPU cap.
Verifying the configuration
After applying the configuration, verify it by querying the Resource Governor dynamic management views (DMVs). Use the following T-SQL query to check resource pools:
The following screenshot shows the DMV query results displaying five resource pools with their CPU caps.
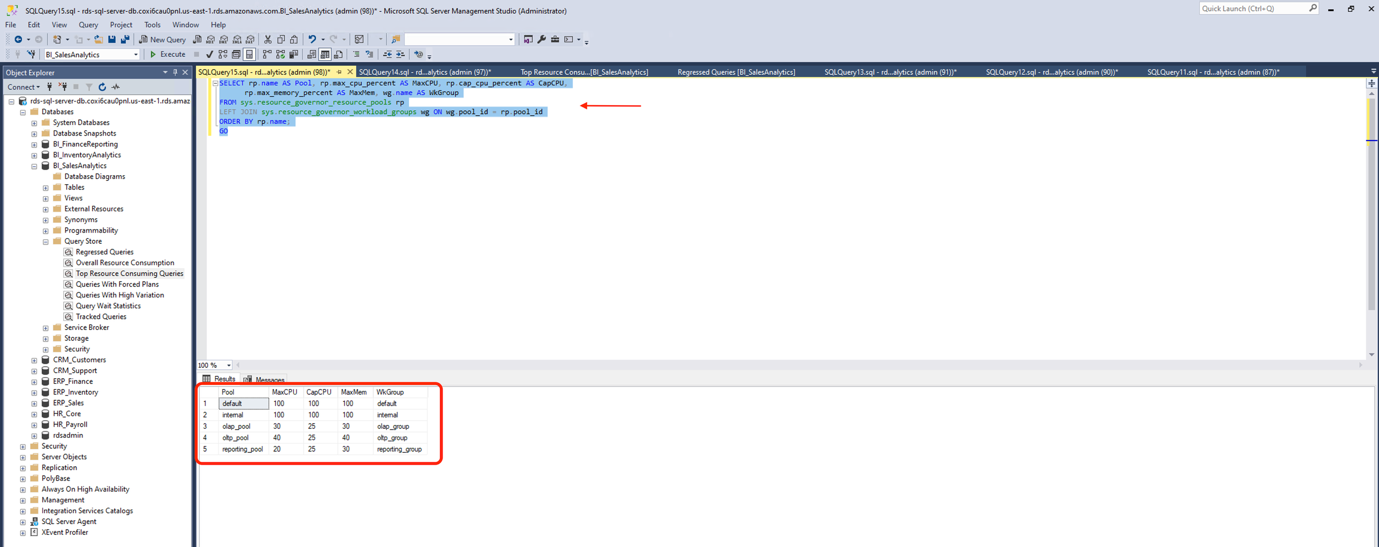
DMV query results showing resource pools including reporting_pool with a 25% CPU cap
The results show your configured pools with their CPU caps. You can also verify the workload groups with the following T-SQL query:
Verify the classifier function is active with the following T-SQL query:
The is_reconfiguration_pending column should show 0. This confirms the configuration is active.
Observing the impact
Note: In this demo, the reporting workload is the dominant CPU consumer, so the drop is significant. In production environments with balanced workloads, the reduction will be proportional to the reporting workload’s share of total CPU.
After applying Resource Governor, we restart the same workloads and observe the results.
CloudWatch CPU utilization
The largest change is visible in the CloudWatch CPUUtilization metric. Before Resource Governor, CPU was at approximately 99%. After applying the 25% cap on reporting workloads, CPU drops to approximately 27-28%.
The following CloudWatch graph shows the CPU utilization before and after implementing Resource Governor.
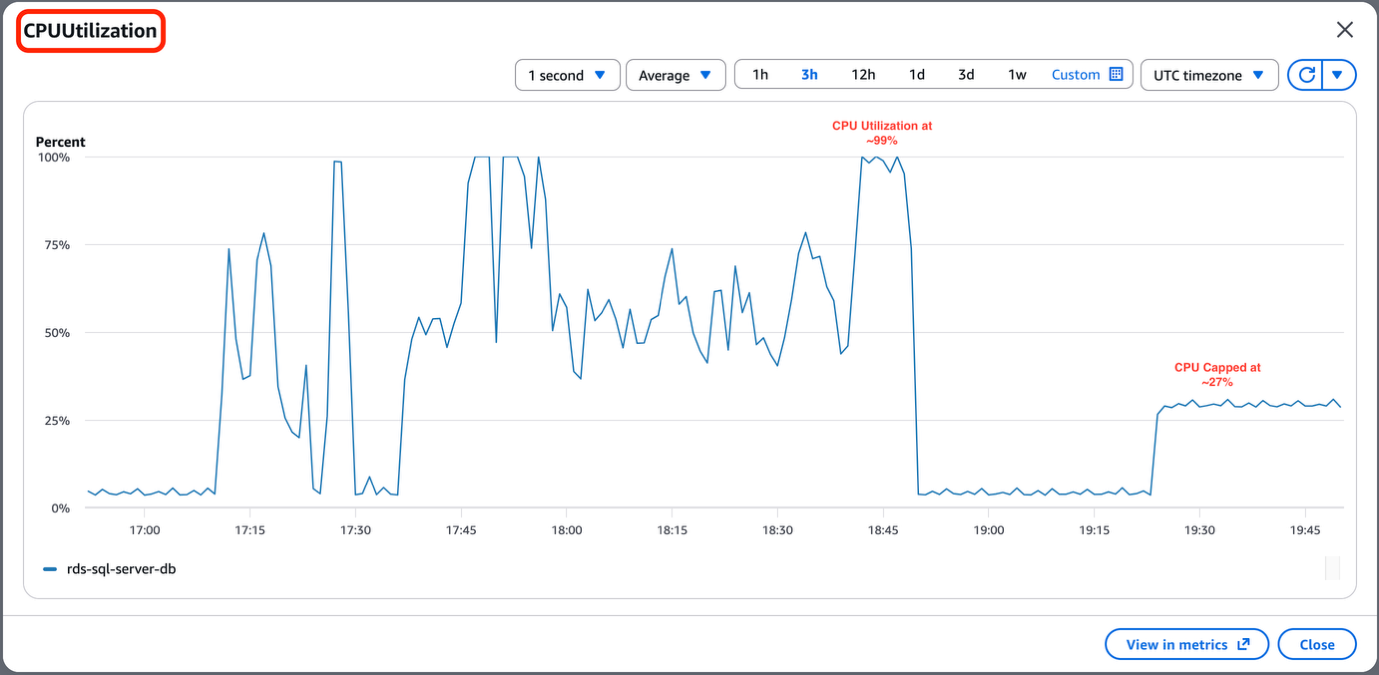
CloudWatch CPUUtilization graph showing the complete before-and-after comparison over 3 hours
Database Insights DB Load
From Database Insights, we can also confirm the reduced database load. The Average Active Sessions (AAS) graph shows a significant reduction. The load is now closer to or below the vCPU line.
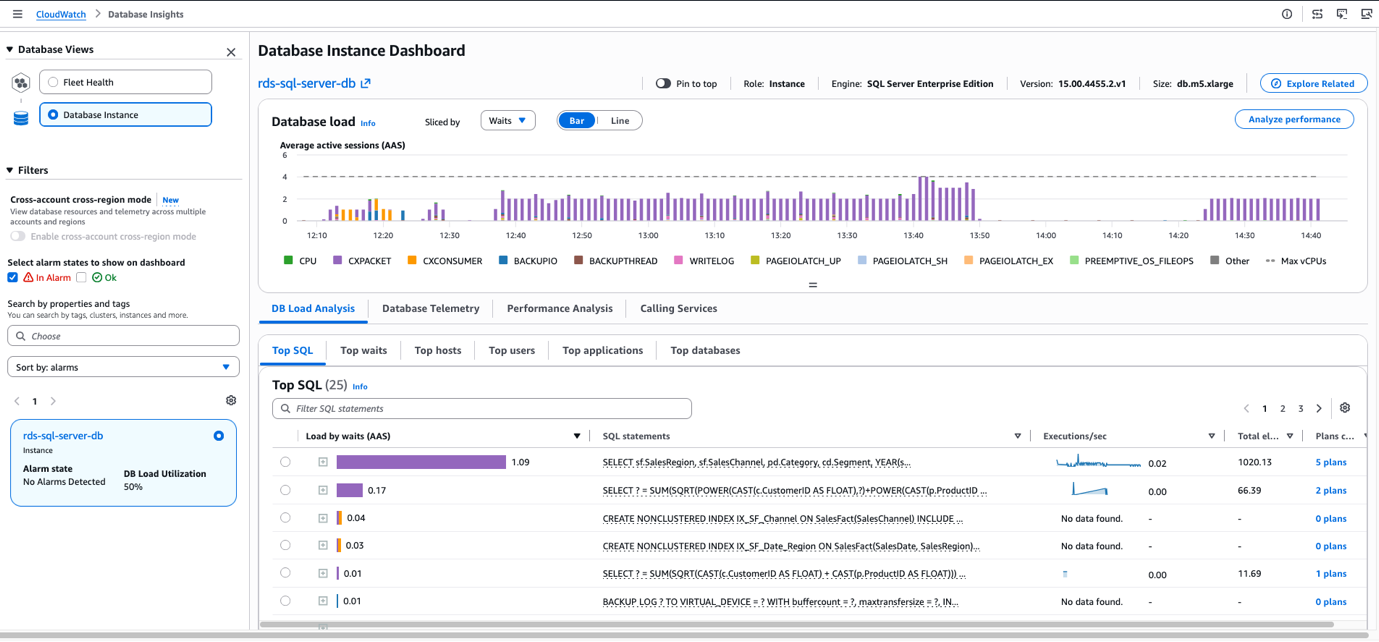
Database Insights DB Instance view after Resource Governor showing reduced AAS load below the vCPU line
Putting it all together
The following list summarizes how each tool contributes to the troubleshooting workflow, mirroring what a DBA would follow in production:
- A customer or monitoring alert reports slow queries.
- Database Insights provides the initial triage.
- Query Store provides the diagnosis.
- You communicate the finding.
- Resource Governor provides workload-level protection.
Best practices
Based on this walkthrough, we recommend the following practices for managing SQL Server performance on Amazon RDS:
Enable Query Store on production databases and review regressed queries regularly
- Use
QUERY_CAPTURE_MODE = AUTOto minimize overhead while capturing meaningful query data. - Set
MAX_STORAGE_SIZE_MBappropriate to your workload (1 GB is a good starting point). - Monitor Query Store space usage with
sys.database_query_store_options. - Query Store is available in SQL Server 2016 and later. SQL Server 2019 and 2022 include improvements to Query Store functionality.
- Consider setting up alerts based on Query Store data to proactively detect regressions.
Configure Resource Governor proactively
- Start with conservative limits and adjust based on observed behavior.
- Monitor Resource Governor effectiveness using the
sys.dm_resource_governor_resource_poolsandsys.dm_resource_governor_workload_groupsDMVs.
Clean up
To avoid ongoing charges, delete the following resources if you created them for this walkthrough:
If you want to keep the RDS instance but remove the Resource Governor configuration, use the following T-SQL command:
Conclusion
This post demonstrates how to use Amazon CloudWatch Database Insights, Query Store, and Resource Governor together to monitor, diagnose, and resolve T-SQL query performance issues on Amazon RDS for SQL Server.
- Database Insights provides the observability layer to detect problems quickly. It offers fleet-level health monitoring, instance-level query analysis, and wait event identification.
- Query Store provides the diagnostic depth to identify execution plan regressions. It proves that a plan change occurred, when it happened, and what both plans look like.
- Resource Governor provides the workload management to prevent resource contention. It helps verify that reporting workloads cannot consume all available CPU at the expense of transactional workloads.
This is one approach to SQL Server performance troubleshooting on Amazon RDS. You can adapt this workflow to meet your specific workload, environment, and performance goals. To get started, enable Database Insights in Advanced mode on your RDS for SQL Server instance and explore Resource Governor on Amazon RDS for workload isolation. Leave your feedback in the comments section.