AWS DevOps & Developer Productivity Blog
Best Practices for Deploying AWS DevOps Agent in Production
Root cause analysis during incidents is one of the most time-consuming and stressful parts of operating cloud applications. Engineers must quickly correlate telemetry data across multiple services, review deployment history, and understand complex application dependencies—all while under pressure to restore service. AWS DevOps Agent changes this paradigm by bringing autonomous investigation capabilities to your operations team, reducing mean time to resolution (MTTR) from hours to minutes.
However, the effectiveness of AWS DevOps Agent depends heavily on how you configure your Agent Spaces which control resource access boundaries. An Agent Space that’s too narrow misses critical context during investigations. One that’s too broad introduces performance overhead and complexity. This post provides best practices for setting up Agent Spaces that balance investigation capability with operational efficiency, drawing from our experience onboarding early customers and using DevOps agent across our own teams.
By the end of this post, you’ll understand how to structure Agent Spaces for optimal investigation accuracy, determine the right scope of resource access, and use Infrastructure as Code (IaC) to streamline deployment. Let’s start by understanding the foundational concept that makes all of this possible: the Agent Space itself.
What is an Agent Space and Why Does It Matter?
An Agent Space is a logical container that defines what AWS DevOps Agent can access and investigate. Think of it as the agent’s operational boundary—it determines which cloud accounts the agent can query, which third-party integrations are available, and who can interact with investigations.
Agent Spaces are critical because AWS DevOps Agent needs sufficient context to perform accurate root cause analysis.
When an incident occurs, the agent:
- Learns your resources and their relationships across accounts
- Correlates telemetry data from logs, metrics, and traces
- Reviews recent changes including deployments and configuration updates
- Generates and tests hypotheses by querying additional data sources
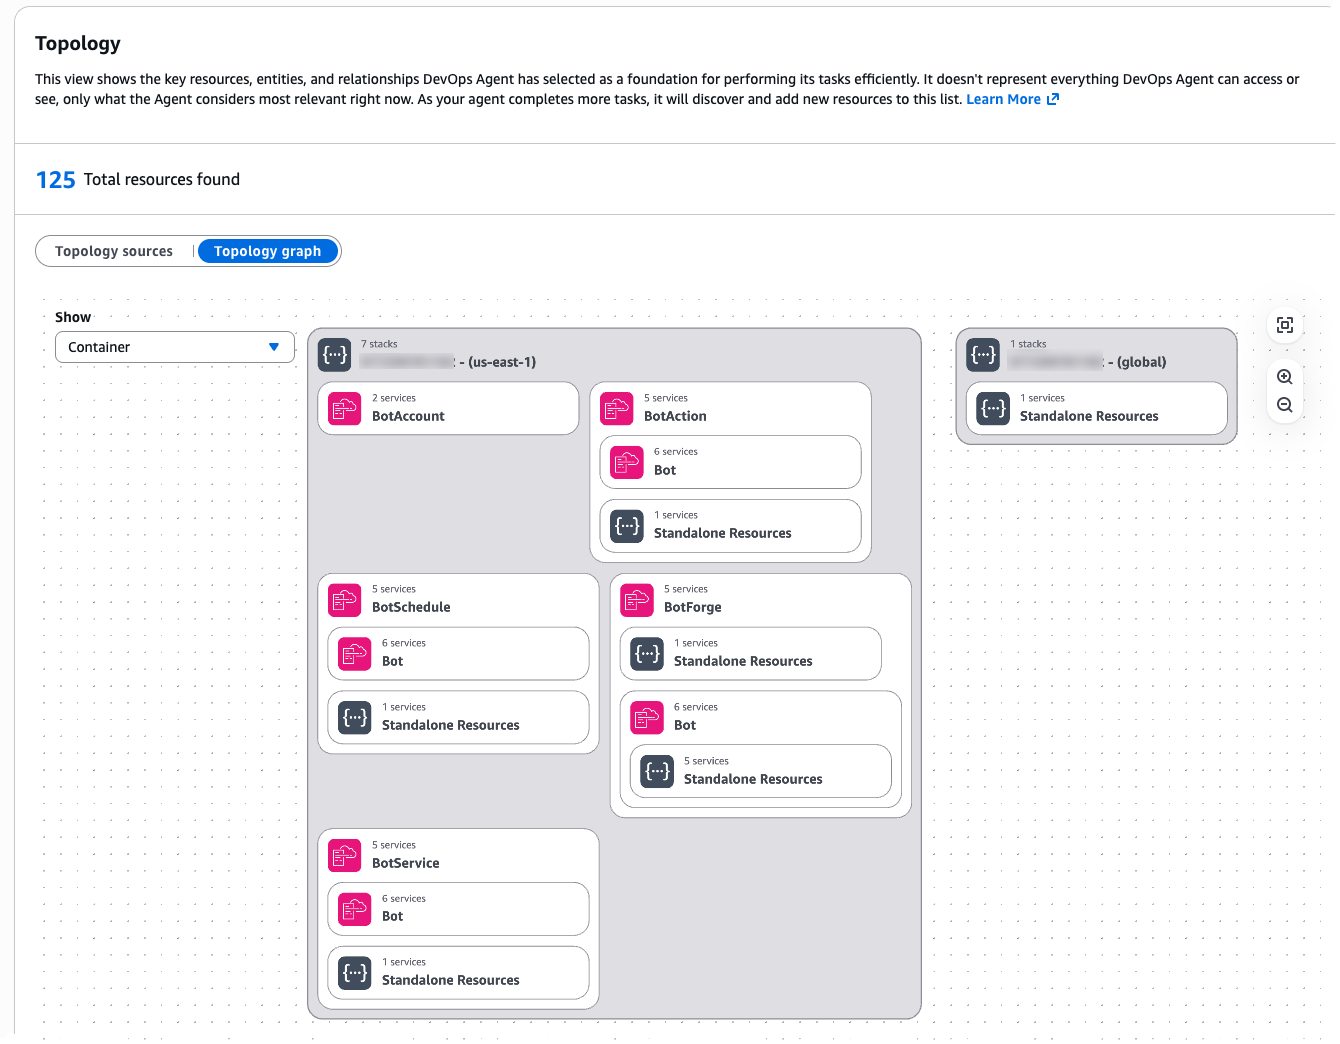
Figure 1: Agent Space Topology
If the Agent Space doesn’t include access to a critical account or integration, the agent might miss the root cause entirely. Conversely, an overly broad Agent Space introduces performance challenges as the agent considers more resource permutations during investigations.
Understanding these trade-offs between scope and performance is essential. The question becomes: how do you determine the right boundaries for your specific organization and operational model?”
Part 1: Design your Agent Space architecture
We recommend thinking about Agent Space boundaries the same way you think about on-call responsibilities: grant access to accounts relevant to the application, but separate production from non-production environments.
This approach provides several benefits:
- Familiar mental model – Operations teams already understand on-call boundaries
- Appropriate investigation scope – Mirrors how human engineers would investigate incidents
- Two-way door decision – You can expand or narrow Agent Space scope as needs evolve
- Performance balance – Provides sufficient context without overwhelming the agent
Determine Your Agent Space Boundaries
Start by mapping your application architecture to Agent Space boundaries and consider the following questions:
- What defines a logical application?
- Does your team own multiple independent applications? If so, create separate Agent Spaces. However if the applications are tightly coupled (e.g. micro services dependent on each other) and map to a single resolver group, assigned group for on-call, then consider a single Agent Space per group.
- Is it a monolith spanning multiple accounts? Then one Agent Space with cross-account access makes sense.
- How do you organize on-call rotations?
- Separate teams for production versus non-production suggests separate Agent Spaces.
- One team handling all environments might work with one Agent Space per application.
- What are your investigation patterns?
- Do production incidents require querying dependent services in other accounts? Include those accounts.
- Are environments completely isolated? Keep Agent Spaces separate.
Example decision tree:
Application: E-commerce Platform
├── Production environment
│ ├── Account 111111111111 (Frontend)
│ ├── Account 222222222222 (API Gateway + Lambda)
│ └── Account 333333333333 (RDS + DynamoDB)
├── Staging environment
│ └── Account 444444444444 (All resources)
└── Development environment
└── Account 555555555555 (All resources)
Recommended Agent Spaces:
→ "EcommerceProd" (accounts 111111111111, 222222222222, 333333333333)
→ "EcommerceNonProd" (accounts 444444444444, 555555555555)
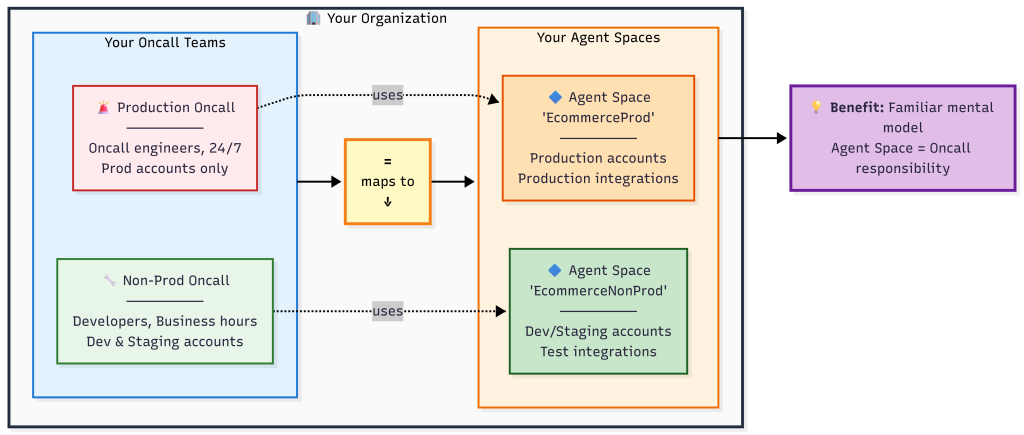
Figure 2: Agent Space boundaries mirror on-call team responsibilities
Common Agent Space Patterns and Decision Points
Beyond the basic single-application pattern, organizations encounter more complex scenarios that require careful consideration. Here are critical patterns to address these scenarios that we’ve seen customers successfully adopt:
Pattern 1: Investigations Spanning Multiple Teams. Large organizations with multiple teams (example: 3 teams managing 100+ production accounts) encounter situations where an issue originates in Team A’s infrastructure but the root cause lies in Team B’s services. The question becomes: how do you enable collaboration across Agent Spaces?
Recommended approach: Create application-specific Agent Spaces that include read-only access to shared resource accounts (e.g. dependencies). Establish clear on-call escalation procedures and add them as runbooks when investigations identify cross-team root causes for efficient communication (e.g. via chat in Slack). Configure the shared service team’s resources with tags identifying which applications use them (example: app-id: ecommerce-frontend). Following a consistent tagging strategy provides investigation context for shared resources while maintaining clear resource ownership.
Pattern 2: Shared Services and Network Operations Center (NOC) Teams. Some organizations have centralized teams that provide and support shared infrastructure services (databases, networking, monitoring, security) used by multiple applications across the organization. These NOC or central operations teams need visibility into their services without requiring access to every application’s Agent Space.
Recommended approach: Create a dedicated Agent Space for the shared service team and configure an Agent Space scoped to the shared service team’s infrastructure and operational responsibilities:
- Include AWS accounts containing shared databases, network infrastructure, centralized logging, and monitoring systems.
- Configure IAM roles that provide read-only access to the specific resources the team supports
- Include runbooks and operational procedures specific to the shared services
This follows the same principle as application-specific Agent Spaces: one Agent Space per on-call team, even when that Agent Space’s scope spans multiple applications.
Pattern 3: Central Operations Teams Managing Many Applications. While shared services teams manage specific infrastructure domains, SRE teams often face an even larger challenge: operational responsibility for hundreds or thousands of applications at enterprise scale. Central operations teams responsible for operational tooling across hundreds or thousands of applications can efficiently manage Agent Spaces at scale using Infrastructure as Code.
Recommended approach: Use the AWS CDK or Terraform samples available as starting points. These samples enable teams to:
- Define a standardized Agent Space template with your organization’s required IAM roles, integrations, and resource boundaries
- Deploy Agent Spaces programmatically as part of application onboarding workflows
- Enforce compliance through AWS Config rules or service control policies
- Track all Agent Spaces through consolidated billing and tagging (application-id, team, cost-center, environment)
Central operations teams manage the templates and governance policies, while application teams operate within those guardrails. This approach scales to thousands of applications with consistent configuration and automated deployment. AWS DevOps agent allows limiting agent access in an AWS account and controlling access for users to the operator console for teams to manage Agent Space access at scale.
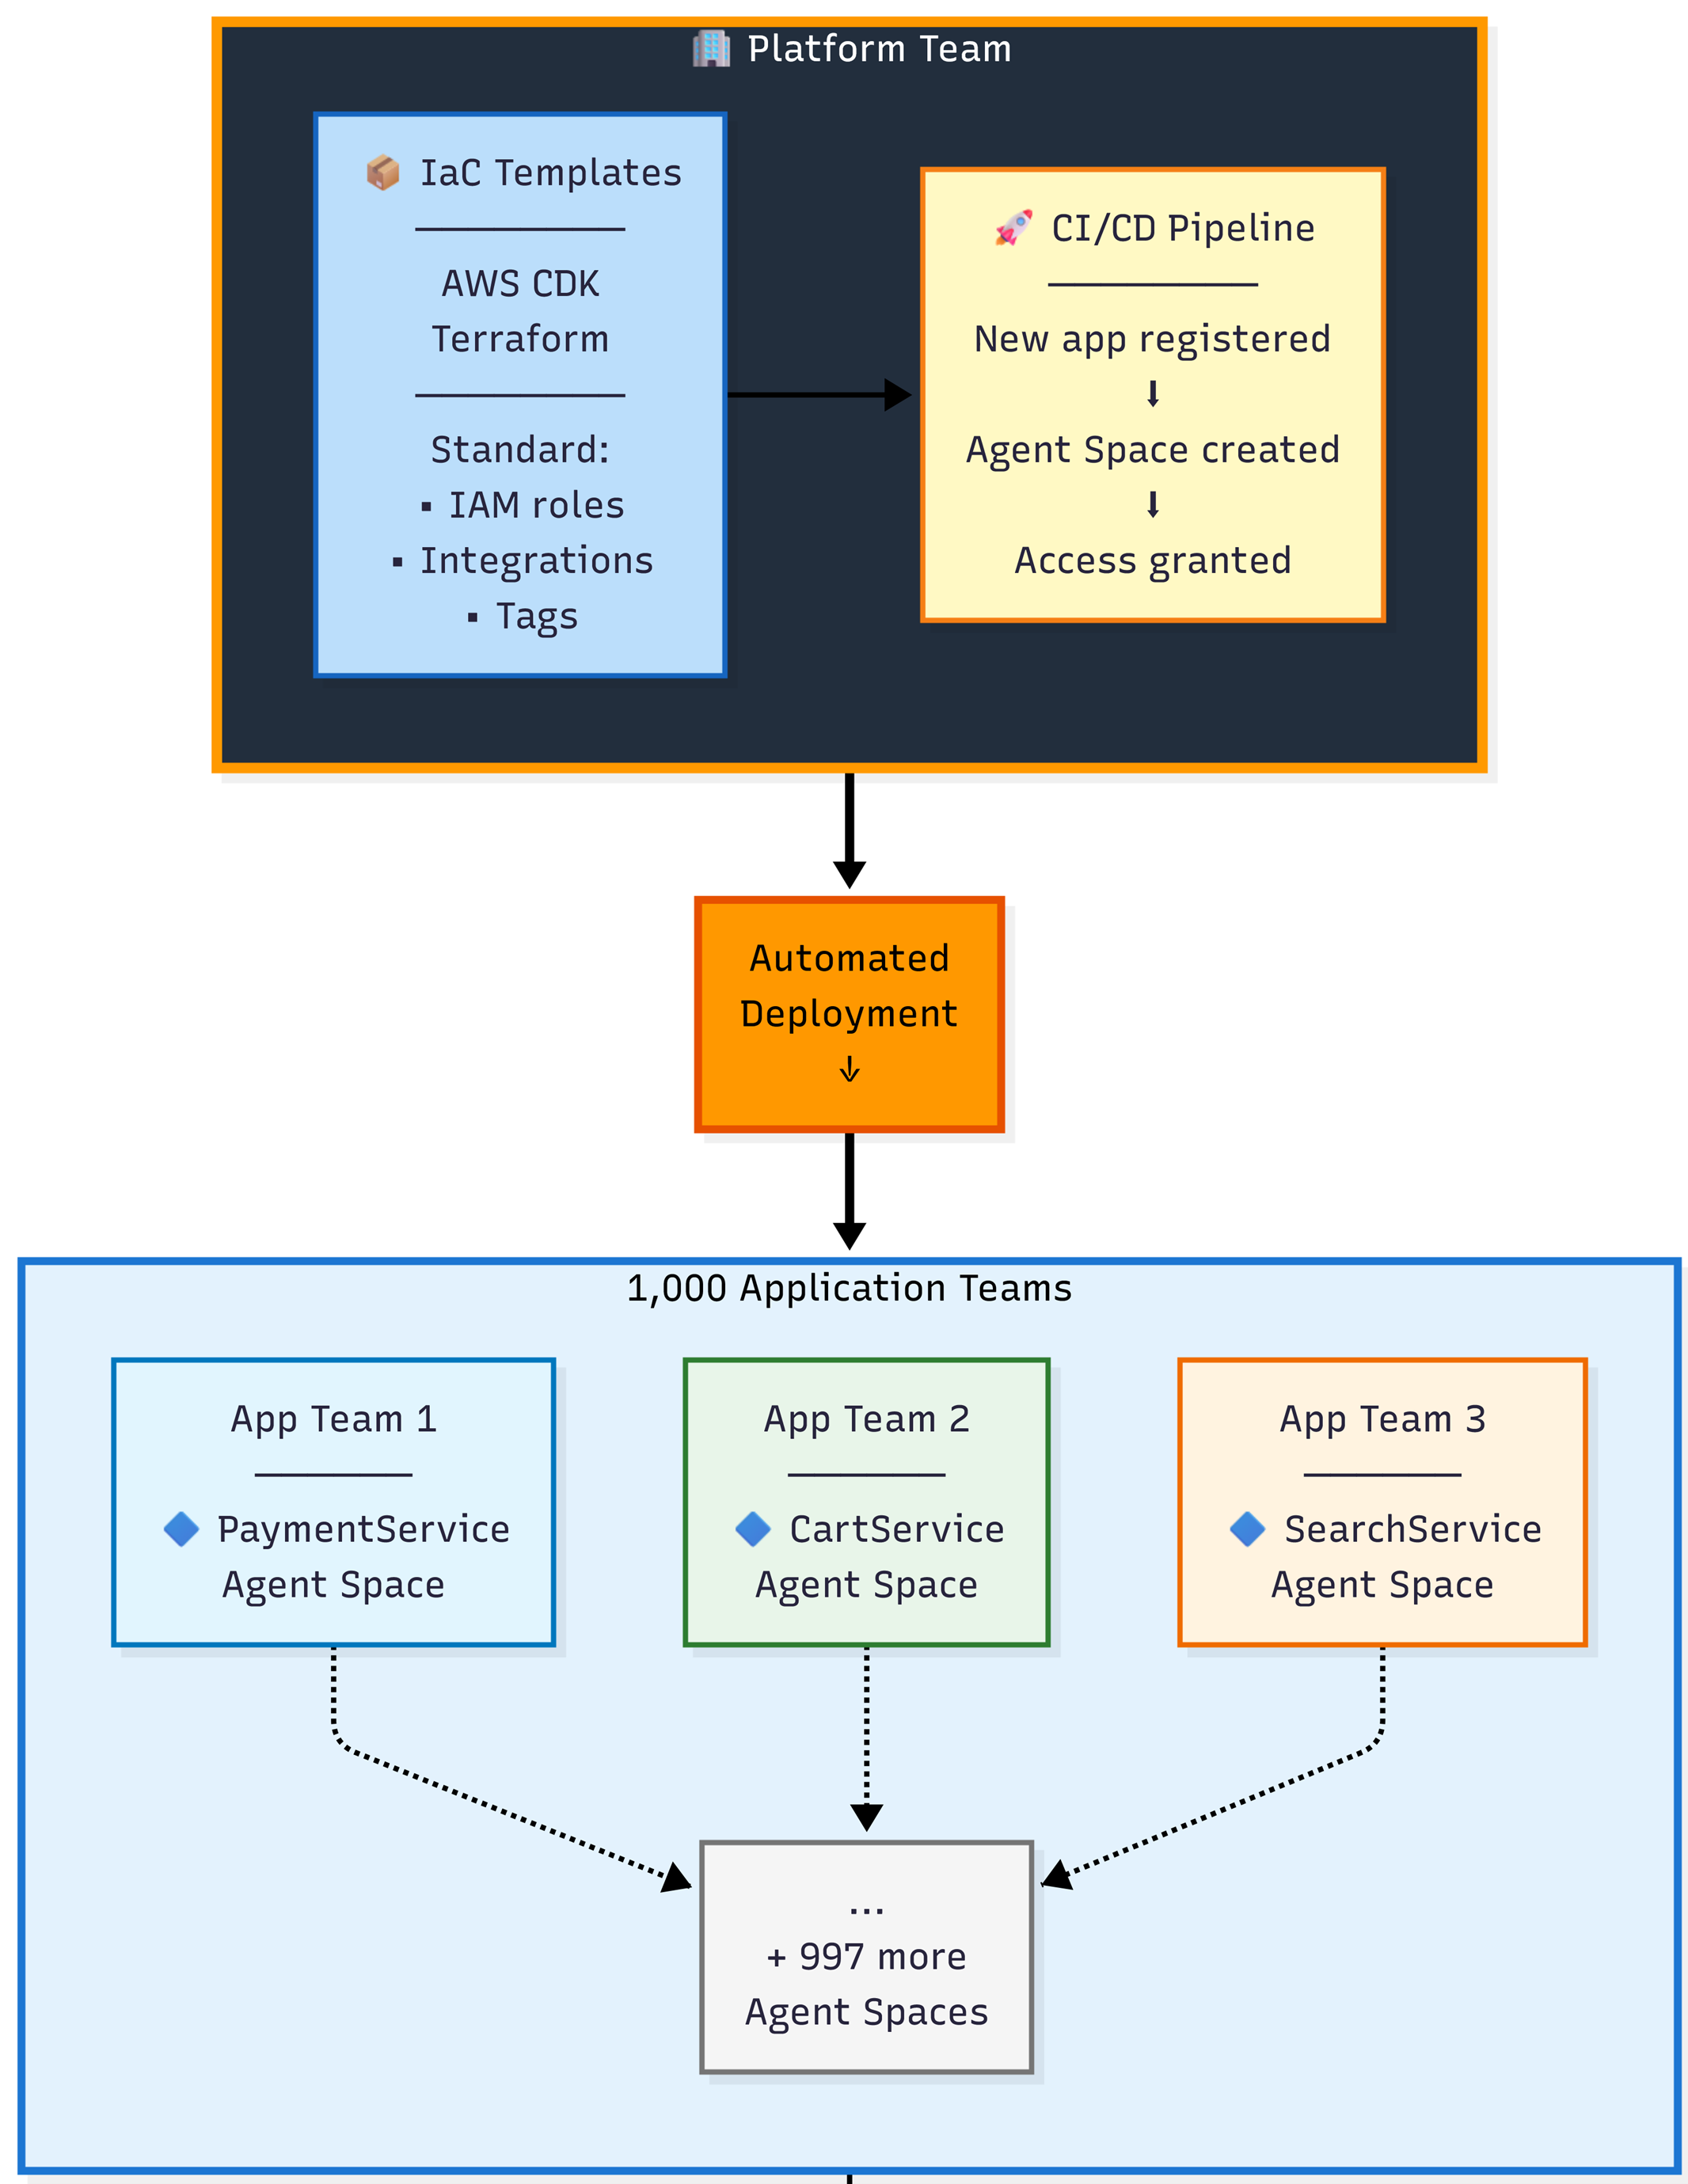
Figure 3: Enterprise scale pattern using Infrastructure as Code
Now that you understand how to design Agent Space boundaries aligned with your team structure and scale requirements, let’s walk through the practical implementation steps to bring these architectural patterns to life.
Part 2: Implement your Agent Space architecture
This section walks you through the practical steps of creating your first Agent Space—from verifying prerequisites and configuring IAM roles across accounts to integrating observability tools, setting up access controls, and testing your configuration to ensure investigations have the context they need.
Step 1: Agent Space Prerequisites
Before setting up your first Agent Space, ensure you have:
- AWS accounts – At least one AWS account where your application resources run
- IAM permissions – Sufficient access to create IAM roles and policies across accounts. AWS DevOps Agent requires two distinct sets of IAM permissions:
- Agent Space role permissions – The IAM role that AWS DevOps Agent assumes to query your AWS resources, access CloudWatch Logs, and discover topology. This role requires the
AIOpsAssistantPolicymanaged policy plus additional permissions for AWS Support and expanded capabilities. See the CLI onboarding guide for the complete role configuration. - Operator app role permissions – The IAM role that controls what human operators can do in the AWS DevOps Agent web application, such as starting investigations, viewing results, and creating AWS Support cases. This role is separate from the agent’s investigation permissions.
- Agent Space role permissions – The IAM role that AWS DevOps Agent assumes to query your AWS resources, access CloudWatch Logs, and discover topology. This role requires the
- Service Control Policies (SCPs) – Verify that your organization’s SCPs allow AWS DevOps Agent API actions. Common issue: Teams complete Agent Space setup but investigations fail because SCPs block
aidevops:*actions orbedrock:InvokeModelactions. Review your AWS Organization’s SCPs and add exceptions for DevOps Agent if needed. Note that DevOps Agent and Amazon Bedrock inference are not impacted by policies that restrict customer content to specific AWS regions—Bedrock may use US regions other than US East (N. Virginia) for stateless inference. - Observability tools – At minimum, Amazon CloudWatch (automatically available via IAM roles) and Amazon CloudTrail. For comprehensive investigations, integrate Application Performance Monitoring tools like Datadog, Dynatrace, New Relic, Grafana, or Splunk. See Connecting telemetry sources for supported integrations.
- Understanding third-party integration configuration – Some third-party tools require a two-step configuration process:
- Account-level registration – Tools that use OAuth (like GitHub, Dynatrace) must first be registered at the AWS account level through the DevOps Agent console. This establishes OAuth credentials that are shared across all Agent Spaces in your account.
- Agent Space-level association – After registration, each Agent Space individually specifies which resources from that tool to use. For example, after registering GitHub once, Agent Space “EcommerceProd” can associate only production repositories while Agent Space “EcommerceNonProd” associates development repositories. Other tools like Datadog, New Relic, and Splunk can be directly associated with an Agent Space using API keys or tokens without separate account-level registration. CloudWatch requires no additional configuration beyond IAM roles.
- Source control – GitHub or GitLab repository access for code context and deployment correlation (optional but highly recommended)
- IaC tooling – AWS CDK (TypeScript/Python), Terraform, AWS CLI, or AWS Management Console for Agent Space deployment
With prerequisites verified, you’re ready to create your Agent Space and establish the IAM trust relationships that enable investigations.
Step 2: Create an Agent Space
AWS DevOps Agent requires IAM roles in each AWS account within the Agent Space boundary. The agent assumes these roles to query CloudWatch Logs, describe resources, and build application topology.
The AWS DevOps Agent is designed to retrieve operational data from multiple AWS Regions across all AWS accounts that you grant access to within the configured Agent Space, enabling comprehensive visibility into distributed infrastructure and applications regardless of their geographic deployment, while supporting multiple accounts through a configuration process that involves creating IAM roles with appropriate trust policies and permissions in secondary accounts
Option A: Use the AWS Console wizard
Navigate to the AWS DevOps Agent console and choose Create Agent Space and follow the guided setup to create IAM roles in each target account.
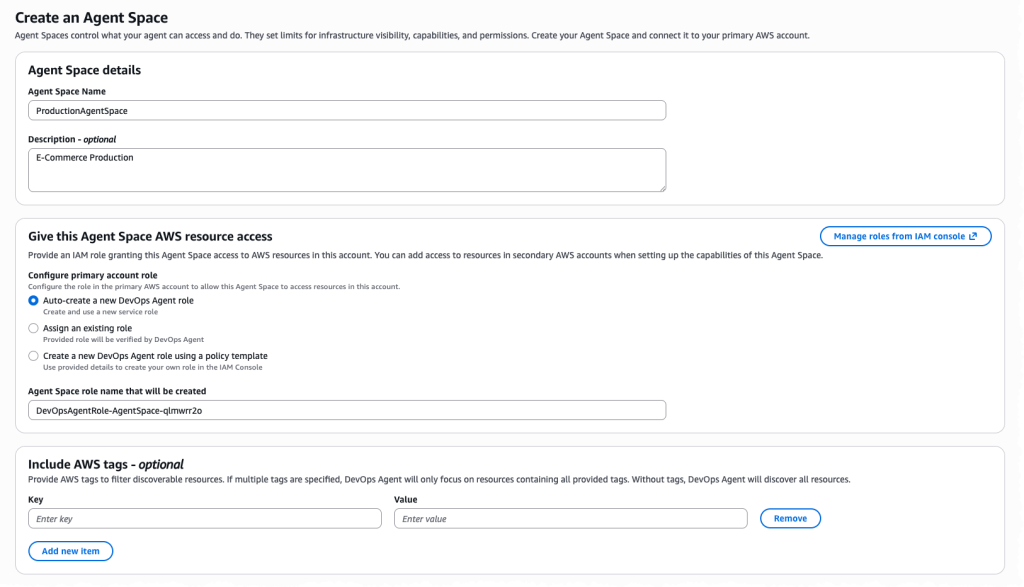
Figure 4: Creating an Agent Space in the Console
The setup wizard helps in configuring cross-account trust relationships.
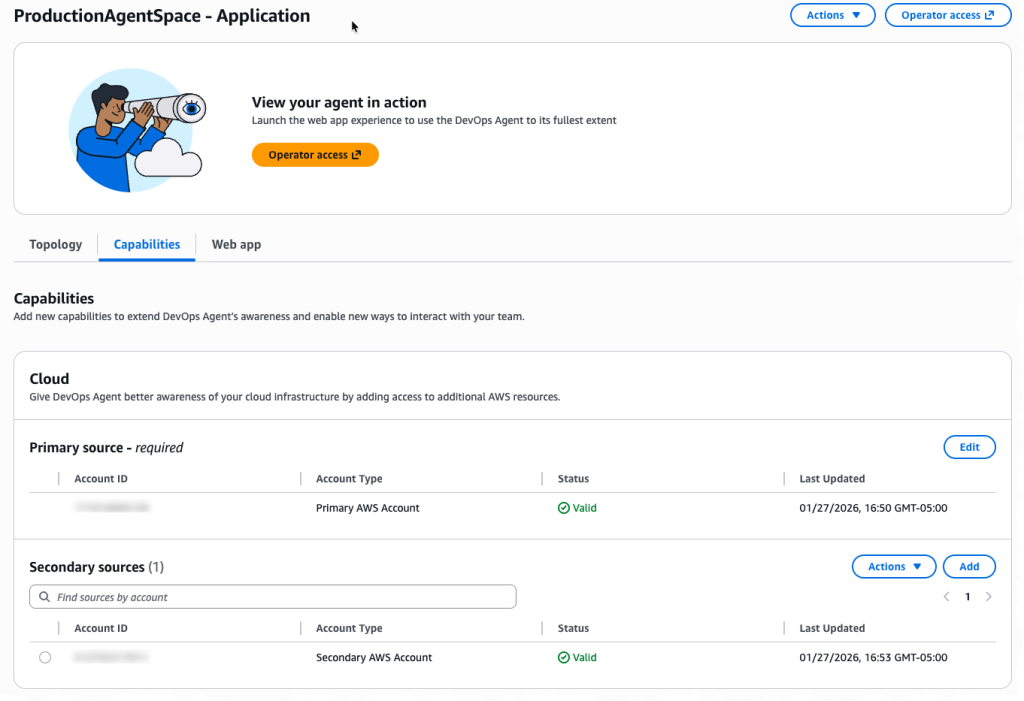
Figure 5: Multiple account configuration for your Agent Space
Option B: Use Infrastructure as Code (Recommended)
We provide sample CDK and Terraform templates that automate Agent Space creation and IAM role deployment across multiple accounts.
AWS CDK example (TypeScript):
//If you have many accounts, use a loop:

const accounts = [
  { id: '111111111111', name: 'Prod', role: prodRole, stage: 'prod' },
  { id: '222222222222', name: 'Dev', role: devRole, stage: 'dev' },
  { id: '333333333333', name: 'Test', role: testRole, stage: 'test' },
];

accounts.forEach(account => {
  const association = new devopsagent.CfnAssociation(this, `${account.name}Association`, {
    agentSpaceId: agentSpace.ref,
    serviceId: 'aws',
    configuration: {
      aws: {
        assumableRoleArn: account.role.roleArn,
        accountId: account.id,
        accountType: 'monitor'
      }
    }
  });

  association.addDependency(agentSpace);
  cdk.Tags.of(association).add('stage', account.stage);
});
For detailed instructions on setting up IAM roles and permissions across accounts, see the CLI Onboarding Guide.
Once your Agent Space exists and has access to AWS accounts, the next critical step is connecting the observability and development tools that provide investigation context beyond AWS native services.
Step 3: Configure Integrations
AWS DevOps Agent investigates incidents by correlating data from multiple sources. The more context available, the more accurate the root cause analysis.
Recommended integrations by priority:
- Amazon CloudWatch – Provides logs, metrics, and traces from AWS services. The agent queries CloudWatch Logs Insights automatically during investigations. No additional configuration is needed if IAM roles are properly configured.
- Observability tools – Datadog, Dynatrace, New Relic, and Splunk provide distributed tracing, logs, metrics, and application-level context. Configure via Agent Space integrations in the AWS Console.
- Code repositories – GitHub or GitLab integration enables the agent to review recent deployments and code changes. Requires OAuth or personal access token.
- CI/CD pipelines – GitHub Actions or GitLab workflows help the agent correlate incidents with deployment timing. Configured alongside code repository integration.
- Communication Channels – Slack and ServiceNow integration enables DevOps Agent to post real-time investigation updates to team channels and automatically update incident tickets with findings, root cause analysis, and recommended mitigation steps throughout the investigation lifecycle.
Advanced Integrations
Beyond built-in integrations, AWS DevOps Agent supports webhook triggered investigations and custom MCP (Model Context Protocol) servers so you can bring-your-own observability tools.
Webhook configuration for investigation triggers
Webhooks allow external systems (Grafana, Prometheus, PagerDuty, custom monitoring tools) to automatically trigger DevOps Agent investigations when incidents occur. Each Agent Space receives a unique webhook URL that accepts JSON payloads describing the incident.
Common configuration pitfalls:
- Webhook authentication: Webhooks use HMAC signatures for security. Store the webhook secret in AWS Secrets Manager and rotate it according to your security policies.
- Payload format: Ensure your monitoring tool sends incident context including timestamps, affected resources, and symptom descriptions. Richer context enables more accurate investigations.
For detailed webhook setup, see Invoking DevOps Agent through Webhook.
Bring-your-own MCP servers
If you use observability tools beyond the built-in integrations (Grafana, Prometheus, custom telemetry systems), you can connect them via MCP servers. MCP servers expose your tool’s data through a standardized protocol that DevOps Agent queries during investigations.
Key requirements for MCP servers:
- Publicly accessible HTTPS endpoint: MCP servers must be reachable from the public internet. VPC-hosted servers are not currently supported.
- Read-only tools only: For security, only expose MCP tools that perform read operations. Write operations introduce prompt injection risks.
- Tool allowlisting: Register MCP servers at the account level, then selectively enable specific tools per Agent Space. Don’t grant access to all tools—choose only those relevant to investigations.
Common MCP setup errors:
- Authentication misconfiguration: MCP servers support OAuth 2.0 or API key authentication. Verify your OAuth client credentials are correct and that token exchange URLs are accessible from AWS infrastructure.
- Tool name length: MCP tool names have a maximum length of 64 characters. Longer names will fail registration.
- Endpoint URL format: Use the full HTTPS URL including path. Example:
https://mcp.example.com/v1/mcpnot justmcp.example.com.
For comprehensive MCP server setup including authentication configuration, see Connecting MCP Servers.
Testing your integrations
After configuring webhooks or MCP servers, trigger a test investigation to verify connectivity:
- For webhooks: Send a test payload from your monitoring tool and verify the investigation starts in the DevOps Agent web app
- For MCP servers: Start an investigation manually and check the agent journal to confirm it successfully called your MCP tools
- Review any errors in AWS CloudTrail logs which capture all DevOps Agent API calls including integration attempts
With your data sources connected, you now need to ensure the right people have appropriate access to investigations while maintaining security boundaries.
Step 4: Configure Access Controls
Agent Spaces support fine-grained access controls to ensure only authorized team members can interact with investigations.
Access control considerations:
- Who should view investigations? Typically on-call engineers, SREs, and DevOps engineers. Consider including security teams for security-related incidents.
- Who should create AWS Support cases? Typically on-call leads and senior engineers. Restrict this permission to prevent excessive case creation.
- Who should modify Agent Space configuration? Typically central operations or infrastructure teams. Separate this from day-to-day investigation access.
IAM-based access control:
AWS DevOps Agent uses IAM policies to control access to Agent Spaces. Attach policies to IAM users, groups, or roles:
{
  "Version": "2012-10-17",
  "Statement": [
    {
      "Effect": "Allow",
      "Action": [
        "devopsagent:GetAgentSpace",
        "devopsagent:StartInvestigation",
        "devopsagent:GetInvestigation",
        "devopsagent:ListInvestigations"
      ],
      "Resource": "arn:aws:devopsagent:us-east-1:123456789012:agentspace/EcommerceProd"
    }
  ]
}
AWS DevOps Agent operates within your AWS environment with privileged access to operational data across multiple accounts. While general security foundations apply, Agent Space configuration introduces specific considerations. For comprehensive security guidance, see the AWS DevOps Agent Security documentation.
Access controls are in place—now it’s time to validate that your Agent Space configuration provides the investigation coverage you need.
Step 5: Test and Iterate
Agent Space configuration is a two-way door decision. Start with a focused scope and expand based on investigation results.
Testing your Agent Space:
Trigger a test investigation using the AWS DevOps Agent web app.
- Start an investigation and provide symptoms such as “High latency on /api/checkout endpoint”.
- Observe which resources the agent queries.
- Review investigation completeness. Did the agent identify the root cause?
- Were any accounts or services missing from the investigation?
- Did the agent have sufficient telemetry data?
Adjust Agent Space boundaries based on results.
- Add accounts if investigations lack context.
- Add integrations if telemetry gaps exist.
- Narrow scope if performance degrades.
Conclusion
AWS DevOps Agent transforms incident response from a manual, time-consuming process into an autonomous, data-driven investigation. However, the agent’s effectiveness depends on proper Agent Space configuration. By following the on-call based approach—granting access to accounts relevant to your application while separating production from non-production environments—you provide sufficient context for accurate root cause analysis without introducing unnecessary complexity.
Key takeaways:
- Think on-call boundaries – Agent Space scope should mirror how your team investigates incidents
- Use Infrastructure as Code – CDK and Terraform templates ensure consistent, repeatable deployments
- Integrate observability tools – More data sources equals more accurate investigations
- Iterate based on results – Expand or narrow Agent Space scope as investigation patterns emerge
Next steps:
- Create your first Agent Space
We’re committed to making AWS DevOps Agent easier to adopt and more accurate in solving customer problems. Your
Agent Space setup is the foundation for achieving fast, reliable incident resolution. Have questions or feedback? Leave a comment below.