AWS DevOps & Developer Productivity Blog
Measuring Developer Productivity with Amazon Q Developer and Jellyfish
Modern software development teams face increasing pressure to deliver high-quality code faster, while managing growing system complexity. Developers often spend significant time on necessary, but undifferentiated work, or “toil”. Toil is often manual, repetitive, and of limited enduring value, making it a strong candidate for automation or delegation to generative AI tools. The re:Invent 2024 session Unleashing generative AI: Amazon’s journey with Amazon Q Developer (DOP214) discussed how toil and productivity have an inverse relationship. Amazon Q Developer can help decrease toil and free up your developers to work on more productive tasks. Until now, that impact has been hard to show.
This post shows you how to integrate Amazon Q Developer with Jellyfish to measure AI’s impact on developer productivity. You’ll learn how to set up the integration, understand key metrics, and make data-driven decisions about your AI investments.
The Evolution of Developer Productivity Measurement
The initial Amazon Q Developer Dashboard, released in October 2023, provided basic visibility into subscription usage, code generation statistics, and security scans. While these metrics gave customers visibility into basic usage patterns, they wanted deeper insights into how the metrics connected to developer productivity and business outcomes. Since then, updates to the Amazon Q Developer Dashboard provided additional user-level insights, with the most recent changes discussed in the May 2025 blog post: Unlocking the power of Amazon Q: Metrics-driven strategies for better AI coding.
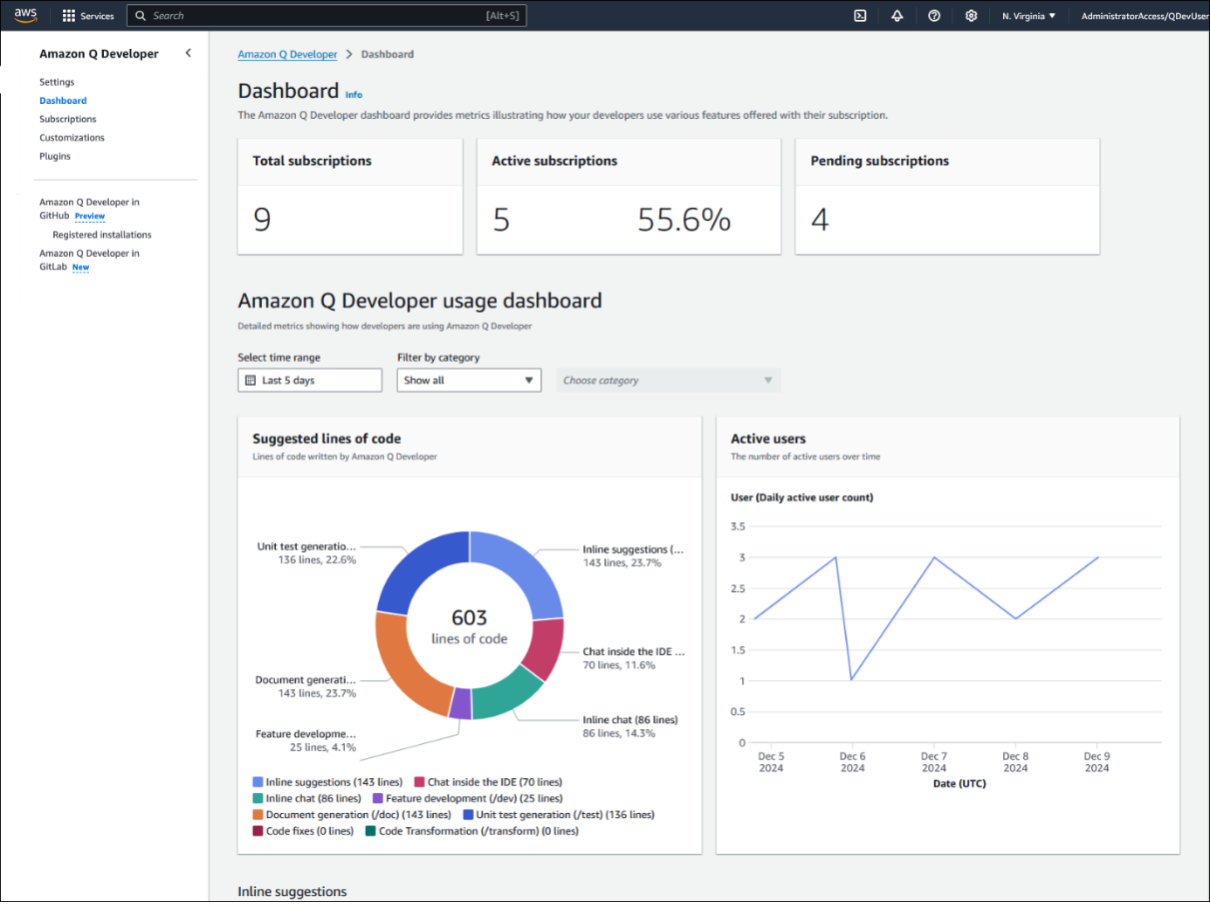
Amazon Q Dashboard in AWS Console
Many organizations face challenges when measuring generative AI impact due to complex organizational structures, fragmented tool chains, and rapidly evolving AI capabilities.
Leaders can make more informed decisions about metrics by working backwards from their desired business outcomes. When customers begin using generative AI tools, they focus on basic usage metrics such as subscription counts and active users. As generative AI adoption grows within an organization, teams want to understand AI impact on productivity and business value. By collecting the right data, leaders can measure how generative AI affects development workflows and business outcomes in their organizations.
Why Integrated Metrics Matter
The April 2025 blog “How generative AI is transforming developer workflows at Amazon” shared that developer productivity metrics are more complex than what any single tool measures. This aligns with established frameworks like DORA and SPACE. Understanding AI’s impact requires visibility across the entire development lifecycle. Organizations are looking for ways to combine data from multiple data sources to get a complete view. Some have created home-grown tools and dashboards while others like Genesys, a global cloud leader in AI-Powered Experience Orchestration, have taken advantage of partners like Jellyfish.
“At Jellyfish, our customers have been asking us for an Amazon Q Developer integration so they can understand the complete picture of how generative AI has transformed, improved and accelerated their software development workflows” – Billy Robbins, Jellyfish Head of Partnerships
The Jellyfish Solution
Jellyfish is an engineering management solution that combines metrics from various development tools. When integrated with Amazon Q Developer, Jellyfish helps you understand how Amazon Q Developer affects your development productivity by analyzing AI usage data alongside engineering metrics. Jellyfish understands the taxonomy of customer organizations allowing you to gain insights at the organizational levels that matter to you. This integration helps engineering leaders measure AI impact on development velocity, track adoption and usage patterns, and calculate the return on investment from AI spend.
“At Genesys, we’ve long been committed to data-driven engineering and deep telemetry across our software development lifecycle. However, quantifying AI’s impact on our development teams was challenging, as the insights from isolated tools were too fragmented to give us a clear overall picture. By partnering with AWS and Jellyfish, we’ve integrated the AI developer tooling our engineers trust with the platforms our leadership team relies on for visibility and alignment. This unified view empowers us to go beyond measuring AI adoption and on to operational metrics like productivity improvements and return on investment, enabling more informed decision-making at every level.” – Craig Dahlinger, Genesys Senior Director, Platform Engineering
Solution Overview
The Amazon Q Developer and Jellyfish integration connects your AI-assisted development metrics with broader engineering analytics. Through secure, automated data flow, the solution provides insights into how AI is transforming your development processes.
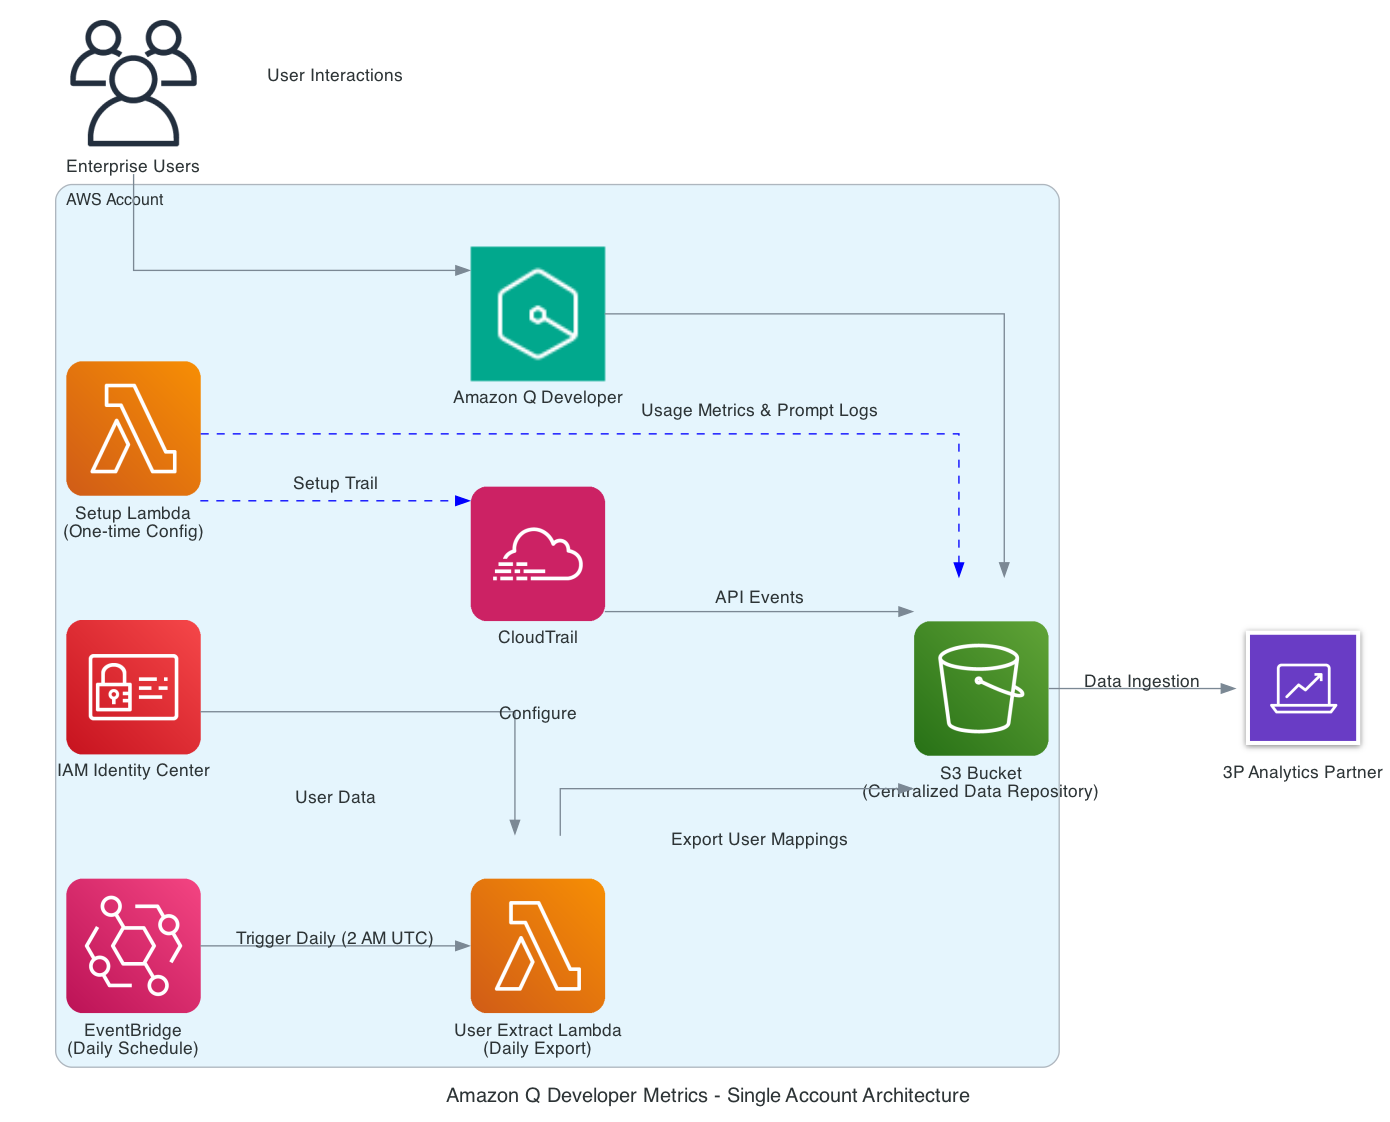
Amazon Q Developer log data ingestion setup
How It Works
Amazon Q Developer automatically captures detailed usage data and prompt logs in your AWS environment. This data flows to a designated Amazon Simple Storage Service (Amazon S3) bucket, which Jellyfish securely accesses through pre-defined IAM roles. Jellyfish processes the information alongside data from your other development tools, providing comprehensive insights through their analytics system.
Key Metrics & Insights
Jellyfish’s AI Impact Dashboard surfaces several important metrics across your development lifecycle:
Engineering Adoption
Visualize how many engineers have adopted Amazon Q Developer across your organization. Users are categorized by cohort: Power, Casual, Idle, and New, giving you a clear picture of adoption. The following screenshot shows a breakdown by user cohorts: out of 77 total engineers, you see 22 Power Users, 20 Casual Users, 6 Idle Users, and 12 New Users. This view helps you understand where you’re succeeding in driving adoption and where there might be room for improvement.
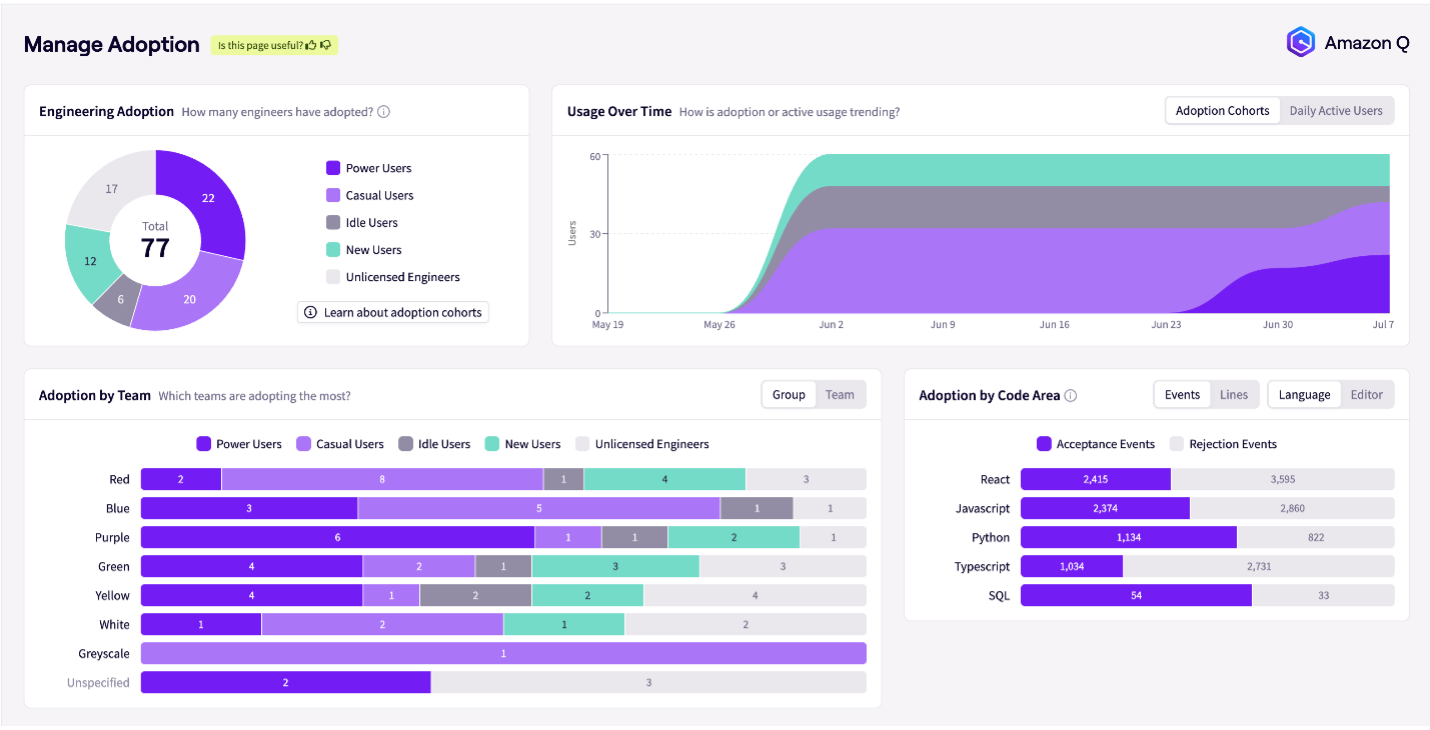
JellyFish Dashboard Manage Adoption
Usage Patterns and Trends
Through intuitive graphs, you can see daily active usage data, adoption trends, and usage patterns over time. This temporal view is crucial to understand how usage evolves and helps you identify successful adoption strategies and potential barriers to consistent use.
You can also see which programming languages benefit most from AI assistance. For example, the Manage Adoption dashboard screenshot above shows higher acceptance rates for AI suggestions in React compared to SQL (2,415 vs. 54), guiding your efforts to expand AI usage across different development areas.
Impact Measurement
Perhaps most crucially, this integration provides concrete impact metrics. You can now measure the reduction in time from first commit to pull request open. For example, the following screenshot shows a 24% reduction, with work time decreasing from 2 days and 23 hours to 2 days and 6 hours. You can also track changes in review time, which might show slight increases as AI-assisted code often requires more thorough review. Throughput improvements are also measurable, with some teams seeing a 142% increase in average monthly pull requests per user, jumping from 2.6 to 6.3 PRs per month.
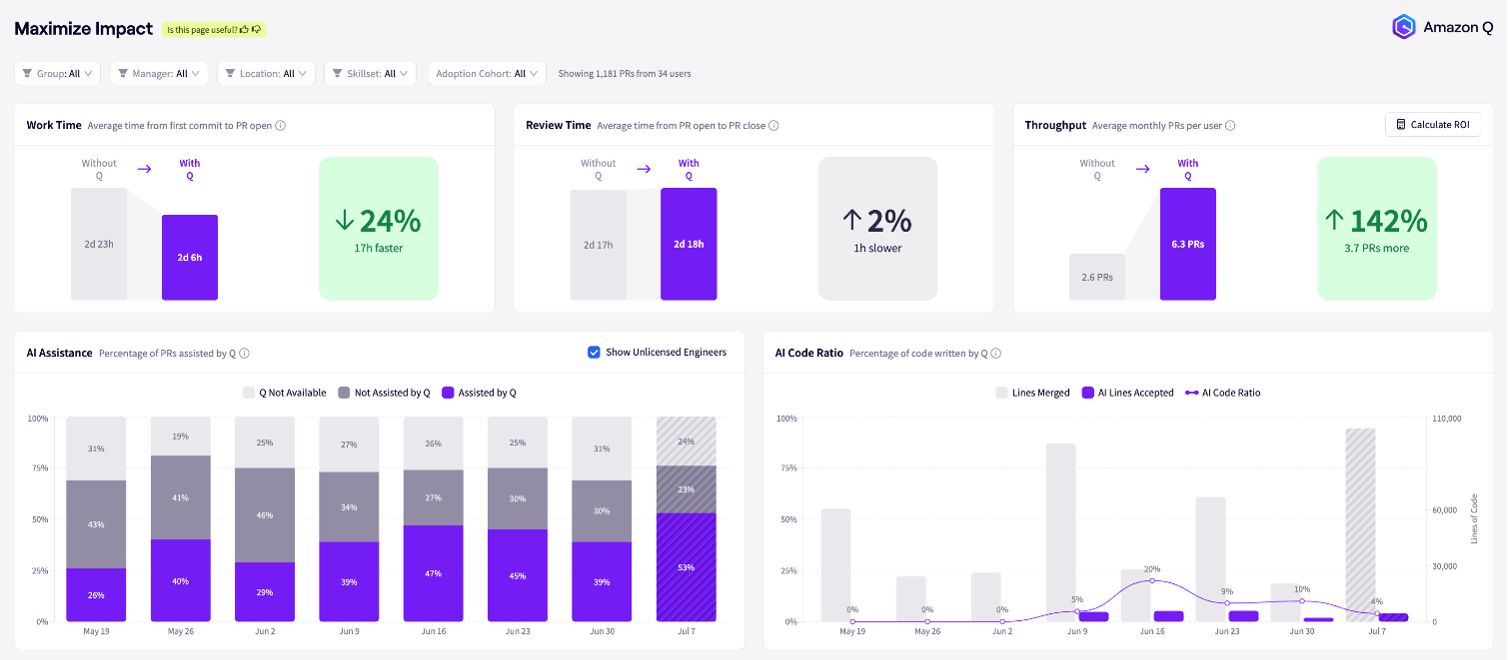
JellyFish Dashboard Maximum Impact
You can use the dashboard to view the percentage of pull requests assisted by Amazon Q Developer over time and track AI adoption. You can also understand the ratio of AI-written to human-written code, providing insight into the level of AI integration in your development process.
Investment Analysis
To round out the picture, you can visualize the impact of tool utilization on investment across different areas such as Growth, KTLO (Keep The Lights On), and Support. This helps you understand how your AI investment is affecting various aspects of your development lifecycle.
Implementation Guide
Prerequisites
Before implementing this integration, make sure you have:
- An active Amazon Q Developer Pro subscription
- Access to the Jellyfish resources
- An AWS account and appropriate AWS permissions to:
-
- Configure S3 buckets
- Manage IAM roles
- Set up CloudTrail logs (optional)
Setup Process
The implementation involves three steps:
Step 1: Enable Amazon Q Developer data collection: Follow the setup process found in this repository, containing automation scripts and detailed instructions. In this step, you configure the necessary AWS resources to collect Amazon Q Developer metrics.
This repository includes:
- Python scripts for local execution
- AWS Lambda functions for serverless deployment
- Comprehensive documentation and testing procedures
Step 2: S3 Access: To grant the JellyFish account/role access to the S3 bucket for logs, update the bucket policy
Sample: Provide Jellyfish the name of your amazon-q-log-bucket
S3 Bucket ARN: <your-amazon-q-log-bucket-arn>
Update S3 Bucket Policy
- Go to AWS S3 Console → Select your Amazon Q log bucket → Permissions tab.
- Click Edit Bucket Policy and add:
{
    "Version": "2012-10-17",
    "Statement": [
        {
            "Effect": "Allow",
            "Principal": {
                "AWS": "arn:aws:iam::0XXXXXXXX5:role/<AccessRoleName>"
            },
            "Action": ["s3:GetObject", "s3:ListBucket"],
            "Resource": [
                "arn:aws:s3:::<your-amazon-q-log-bucket>",
                "arn:aws:s3:::<your-amazon-q-log-bucket>/*"
            ]
        }
    ]
}
Step 3: Verify Setup: Confirm that the data is appearing in your S3 bucket and check with Jellyfish team to validate they have access to the S3 bucket and are receiving the logs.
Clean up
Follow automated or the manual cleanup steps provided in the README.md
Conclusion
The Amazon Q Developer integration with Jellyfish represents a significant step forward in your ability to measure and optimize the impact of AI in software development. By providing engineering leaders with powerful, actionable insights into AI adoption and impact, organizations are enabled to make informed decisions about their AI investments, optimize developer workflows, and drive greater efficiency across their engineering teams.
To learn more about this integration, visit the Amazon Q Developer documentation, contact your Jellyfish representative, or visit the Jellyfish website if you’re new to their resources.