AWS for Games Blog
Fine-tuning player latency with Amazon GameLift Servers
If you’ve launched an online multi-player game, you’re aware that few things are as frustrating (and perhaps inevitable) as forum complaints about latency. It can often be challenging to separate issues which you can influence (proximity of servers or code optimization) from problems outside of your control (under-sized hardware or network issues on the player end).
We will walk through how to measure and improve latency in your game title leveraging features available with Amazon GameLift Servers. Amazon GameLift Servers is used to deploy, operate, and scale dedicated, low-cost servers in the cloud for session-based multiplayer games. Through the analysis of simulated player traffic patterns and different regional deployment configurations, we’ll demonstrate practical solutions to optimize your players’ gaming experience.
A successful game launch
After the development of your game, it has finally been released and is experiencing rapid growth: your install base has exceeded expectations, and you are regularly peaking at over 300 K concurrent users (CCU). However, a segment of players has been reporting latency and responsiveness issues. You know that this could be any of several different causes, from internet conditions local to the player, to widespread internet issues, to unoptimized server code.
How do you determine whether the cause is something that you can control or not? What do you need to do to ensure that players get the best experience possible?
The first step is to make sure that you are measuring the players’ latency to your game server locations. Amazon GameLift Servers can help with UDP ping beacons. The beacon endpoints of Amazon GameLift Servers are available across Amazon Web Services (AWS) Global Regions and Local Zones. You can accurately measure player-to-server latency wherever your game servers are deployed. Since most latency-sensitive games use the UDP protocol, UDP ping beacons provide realistic latency measurements.
Implementation is straightforward when using our best practices and sample code. With accurate latency data from these beacons, you can create fairer matchmaking experiences and reduce instances of poor player connectivity. It would be frustrating for a player with a 150 ms ping to a Region to be put into a game with players who are pinging at 30 ms—accurate latency measurements are key to avoiding such scenarios.
Note, it can be useful to measure latency to locations where you aren’t currently operating. This can be helpful with identifying potential additional locations that might improve player latencies, increasing the happiness of your player base.
Region selection
Selecting optimal Regions for game sessions is crucial in server management, but it requires careful consideration of tradeoffs. Amazon GameLift Servers provides access to 32 Regions and local zones (a number that continues to grow), enabling lower-latency experiences for more players. However, operating in more locations than necessary can fragment matchmaking pools when targeting players to their fastest location, resulting in increased match times.
For example, going from a single Region to ten evenly distributed Regions could mean each Region now has 10% of the number of players to search for matches. This could make it difficult to satisfy desired properties such as a preferred game mode, evenness of skill, or even having enough players to fill out a game. Additionally, distributing game sessions across multiple, lightly used locations rather than consolidating them in nearby locations, may lead to excess idle server capacity.
So, how many Regions should you be using to run your game servers?
To demonstrate the impact of this, let’s simulate matchmaking for a 5v5 300 K CCU game. Player locations and latency measurements can be simulated to each potential server Region. Matches should be formed to attempt to place players in one of the lower-latency Regions.
Figure 1 shows the percentage of players at various latency measurements across assorted Region setups. Looking at a goal of 50 ms latency, we see that one Region results in 30% of players hitting this threshold, while a three-Region setup results in 63%. One thing to notice is that the improvements to the player experience show diminishing returns. While adding the ninth Region results in an extra 5% of players hitting 50 ms (or better) latency, improvements are minimal as we go beyond that, representing less improvement for your players.
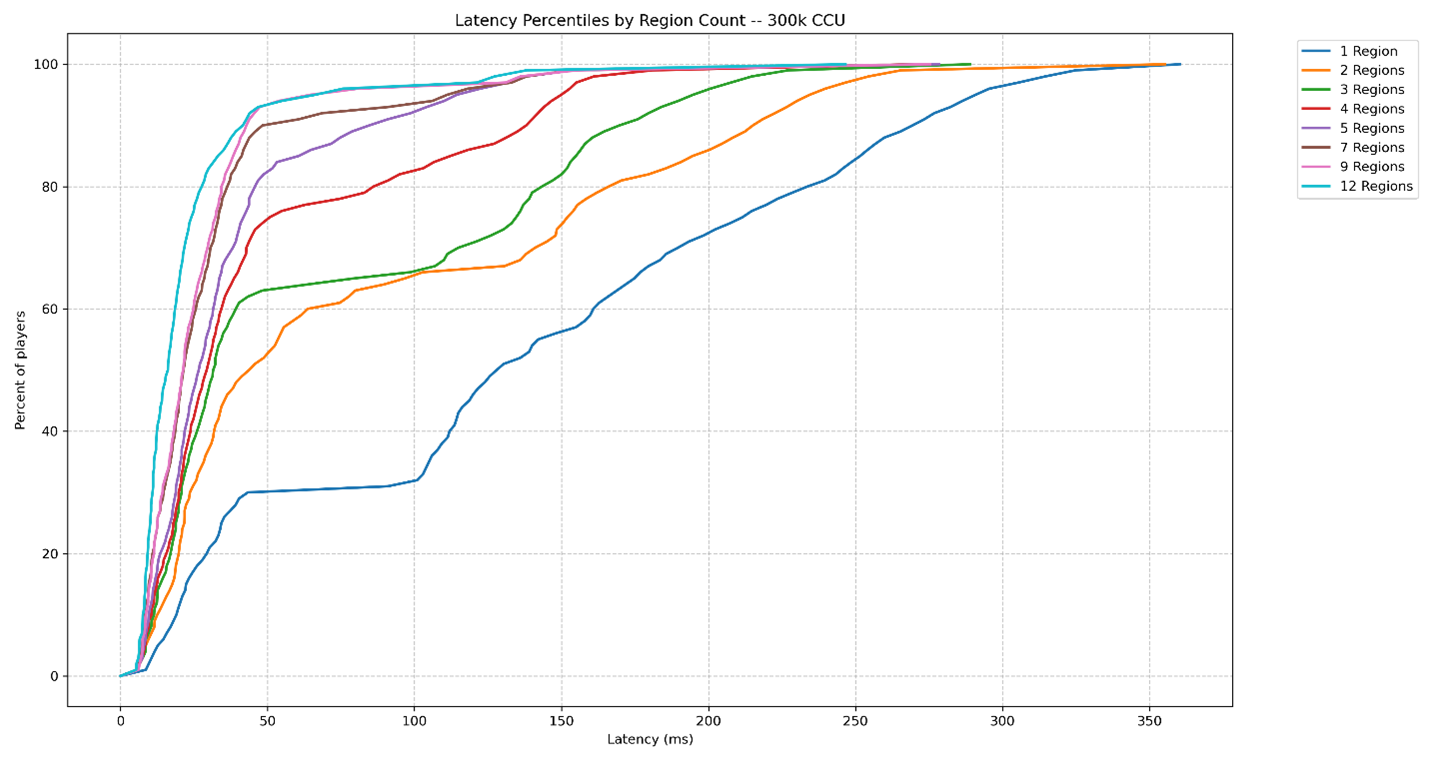
Figure 1: Latency percentiles for different Region counts (large game).
Another thing to note is that adding a seventh or eighth Region is only helpful if you have enough Region-local players to fill a game there. This presents a decision that you need to make for your game. Are you willing to accept longer wait times for your players to improve the responsiveness of the game? This is a judgement call that needs to be made based upon factors, including the latency-sensitivity and player population size of your game.
For comparison, Figure 2 simulates the same setups, only with a much smaller population of 3 K CCU. The data shows similar latency curves for small numbers of Regions, but adding more Regions fails to reach the same improvements to latency, as observed in the 300 K setup. This is because player join rates are not fast enough to fill up those games and you must resort to placing those players into less-desired Regions. An important observation is that you could achieve the same latencies in both tests, but it would require waiting up to 100 times as long in the 3 K CCU case to fill up those smaller Regions.
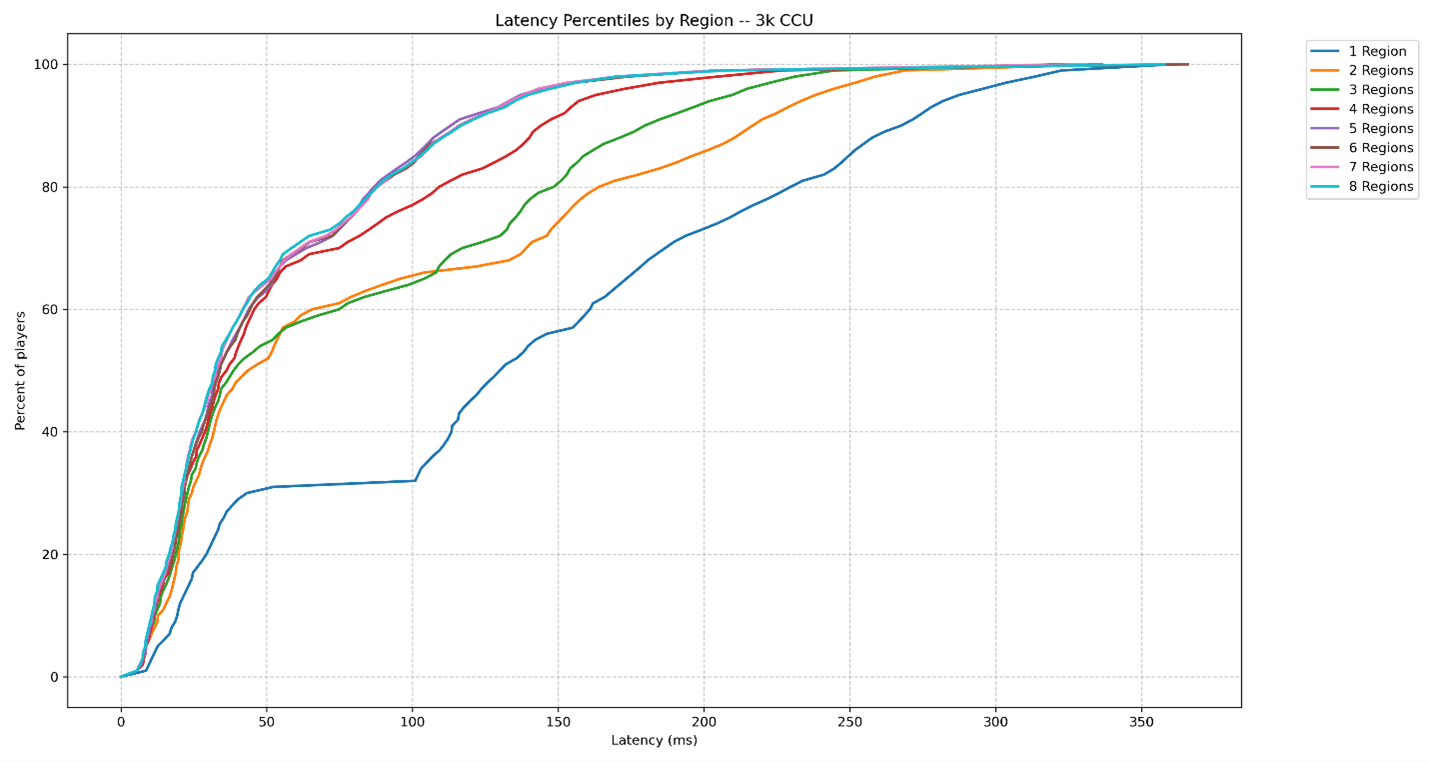
Figure 2: Latency percentiles for different Region counts (small game).
Finally, there is the question of which Regions you should choose?
For the examples discussed, the ordering chosen for Regions was based on analysis of the simulated latency data for players. In the real world, you would typically want to start with servers in at least a few primary geographic zones, and then expand based on analysis of your player latency data (as measured by UDP Ping Beacons).
Based on a decade of experience hosting hundreds of games for our customers, here is some general guidance as a starting point:
- Three or four Regions is a good base that works for most games
- One from each of these areas aligns with what has worked for our customers:
- North America (example: us-east-2 or us-west-2)
- Europe (example: eu-central-1 or eu-west-2)
- Asia Pacific (example: ap-northeast-1 or ap-northeast-2)
- Add more Regions:
- If data shows latency improvements that would benefit player experience
- If your game population is large enough to avoid problems with fragmentation
As shown, a large player base is going to make you seriously consider more Regions. You would assess this by examining how common it is for your existing Regions to not fall in the fastest N Regions for a player. This is where N is determined by your game’s latency requirements—lower for latency-critical games, higher for more tolerant games. For example, if you are in three Regions and you find that 60% of players don’t have one of those Regions as their fastest two or three Regions, you perhaps could do better. You would then prioritize expansion into the Regions which were most common amongst that 60%.
Note, even for the same game population size there is not a single best answer for everyone. A game with fewer players (player-versus-player) will find it quicker to fill games in a less common Region, whereas a strong regional popularity in South America could mean a presence there is critical.
Identification of widespread issues
With the usage of UDP ping beacons you can receive accurate latency measurements for all players, and be able to use this data to allocate game servers reasonably and optimally around the globe. This is a great start—wherever possible you are placing players into game servers close to them, giving them the best chance for a positive experience. For cases where it’s not possible, you can now have the measurements to identify when a player is likely to experience a latency issue during gameplay.
However, what about cases where you aren’t sure if gameplay shortcomings are due to server-side or player-side issues? Or even less in your control, what if there are widespread internet problems impacting your game? This can be quite frustrating if everything looks responsive from a server point of view, but player complaints persist.
The starting point for an investigation of a player-specific latency complaint is to see what their latency measurement was to the Region of the game session. If you are using Amazon GameLift Servers queues, you can start with the placement ID and player ID—quickly looking up latencies using the describe-game-session-placement API.
Following is a python script which can extract player latencies—used to place a specific placement request:
Running this script will provide you output similar to this:
From the output you can see the latencies (in milliseconds to each Region) for each player in that game session. The first thing to look at is the Region hosting the game session. Based on the example output it appears that ap-northeast-1 has the lowest average latency. There is a sizeable discrepancy between latency of the two players—something that could be worth addressing in your matchmaking by favoring latency parity. You can also see that player-441 is going to have a relatively high latency experience, regardless of which Region hosts the game session. If this is the player complaining, there might be a limit to how much you can improve their experience.
Another thing to look at is if the best choice Region is one where you currently aren’t running servers. If that’s a common pattern you’re seeing you have likely identified a great candidate for Region expansion. Finally, for issues beyond the scope of a single player or game session, you can feed player latency data into an analytics solution for deeper analysis (we recommend the Guidance for Game Analytics Pipeline on AWS).
Another solution that Amazon GameLift Servers has at your disposal is Amazon CloudWatch Internet Monitor. Internet Monitor can measure widespread internet performance and its impact on your game. As a result, Internet Monitor can identify issues in the broader internet, as well as suggest additional or alternate Regions for capacity that may give a significant latency improvement for your players. While Internet Monitor is disabled by default, Amazon GameLift Servers is able to work with customers to enable it, and can suggest improvements to the game’s geographic coverage.
The example in Figure 3 shows a few latency suggestions that have the potential to improve customer latencies. This measures latency as Time to First Byte (TTFB) and is sorted by total traffic so you can focus on changes impacting the highest number of players. Although slightly more traffic could be optimized in other locations, players from the Crestview, Florida area have potential to realize a great improvement (from 139 ms down to 36 ms) by directing those players to us-east-1 instead of eu-central-1.
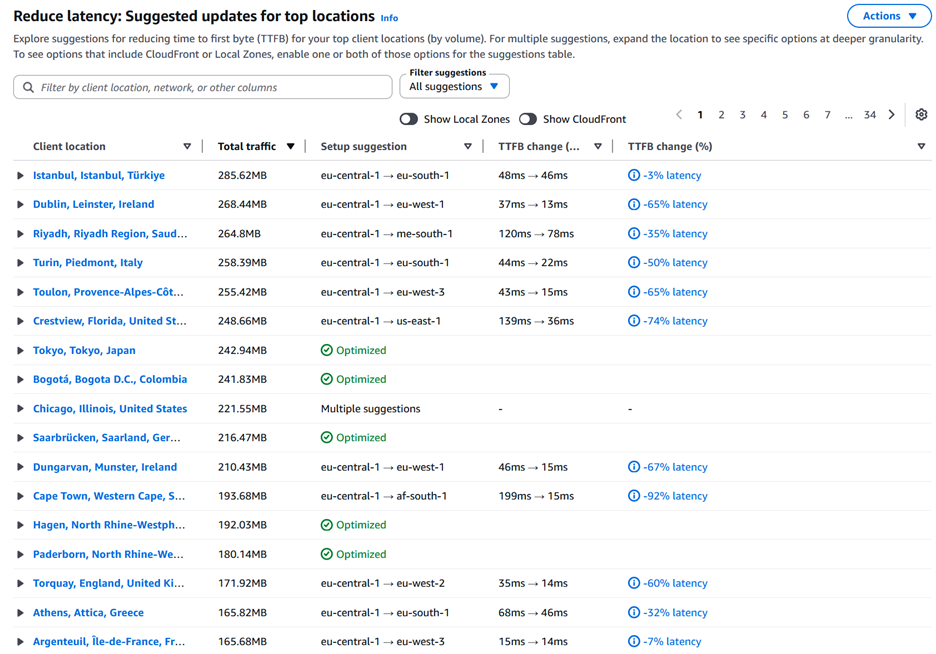
Figure 3: Internet Monitor latency reduction suggestions.
Internet Monitor can also be used to identifying issues impacting widespread internet health. This can be valuable in troubleshooting poor player experience and validating if an issue is outside of your control. Figure 4 is an example of an active issue impacting customers in Italy. If you had several players complaining about gameplay around this time, you would have the information you needed to confirm impact and communicate this to your players. This open communication can demonstrate to players that you effectively manage operations and can be helpful in building long-term loyalty.
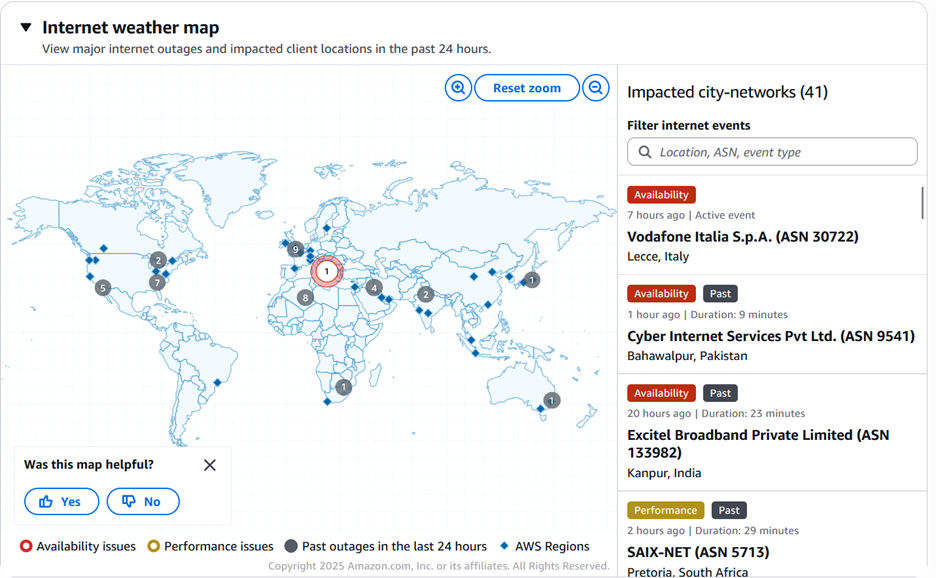
Figure 4: Internet Monitor map of major internet outages.
Summary
We explored how to effectively troubleshoot and address latency issues in your game using Amazon GameLift Servers. We showed that UDP ping beacons are essential for measuring player-to-server latency across all AWS Global Regions and Local Zones, helping you to make data-driven decisions about server placement and matchmaking.
We demonstrated how the number of Regions you operate in can affect the player experience, with diminishing returns as you add more Regions, and how this decision needs to be balanced against your CCU and matchmaking requirements. Through our simulations, we visualized the impact of different regional configurations on both large (300 K CCU) and smaller (3 K CCU) player populations.
We also highlighted how Amazon CloudWatch Internet Monitor can be leveraged to identify widespread internet issues and suggest optimal Region configurations for your players. This can help you maintain transparency with your community and deliver the best possible gaming experience.
Take the next step in optimizing your game’s regional footprint and player experience by leveraging UDP ping beacons.
Contact an AWS Representative to learn how we can help optimize your game’s performance and to inquire about onboarding to Internet Monitor with Amazon GameLift Servers.