AWS Cloud Operations Blog
Multi-Cloud Observability with Amazon CloudWatch Using Bearer Token Auth and OpenTelemetry
Organizations running serverless workloads across multiple cloud providers face a specific observability challenge. There is no persistent compute to host a telemetry collector, no sidecar to attach, and no daemon running between invocations. The standard OpenTelemetry deployment model (application to local collector to a telemetry backend) does not apply in this environment.
Authentication presents an additional barrier. A function running outside AWS would traditionally need AWS IAM credentials and SigV4 request signing to send telemetry to Amazon CloudWatch. That means provisioning access keys, implementing rotation across cloud boundaries, and including the AWS SDK in every non-AWS deployment.
Bearer token authentication for CloudWatch OTLP endpoints removes this barrier. With bearer tokens, any HTTPS client can authenticate to CloudWatch by including a single Authorization: Bearer header. No AWS SDK required. As of publishing this blog, CloudWatch supports Bearer token auth for Metrics and Logs, but not for Traces.
This post shows you how to instrument serverless functions across multiple clouds to export metrics and logs directly to CloudWatch using bearer token authentication. It also walks through a troubleshooting scenario that demonstrates deep correlation across cloud environments between metrics and logs using shared OpenTelemetry semantic attributes.
Overview of solution
The reference application (hosted on Github) is a product catalog spanning three cloud providers:
| Service | Cloud | Role |
| Product API | AWS Lambda | Receives requests, orchestrates downstream calls |
| Inventory Service | Azure Functions | Manages stock availability |
| Pricing Service | GCP Cloud Run Functions | Calculates dynamic pricing |
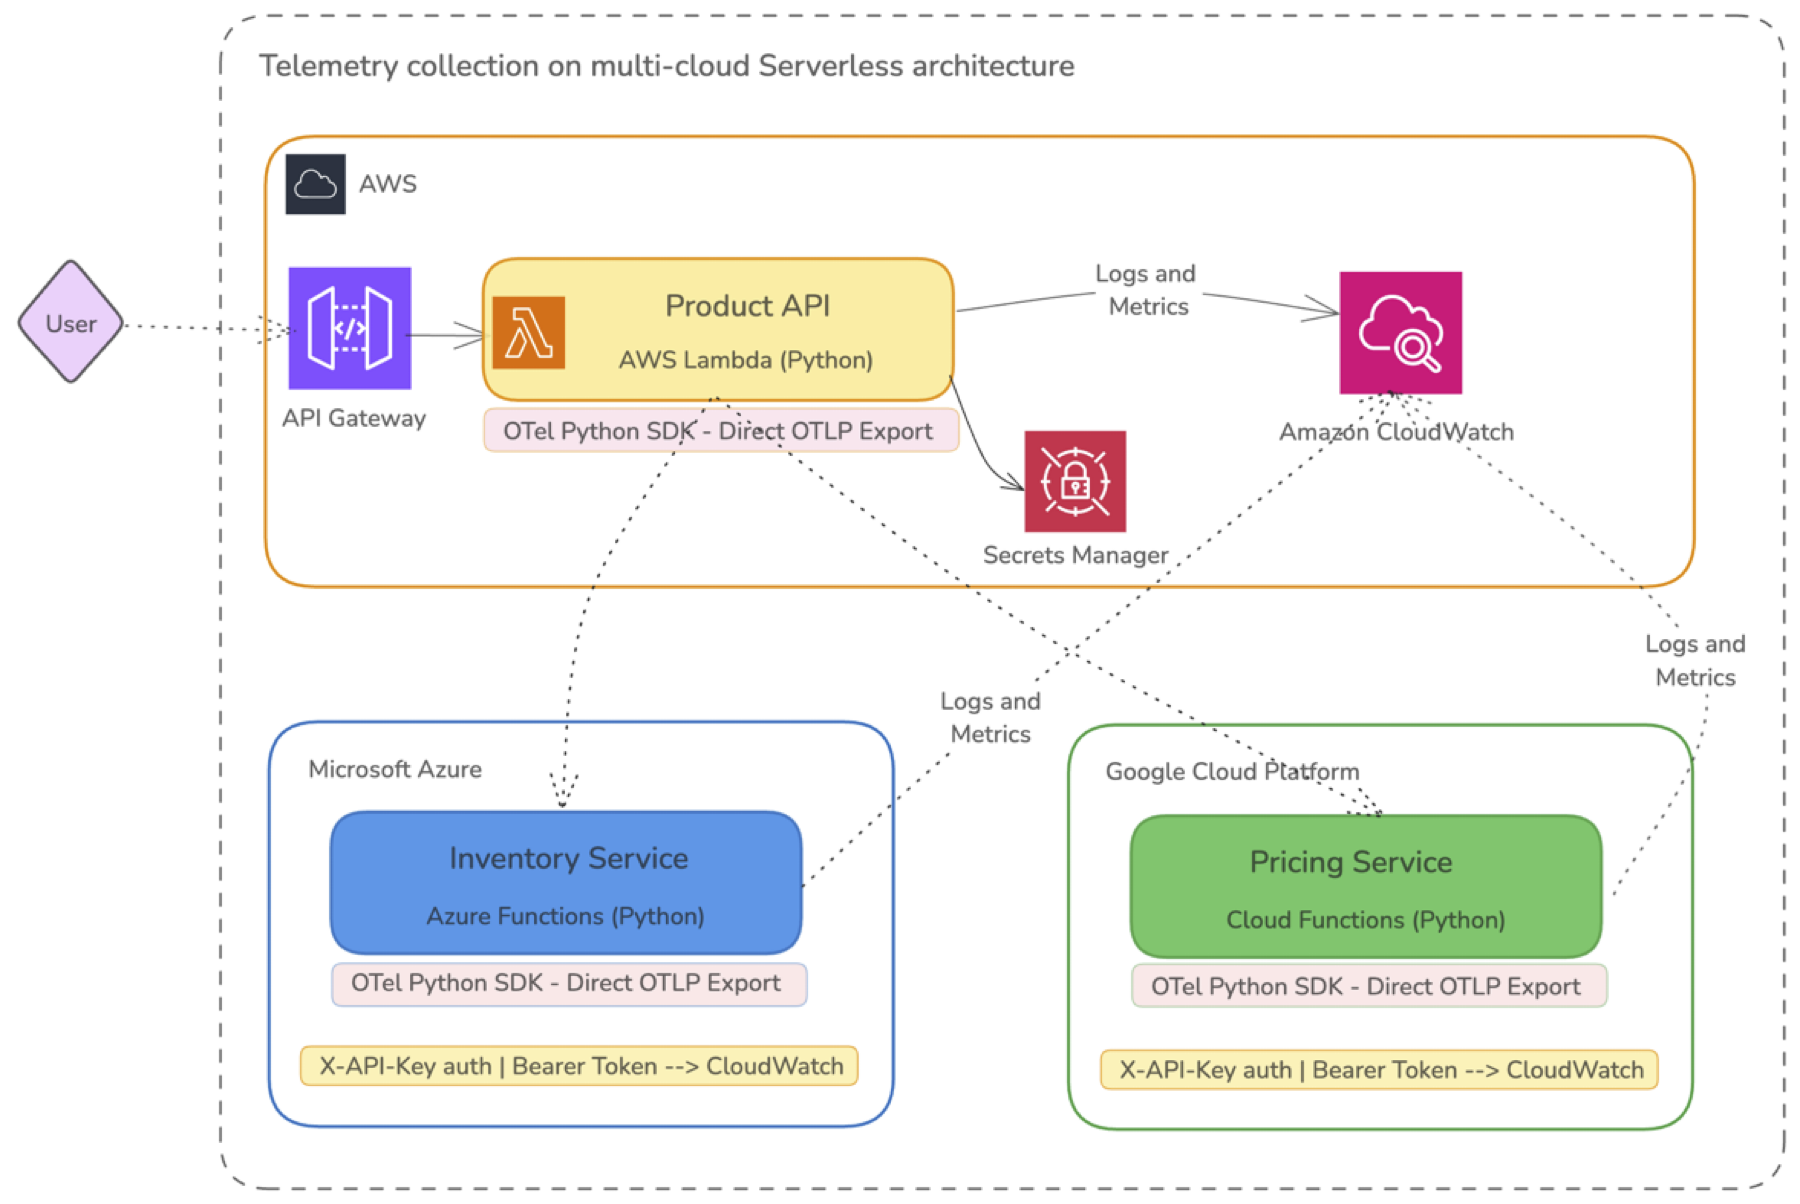
Fig 1: Serverless multi-cloud observability architecture. Each function authenticates to CloudWatch OTLP endpoints using bearer tokens over HTTPS. No collector or AWS credentials are needed on non-AWS functions.
A customer calls GET /products/42. The Product API on Lambda calls the two downstream services, assembles the response, and returns it. Each function exports metrics and logs directly to CloudWatch using bearer token authentication with the same OTLP endpoint, the same resource attribute schema, and a single pane of glass.
Why bearer token authentication matters
Without bearer token authentication, a non-AWS function that needs to send metrics to CloudWatch requires the following with SigV4 authentication:
- Provision an IAM user or role with
cloudwatch:PutMetricDatapermissions
- Generate access keys and store them in the external cloud’s secret store
- Include the AWS SDK (or a SigV4 signing library) in your function’s deployment package
- Implement credential rotation across cloud boundaries
- Handle the SigV4 signing ceremony (canonical request, string-to-sign, signature) on every export
That is five layers of complexity per function, per cloud, just for authentication. In serverless environments where cold start time and package size directly affect cost and latency, adding the AWS SDK solely for request signing is a significant overhead.
With bearer token authentication, a non-AWS function authenticates with a single HTTP header:
Authorization: Bearer eyJraWQiOiJ...
The OpenTelemetry OTLP/HTTP exporter natively supports custom headers. No additional SDK, no signing logic, no IAM role chain. The token is a self-contained credential that CloudWatch validates server-side.
| Aspect | SigV4 (traditional) | Bearer Token |
| Non-AWS functions | Requires AWS SDK + access keys | Works with any HTTPS client |
| Package size impact | +30-50 MB (AWS SDK) | Zero additional dependencies |
| Cold start overhead | SDK initialization + signing | None (header injection) |
| Credential type | IAM access key pair | Single opaque token |
| Rotation | Key rotation across clouds | Token refresh at cold start |
How direct OTLP export works
Each function configures the OpenTelemetry SDK to export to two CloudWatch OTLP endpoints, authenticating with bearer tokens:
| Signal | Endpoint | Required Headers |
| Metrics | https://monitoring.<region>.amazonaws.com/v1/metrics |
Authorization: Bearer <metrics-token> |
| Logs | https://logs.<region>.amazonaws.com/v1/logs |
Authorization: Bearer <logs-token>, x-aws-log-group, x-aws-log-stream |
| Traces | https://xray.region.amazonaws.com/v1/traces |
[Bearer token auth not supported, hence excluded from this blog post] |
Note: CloudWatch OTLP endpoints support bearer token auth for metrics and logs.
The key to troubleshooting across cloud environments is a shared resource attribute schema. Every function emits the same semantic fields, which appear on every metric data point and every log record. These attributes serve as correlation keys that let you slice across signal types using semantic dimensions rather than timestamps alone.
Walkthrough
This walkthrough has the following steps:
- Set up the prerequisites
- Generate bearer tokens for the CloudWatch OTLP endpoints
- Configure the OpenTelemetry SDK in each function
- Deploy the CloudWatch dashboard
- Reproduce an incident and investigate it across clouds
Prerequisites
For this walkthrough, you should have the following prerequisites:
- An AWS account with permissions to create CloudWatch resources, generate OTLP bearer tokens, and store secrets in AWS Secrets Manager
- Accounts on the non-AWS clouds where the downstream functions run, with permissions to deploy HTTP-triggered functions and set environment variables
- Python 3.11 or later
- The AWS SAM CLI, plus the CLI tools for the non-AWS functions you deploy
- Familiarity with the OpenTelemetry Python SDK and basic PromQL
Generate the bearer tokens
Generate bearer tokens through CloudWatch, one for the metrics endpoint and one for the logs endpoint. Each token is scoped to a specific signal type and can be stored in any secrets manager:
- AWS Lambda: Store in AWS Secrets Manager and retrieve at cold start with the Lambda execution role’s permissions.
- Non-AWS functions: Store in the respective cloud’s native secret store (Key Vault, Secret Manager, and so on) and retrieve at cold start with the function’s managed identity or service account.
The token is the single credential that unifies telemetry ingestion regardless of where the function runs. For detailed steps, see steps for Logs and Metrics.
Configure the OpenTelemetry SDK
All three functions share an otel_setup.py module. First, define the resource attributes that serve as correlation keys across cloud environments:
Note: The complete code base is hosted on Github
The app.name attribute groups all services belonging to the same application, enabling application-level queries regardless of where individual services run.
Next, configure the exporters. This is the critical piece: bearer token authentication reduces the entire multi-cloud auth story to a single headers dict, identical regardless of which cloud the function runs on. The metrics exporter needs only the Authorization header; the logs exporter adds two routing headers.
That header dict is the whole trick — the same OTLP/HTTP exporter works from AWS, Azure, or GCP with no cloud-specific auth logic. The full otel_setup.py (resource attributes, provider wiring, token resolution from Secrets Manager or env vars, and a flush_telemetry helper) is in the repo.
Each function calls configure_otel at module level (once per cold start) and force-flushes telemetry before returning, since serverless runtimes freeze immediately after the handler returns. Note the simplified metric names (requests.total, errors.total). Attaching service_name to every data point (via SVC_LABELS) is what lets you disambiguate these shared metric names by service in CloudWatch:
Deploy the CloudWatch dashboard
The companion repository includes a pre-built dashboard definition (dashboard.json) that visualizes metrics and logs from all three services. Set a REGION variable to the CloudWatch region you are exporting to (used throughout the rest of this walkthrough), then deploy:
The dashboard includes the following widget rows:
- Overview: Request rate, average latency, and error rate, with one query per service (
service_name) so each service gets a distinct color and legend entry
- Downstream Dependencies: Product API downstream error counter and latency, grouped by `
target_service` and `error_type`
- Error Breakdown: Per-service error rates broken down by `
error_type`
- Database Health: Inventory service DB query latency and low stock alerts
- Logs across Cloud environments: A CloudWatch Logs Insights widget showing recent errors across all services from the shared log group
The metric widgets use PromQL queries (through the chart widget type with language: "PromQL"). For example:
- OTLP metric
data-pointattributes (such astarget_service, error_type,andservice_name) become PromQL labels. This means you can group, filter, and aggregate by any attribute you attach to a metric in your instrumentation code. Resource attributes (like theservice.nameyou set on theResourceobject) do not become metric labels — that is why the instrumentation code also attachesservice_nameto each data point viaSVC_LABELS.
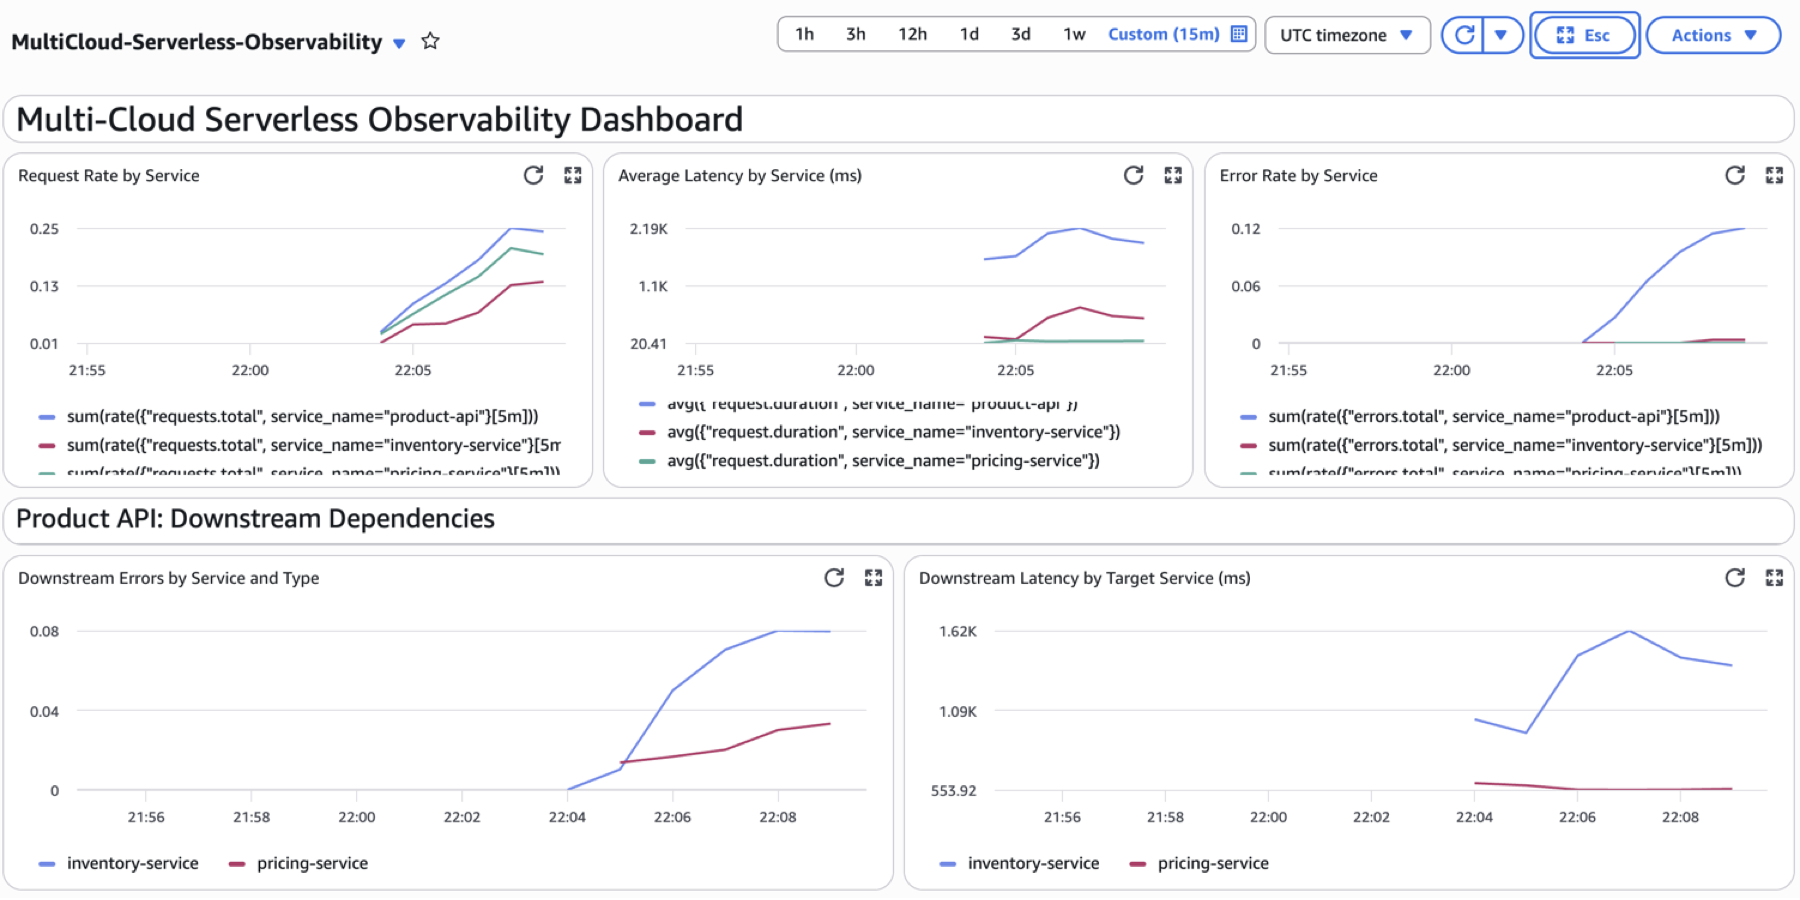
Fig 2: Screenshot of the Dashboard deployed on CloudWatch
Reproduce and investigate an incident
This step demonstrates how unified multi-cloud observability works in practice. You can reproduce the scenario using the traffic generator’s --spike flag, which sends normal traffic, triggers a simulated inventory service degradation (85% error rate with high latency), then resumes normal traffic:
Consider the following alert: Product API end-to-end latency roughly doubles (from a ~1.5s baseline to ~3s) for the duration of the spike, then self-resolves. No deployment happened, and customer tickets are coming in.
To identify the suspect with metric dimensions
- On the CloudWatch console, go to Query Studio and query the Product API downstream error counter with PromQL:
- Review the result, which shows a spike exclusively on
target_service = inventory-service, cloud = azure, and error_type = request_error(the inventory service returns HTTP 503, which the Product API records as a downstream request error). - Check the downstream latency histogram. The metric
product_api.downstream.durationfiltered bytarget_service=inventory-serviceconfirms that latency to the inventory service climbed to roughly 2s during the window (the injected degradation), while the pricing service stayed flat. The metric dimensions tell you which service and which cloud without guessing.
To correlate metrics to logs using shared attributes
- The same resource attributes on your metrics (
service.name, cloud.provider, app.name) also appear on every log record because they come from the same OTelResourceobject. In the ingested log event they are nested underresource.attributes, so you reference them in CloudWatch Logs Insights with the full dotted path in backticks (and the log text lives in the body field, not@message): - Query the shared log group and filter by the exact dimensional slice the metric identified:
- Review the results, which return logs only from the exact dimensional slice the metric identified:
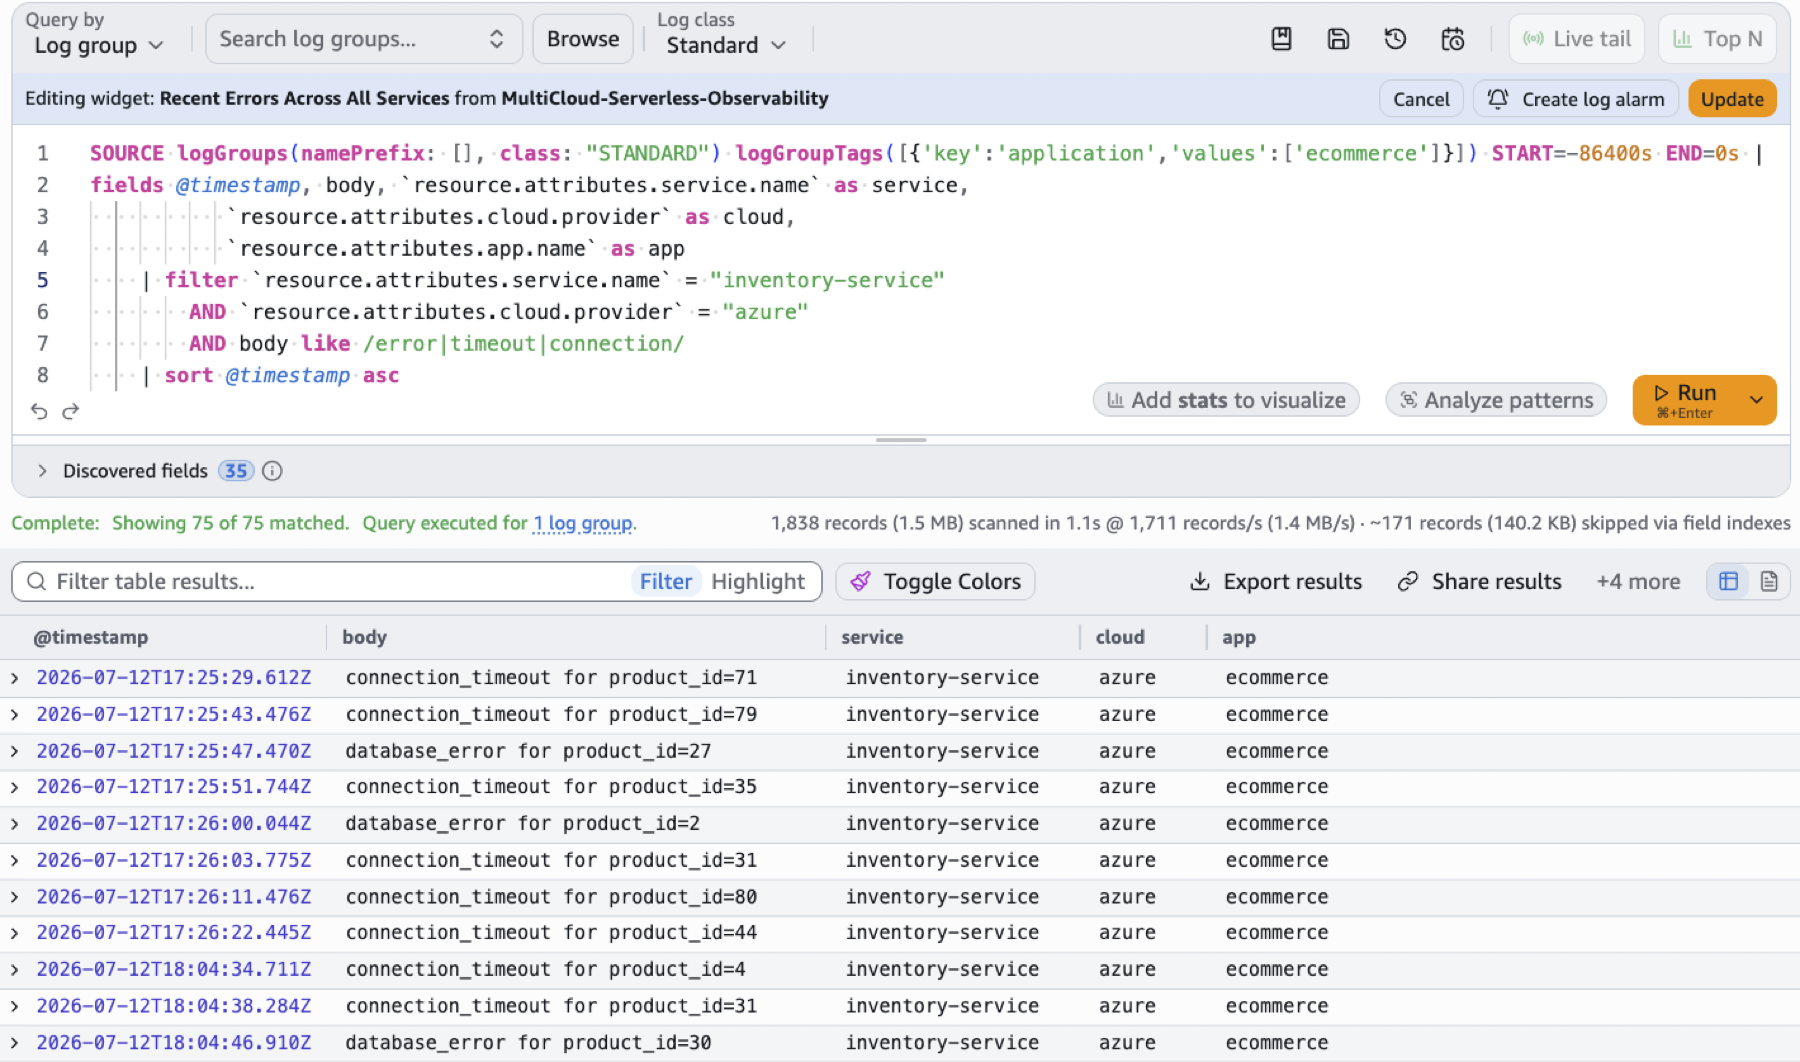
Fig 3: Screenshot showing error log events in CloudWatch
The inventory service experienced transient database connectivity issues on its host cloud. The inventory_service.db_query.duration histogram confirms this finding. Query latency spiked from a baseline of 2-15ms to over 800ms during the same window. Note that these logs arrived from a non-AWS function authenticating to CloudWatch with a bearer token. Without that capability, you would need to switch to a separate cloud console and search a different logging system with different query syntax.
To verify causality with metrics
Confirm causality by querying the inventory service’s own error counter. The generic metric name errors.total is scoped by the service_name label (derived from the service.name resource attribute):
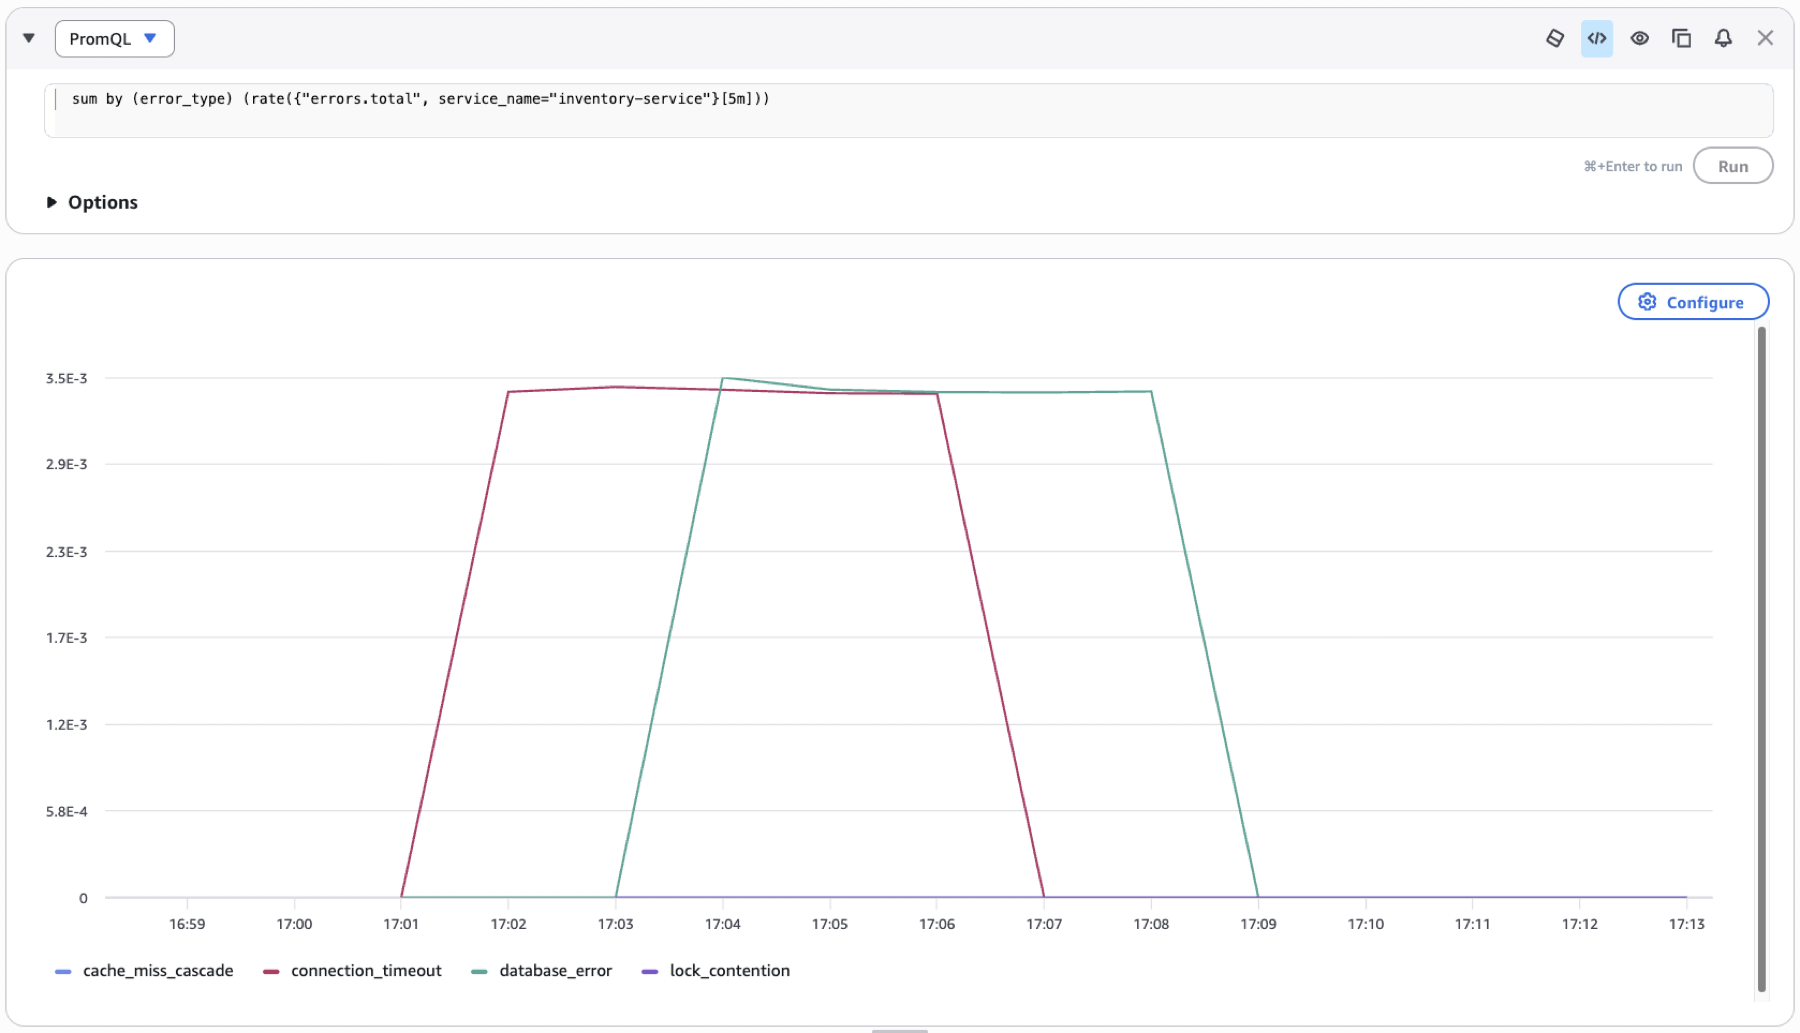
Fig 4: CloudWatch widget showing database error and connection timeout spiking at the same time
The error_type=database_error and error_type=connection_timeout dimensions both spike in the exact same window. The product_id_range dimension on requests.total reveals which product ranges were affected, scoping business impact without parsing individual log lines. The low_stock_alerts counter confirms no cascading stock errors. This was purely a connectivity issue.
The investigation chain follows this pattern: metric dimension, then resource attribute, then log filter, then root cause, then metric verification. This approach goes beyond looking at the same timestamp in two places. It uses OTel semantic attributes as shared correlation keys across signal types, because the cloud.provider, service.name, and error_type values are identical in both metrics and logs.
Cleaning up
To avoid incurring future charges, delete the resources:
Best practices
- Always force-flush before returning. Serverless runtimes freeze immediately after your handler returns. Buffered telemetry that has not been flushed will be lost.
- Configure Batch Limits. Keep the batch size reasonable (e.g., 512 elements) and the export timeout short (e.g., 5000ms) so that telemetry is offloaded frequently before serverless resources get de-allocated.
- Set flush timeouts with headroom. Use
context.get_remaining_time_in_millis()(Lambda) to calculate a safe flush timeout. Leave at least 2 seconds of safety margin before the function timeout.
- Store bearer tokens in each cloud’s native secrets manager. Use AWS Secrets Manager for Lambda and the equivalent secret store for non-AWS functions. Retrieve at cold start. The cached value persists across warm invocations, keeping the multi-cloud auth pattern clean with no AWS credentials outside AWS.
- Rotate tokens proactively. Bearer tokens have a finite lifetime. Configure secrets manager rotation before expiry. Functions pick up new tokens on the next cold start automatically.
- Handle export failures gracefully. Wrap flush calls in try/except. Telemetry loss is acceptable. Breaking your business logic because CloudWatch is unreachable is not.
- Scrub PII from log messages. The reference application intentionally logs customer emails, IP addresses, phone numbers, and payment card numbers to demonstrate a common anti-pattern. In production, never emit PII in plain text to telemetry backends. Use tokenization, hashing, or structured field redaction before export. Amazon CloudWatch Logs data protection policies can detect and mask sensitive data, but defense-in-depth starts at the application layer.
Considerations
- Cold start impact: The OTel SDK adds approximately 100-200ms to cold starts. Use provisioned concurrency for latency-critical paths.
- No traces support: CloudWatch OTLP endpoints support metrics and logs only. Distributed tracing requires a separate solution.
- Payload limits: Keep export batches under 1 MB per request (CloudWatch OTLP endpoint limit).
- Cross-region latency: Non-AWS functions export to a single CloudWatch region. Choose one that minimizes average latency across your function locations.
- Token scope: Each bearer token is scoped to either metrics or logs. You need two tokens, one per signal type.
Conclusion
In this post, you saw how bearer token authentication simplifies monitoring a multi-cloud environment with Amazon CloudWatch. By replacing SigV4 signing with a simple Authorization: Bearer header, any serverless function can export metrics and logs directly to CloudWatch using standard OTLP/HTTP, regardless of where it runs. No AWS SDK on non-AWS functions, no multi-cloud IAM complexity, no collector infrastructure.
Combined with a consistent OTel resource attribute schema, this creates a system where a single PromQL query identifies which cloud and service is misbehaving, a single Logs Insights query retrieves the evidence using the same semantic dimensions, and a single console is all you need to investigate incidents that span multiple clouds.
For the complete implementation, see the companion GitHub repository. For bearer token generation and CloudWatch OTLP endpoint details, see the Amazon CloudWatch OTLP documentation.