AWS Cloud Operations Blog
Amazon CloudWatch Application Signals new enhancements for application monitoring
Today, we’re excited to announce new enhanced features in Amazon CloudWatch Application Signals that simplifies how you monitor large-scale distributed applications. Improvements to CloudWatch Application Signals application map automatically discovers and organizes services into groups based on their relationships, with support for custom grouping that aligns with your business perspective. You can now view the most recent deployment time for services and review automated audit findings for issues like service level indicators (SLI) breaches.
Key capabilities and features
CloudWatch Application Signals application map displays operational signals such as service level objectives (SLOs) and health indicators. A contextual troubleshooting drawer provides instant access to standard metrics, last deployment status, and actionable insights. For deeper analysis, you can seamlessly transition to application-specific dashboard tailored for comprehensive troubleshooting. This integrated experience helps teams identify root causes faster and reduces mean time to resolution.
Ready Out of the Box
Getting started with these new features requires no additional configuration if you already have Application Signals enabled in your AWS account. To enable Application Signals, you must grant Application Signals the permissions it needs to discover your services by referring to Enable Application Signals in your account. To try out CloudWatch Application Signals on a sample app before you instrument your own applications with it, follow the instructions in this AWS documentation.
Root Cause Analysis
DevOps engineers can use the application map to quickly identify root causes during incidents. When a service shows high error rates, a single click on the affected node displays metrics, recent deployments, and dependency health in the troubleshooting drawer. Engineers can then view the metrics, the most recent deployment, and audit findings for issues like SLI breaches.
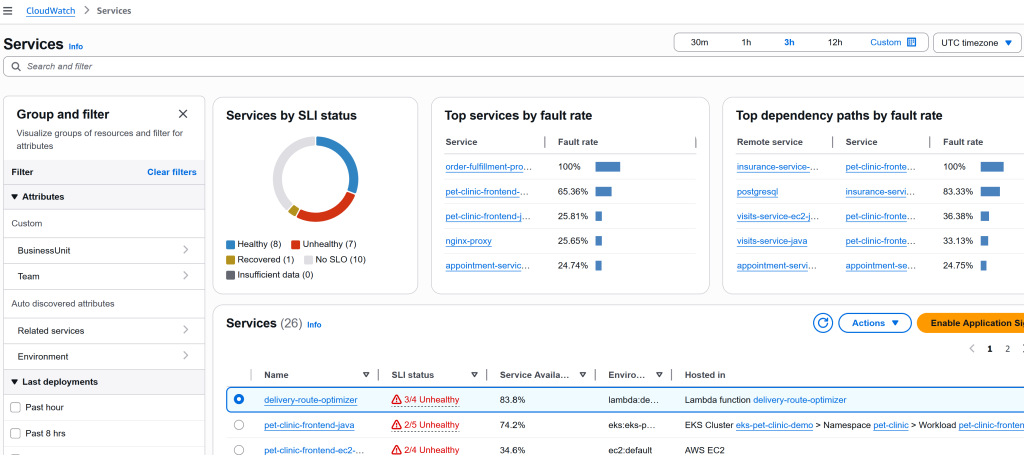
Services
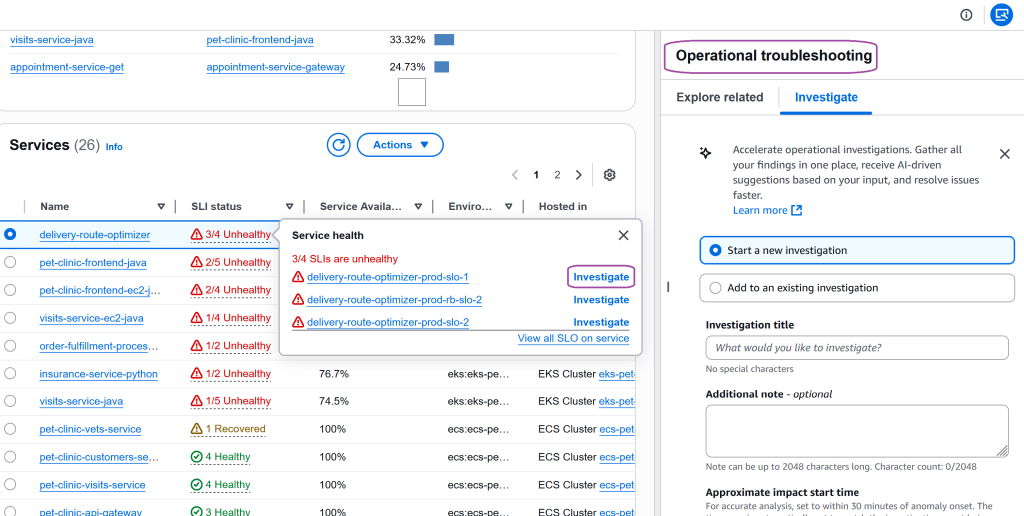
To further streamline this troubleshooting process, CloudWatch Investigations, a generative AI-powered assistant scans your system’s telemetry and quickly surfaces relevant data and suggestions related to your issues. Application Signals is integrated with CloudWatch investigations and you can start an investigation from the Services dashboard.

Investigate
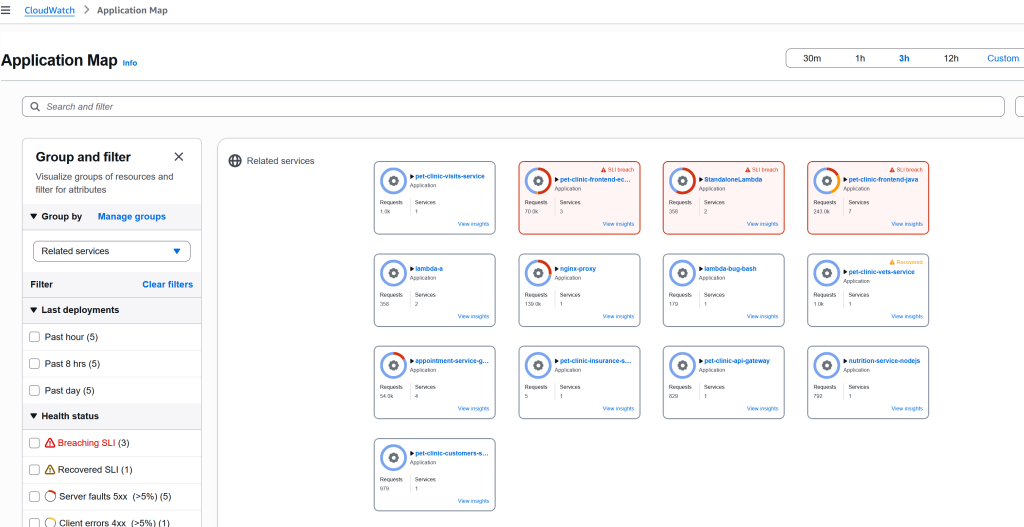
CloudWatch Application Signals application map simplifies service exploration and troubleshooting through standard grouping. By default, services are automatically grouped based on their downstream dependencies. You can use Manage groups to define your own custom grouping to organize your services based on your business requirements and operational priorities. Filters help focus on deployment changes, SLI breaches, or compute platforms like Amazon Elastic Kubernetes Service (Amazon EKS), Amazon Elastic Container Service (Amazon ECS), and AWS Lambda. The ‘View Insights’ feature shows service health, change history, and metrics. The dashboard includes views for resource analysis and attribute filtering, providing multiple starting points for root cause analysis.

Application Map
Conclusion
This release allows you to monitor and troubleshoot large-scale distributed applications on AWS. By automatically grouping the services and application dependencies while providing contextual operational insights, it eliminates the burden of maintaining custom dashboards and reduces operational maintenance time. As applications continue to grow in complexity, AWS’ approach to application-centric observability provides teams with the visibility and tools they need to maintain reliable, performant services at scale.
Now, it’s your turn to start exploring:
- Virtual tour: Want to experience firsthand how Application Signal visualizes your applications, improves troubleshooting, and transforms monitoring? Take this interactive virtual tour without setting up your own environment.
- Schedule a demo: Reach out to your AWS account team to discover how you can transform your application monitoring experience.
- Get started with AWS Observability: Enhance your observability foundation by implementing comprehensive monitoring to ensure you’re capturing the data needed for effective analysis.
- Observability Workshop: Explore hands-on experiences for the wide variety of toolsets AWS offers to enable observability of your applications.