AWS Cloud Operations Blog
Analyze Application Load Balancer Logs with Amazon CloudWatch Logs
Summary
Amazon CloudWatch Logs now supports Application Load Balancer (ALB) logs as vended logs, giving you out-of-the-box visibility into the health and performance of your ALB. All three ALB log types (access, connection, and health check) are delivered as structured JSON with named fields. This allows teams to attribute 5xx errors to the load balancer or the application, identify routes contributing to high latency, and diagnose failing health checks. No Amazon S3 bucket management, Amazon Athena table setup, or custom ETL pipelines are required.
The dashboard below shows request volume and status code distribution, error trends with load balancer vs. target attribution, per-route latency percentiles, target health outcomes, and top client/target rankings. It is deployed using the AWS CloudFormation template provided in this post.
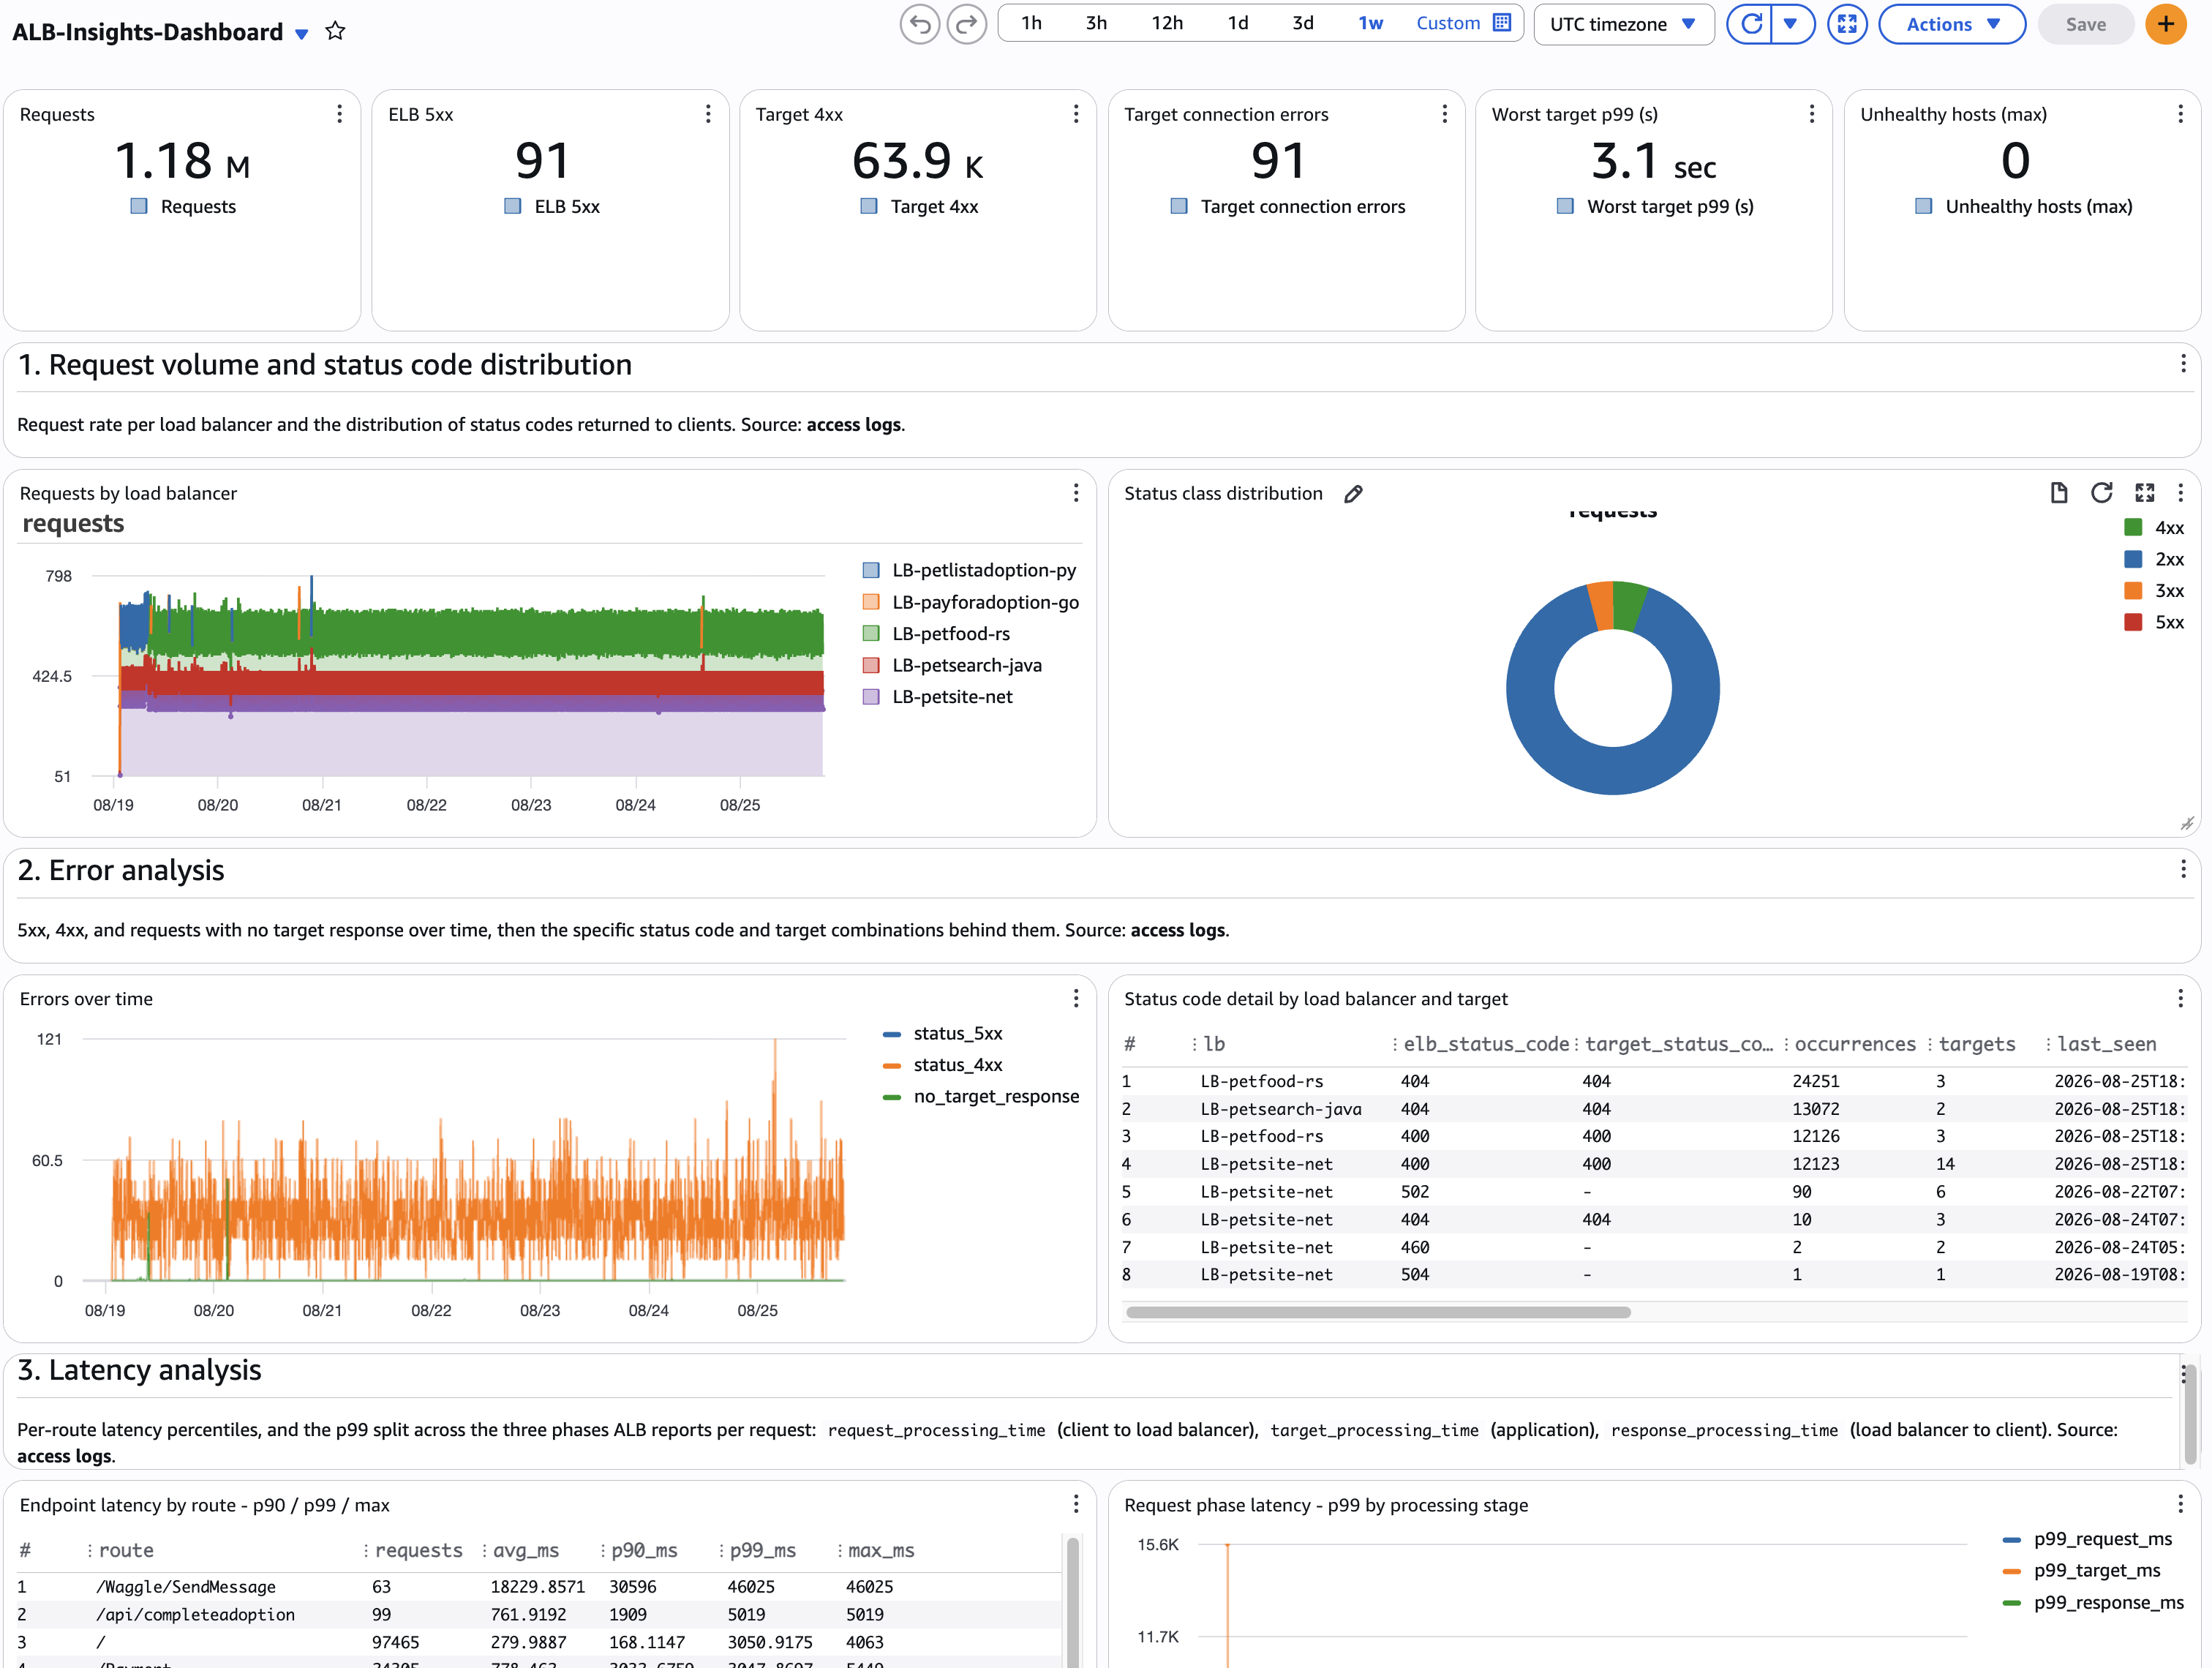
Figure 1: ALB Insights dashboard showing request volume, error analysis, and latency breakdown across load balancers
Introduction
An Application Load Balancer sits on the request path of most customer-facing workloads on AWS. It sees every request before your application does, including requests that never reach a target. When a service degrades, ALB logs answer the first question an on-call engineer asks: is this the load balancer, the network, or my application?
ALB emits three log types:
Before this launch, these logs went to Amazon S3 as compressed, space-delimited files. You managed lifecycle policies, maintained Athena tables as ALB appended fields, and built separate infrastructure for alerting. Now, ALB records land in the same place as your VPC Flow Logs, AWS WAF logs, and application logs, inheriting everything CloudWatch Logs already provides: Log Analytics, metric filters, Contributor Insights, Live Tail, anomaly detection, and cross-account cross-region centralization.
Getting started: Enable and deploy
In this section, we walk through enabling ALB log delivery with a telemetry enablement rule and deploying the sample dashboard with the provided CloudFormation template.
Step 1: Enabling ALB Log Ingestion via Telemetry Enablement Rules
Amazon CloudWatch telemetry enablement rules allow you to automatically configure telemetry collection for your AWS resources. Rules help you standardize telemetry collection across your organization and provide consistent monitoring coverage. A single rule configures delivery on existing and newly created load balancers in its scope, so enabling logging once covers the load balancers a deployment pipeline creates later.
Follow these steps to enable ALB log ingestion into CloudWatch:
- Open the CloudWatch console in your management or delegated administrator account.
- In the navigation pane, choose Ingestion, then the Enablement rules
- Choose Add rule.
- For Data source, choose Amazon Elastic Load Balancer – Application and click Configure Telemetry.
- For Rule name, enter a descriptive name (for example, ALB-Logs-Enablement).
- For Rule scope, choose Organization, Organizational unit, or Account.
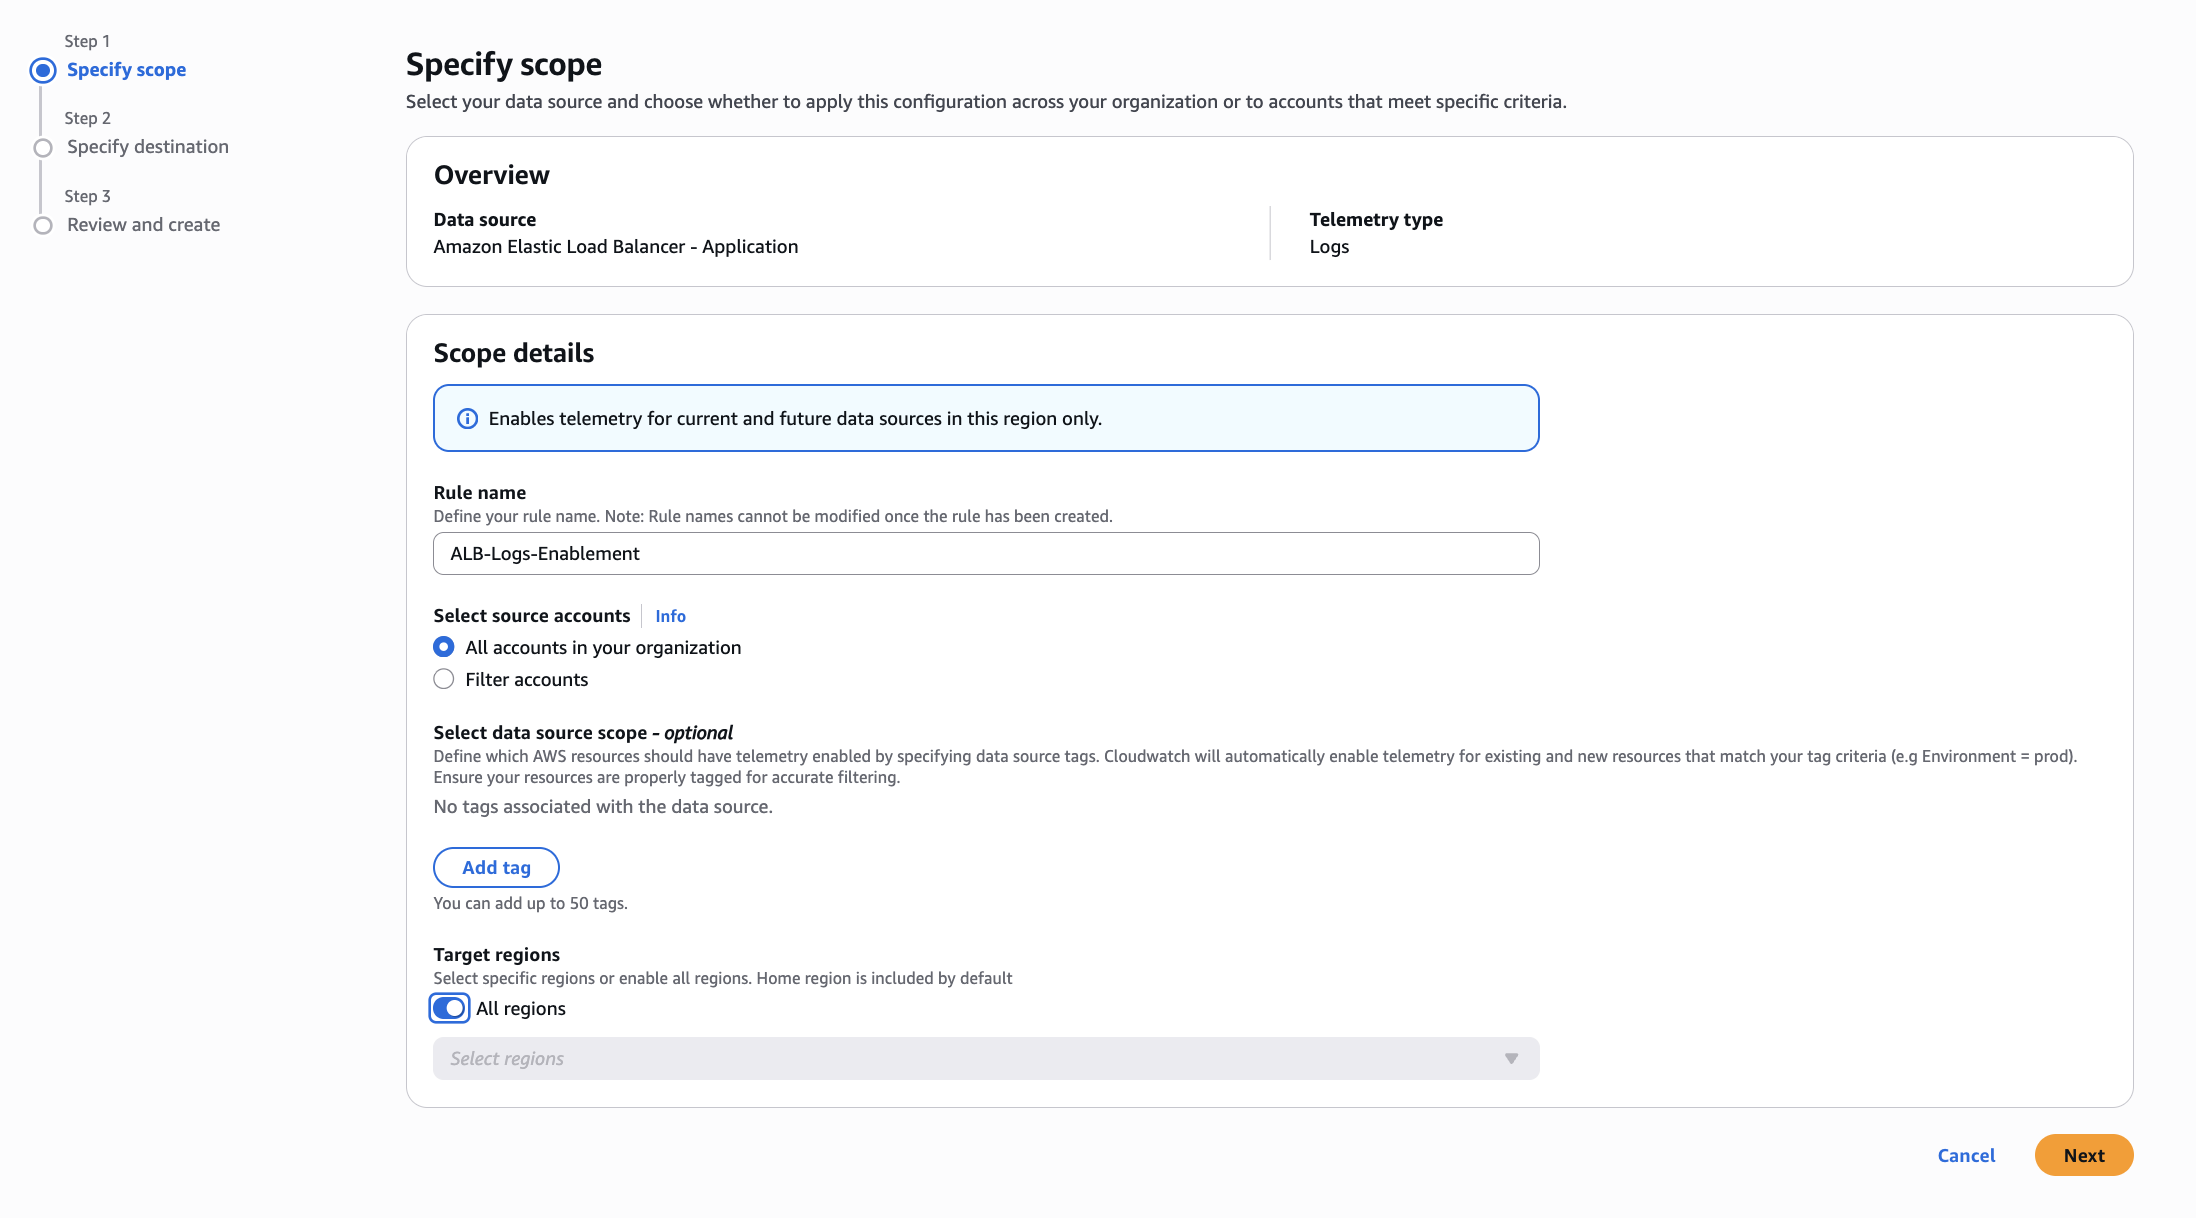
Figure 2: Step 1, Specify scope, with the rule name, source accounts, optional data source tags, and target Regions
- Configure the log group name pattern, retention, and output format, then review and create the rule.
- For Telemetry type, choose Logs, then select the log types you want (Access, Connection, Health Check).
- (Optional) Add tag key/value pairs to scope the rule to a subset of load balancers (for example, Environment: Production).
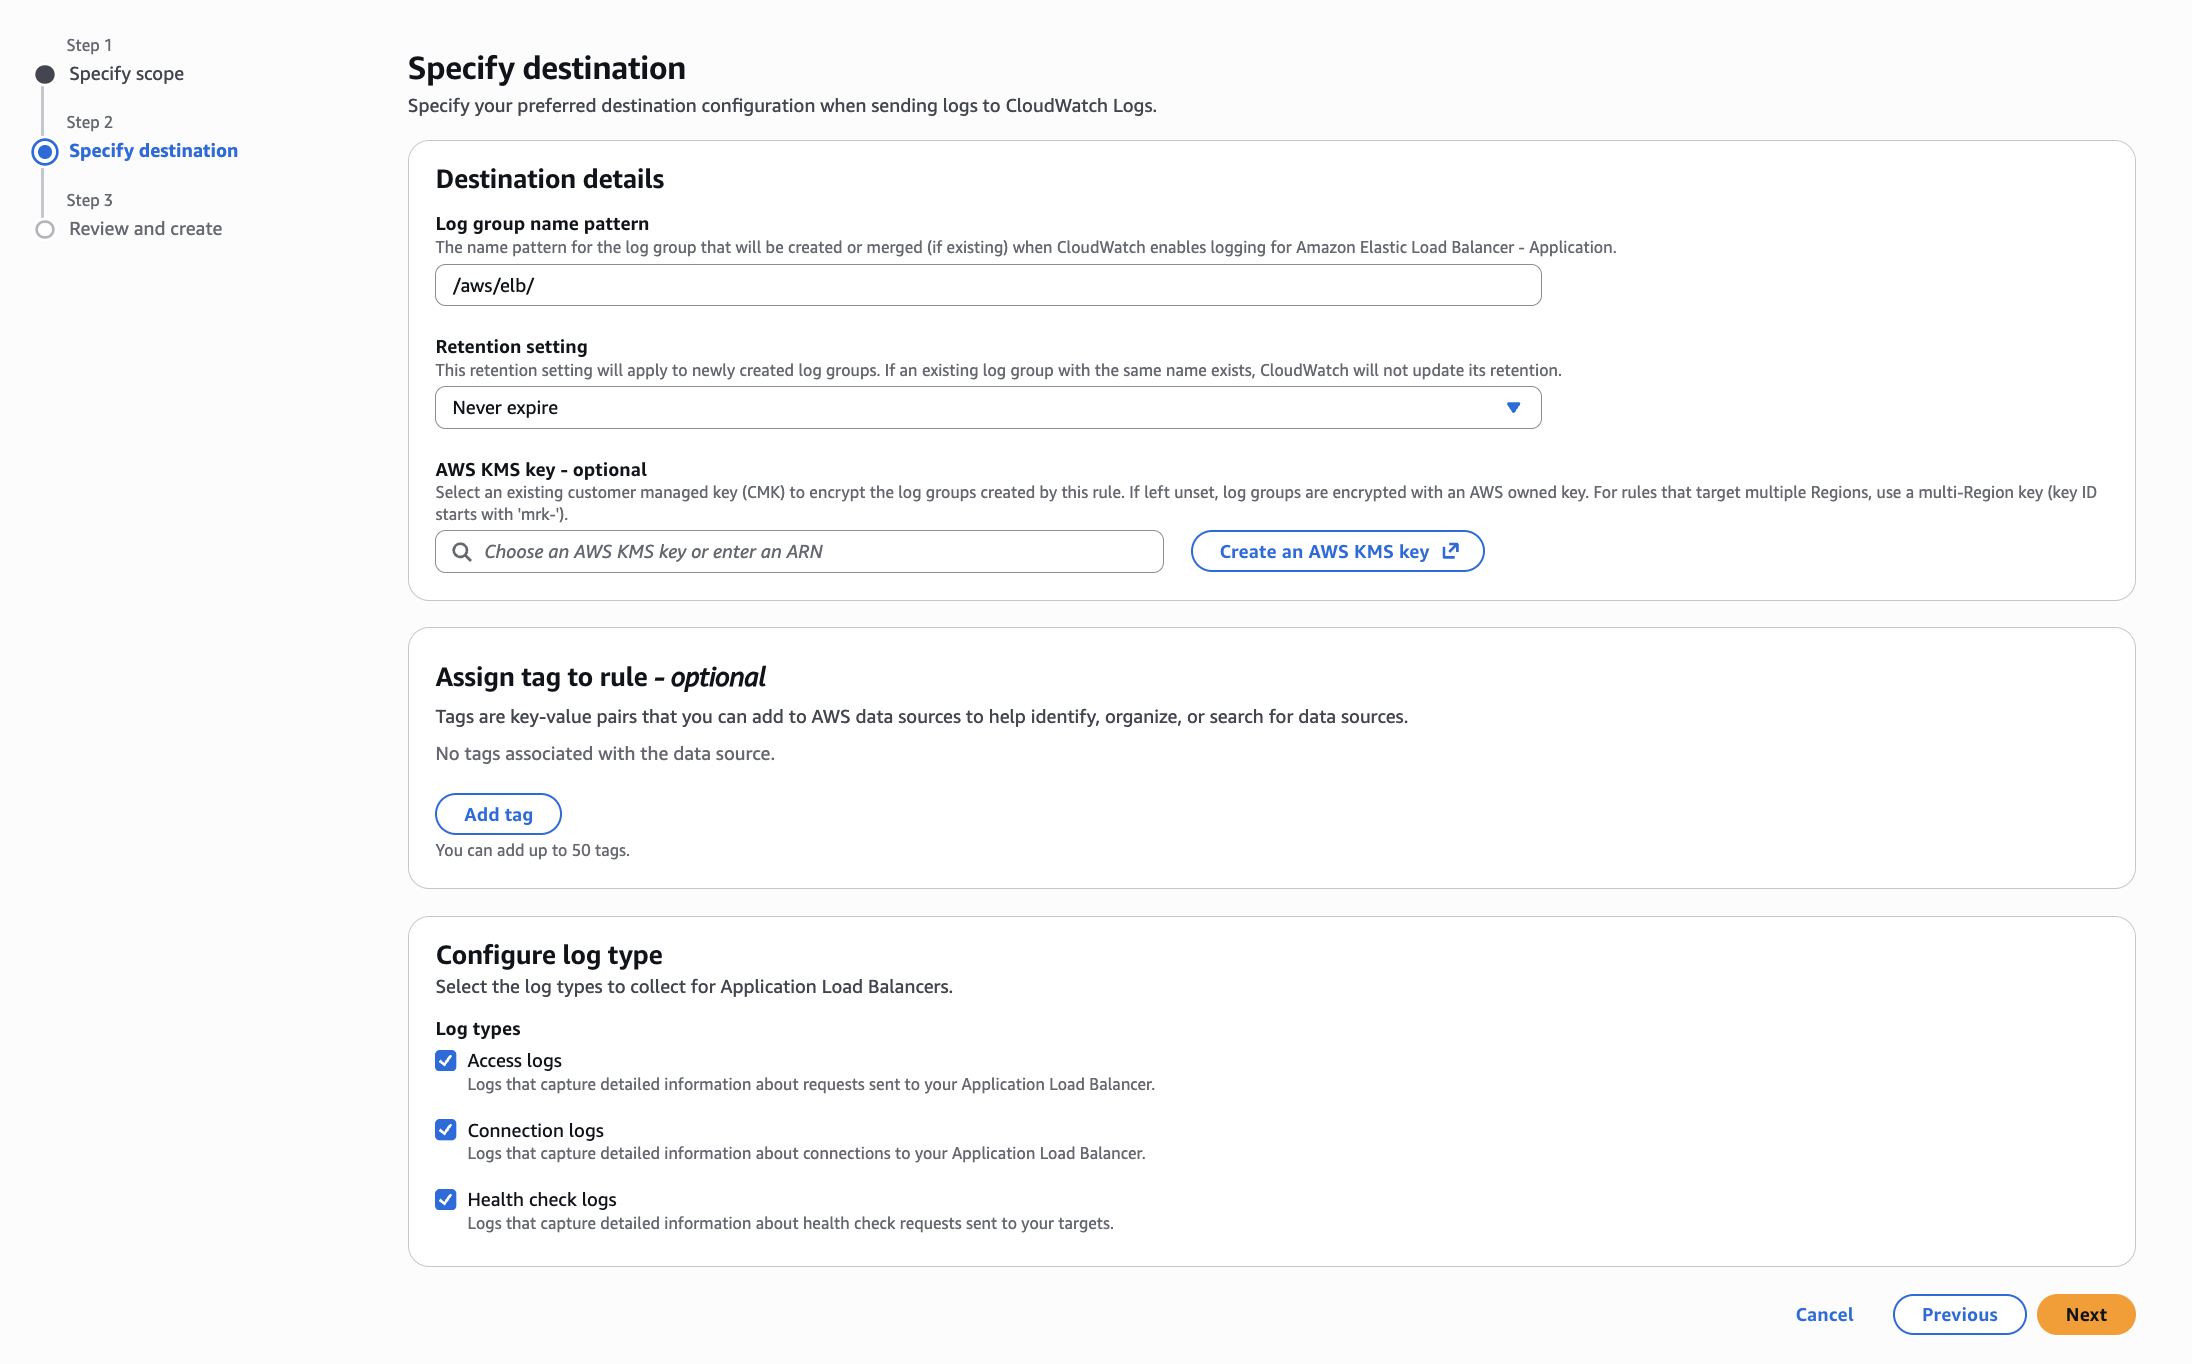
Figure 3: Step 2, Specify destination, with the log group name pattern, retention, encryption, and selection of the three ALB log types
- Review and click Configure Amazon Elastic Load Balancer – Application logs
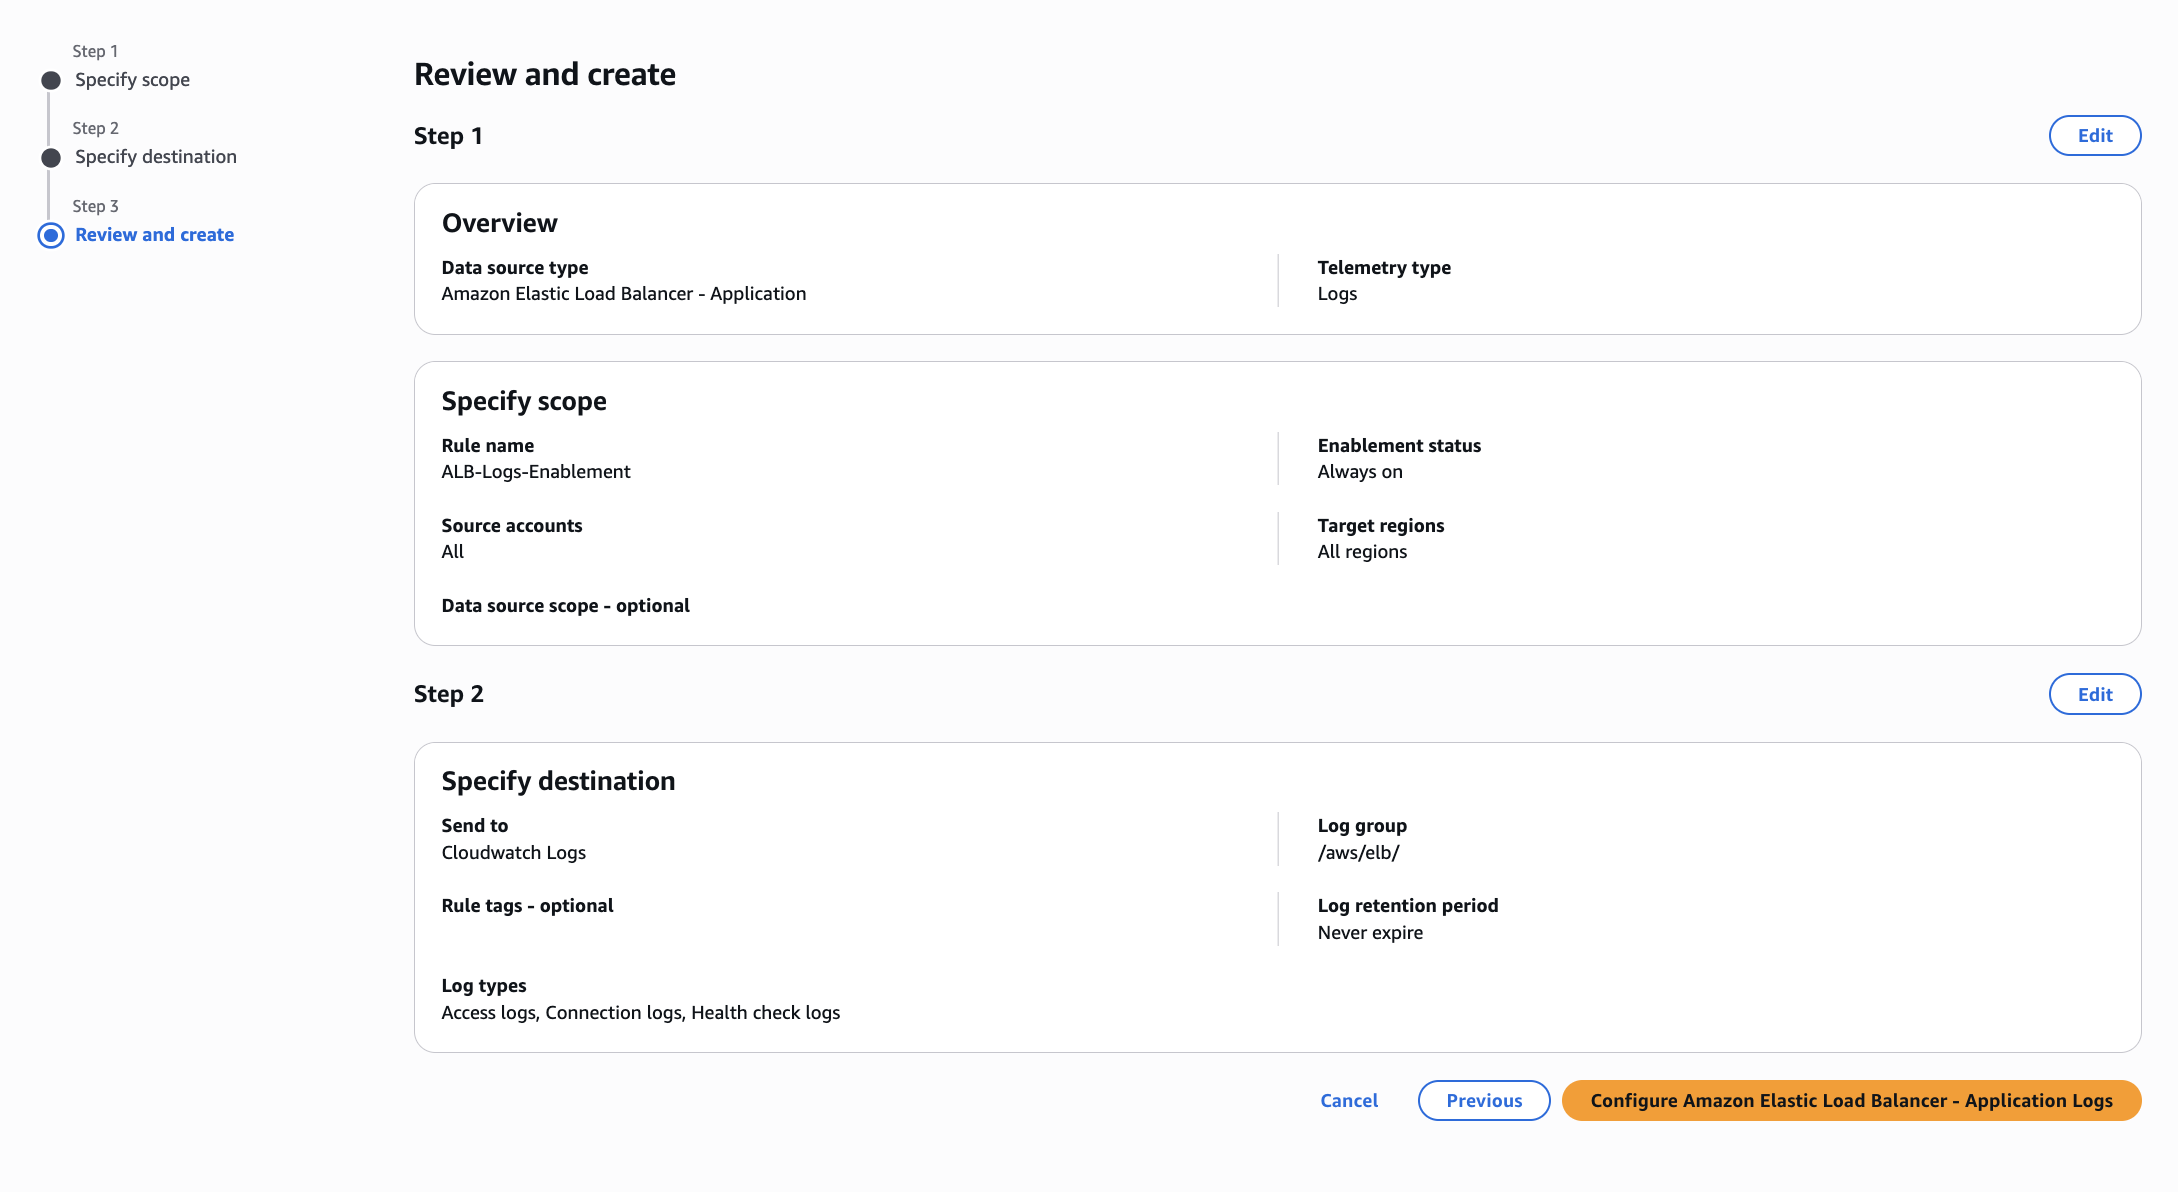
Figure 4: Step 3, Review and create, summarizing the rule name, source accounts, target Regions, CloudWatch Logs destination, and selected log types
Once the enablement rule is active, CloudWatch begins ingesting ALB logs from resources within the rule’s scope. The logs are automatically transformed into structured JSON format and stored in a CloudWatch Logs log group. All three log types land in the same log group, separated by log stream prefix:
- Access logs –
ALB_Access_Logs/app/<lb-name>/<lb-id> - Connection logs –
ALB_Connection_Logs/app/<lb-name>/<lb-id> - Health check logs –
ALB_Health_Check_Logs/app/<lb-name>/<lb-id>
Step 2: Deploy the CloudWatch dashboard via CFN template
CloudWatch Dashboards provide a unified visualization layer for your ALB log data. The sample dashboard uses CloudWatch Log Analytics queries, metrics and Contributor Insights rules to surface operational patterns across all your monitored load balancers, giving your operations team a single destination to monitor traffic, investigate errors, and validate target health.
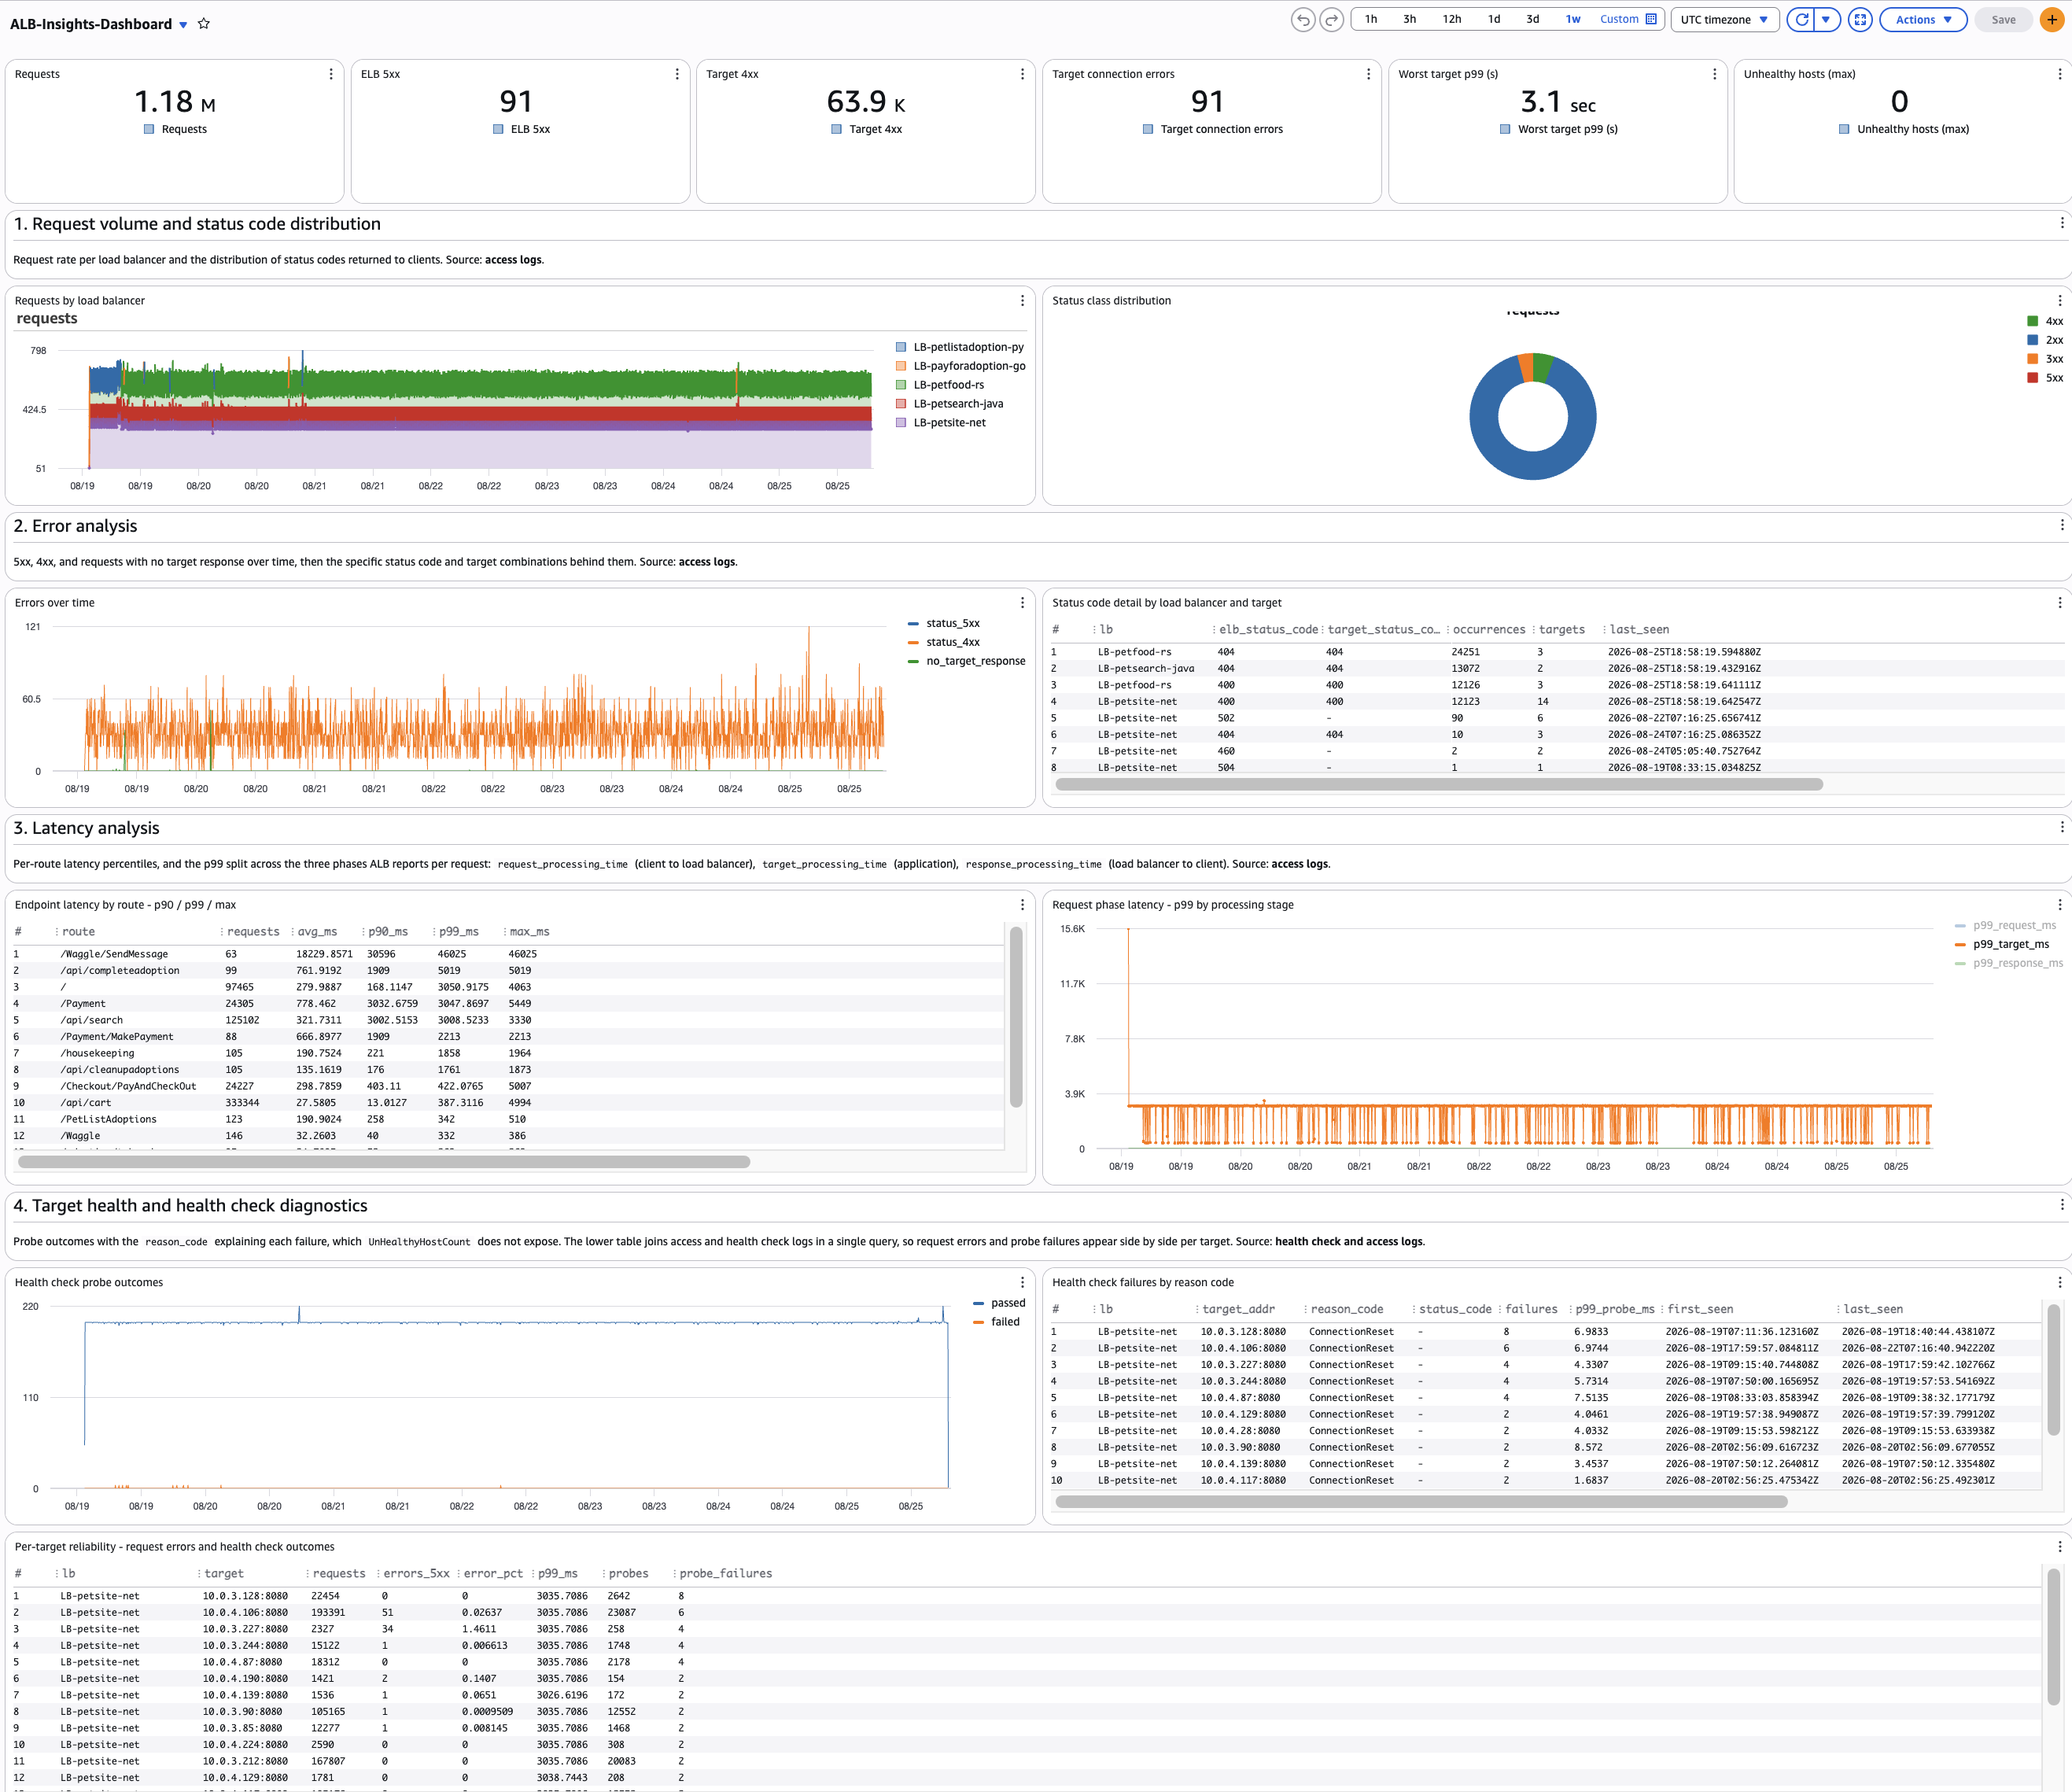
Figure 5: ALB insights dashboard, showing request volume, 5xx error count, worst target p99 latency, status code distribution, and health check detail
To help you get started quickly, we have provided a CloudFormation template that deploys the dashboard
- Download the CloudFormation YAML template.
- Open the AWS CloudFormation console.
- Choose Create stack > With new resources (standard).
- Upload the template and choose Next.
- Enter a stack name and configure the parameters:
- DashboardName – Name of the dashboard (default:
ALB-Insights) - DefaultTimeRange – Time range the dashboard opens on (default:
-PT3H) - CreateContributorInsightsRules –
Yesto add Contributor Insights rules;Nofor dashboard only - ALBLogGroupName – Log group receiving ALB logs (default:
/aws/elb). Used only by Contributor Insights rules. - ResourcePrefix – Prefix for rule names (default:
ALB)
- DashboardName – Name of the dashboard (default:
- Choose Next, configure any stack options as needed, then choose Next
- Review your configuration and choose Submit.
Once the stack creation completes, the CloudWatch dashboard is available and ready to display your ALB log patterns as events are delivered.
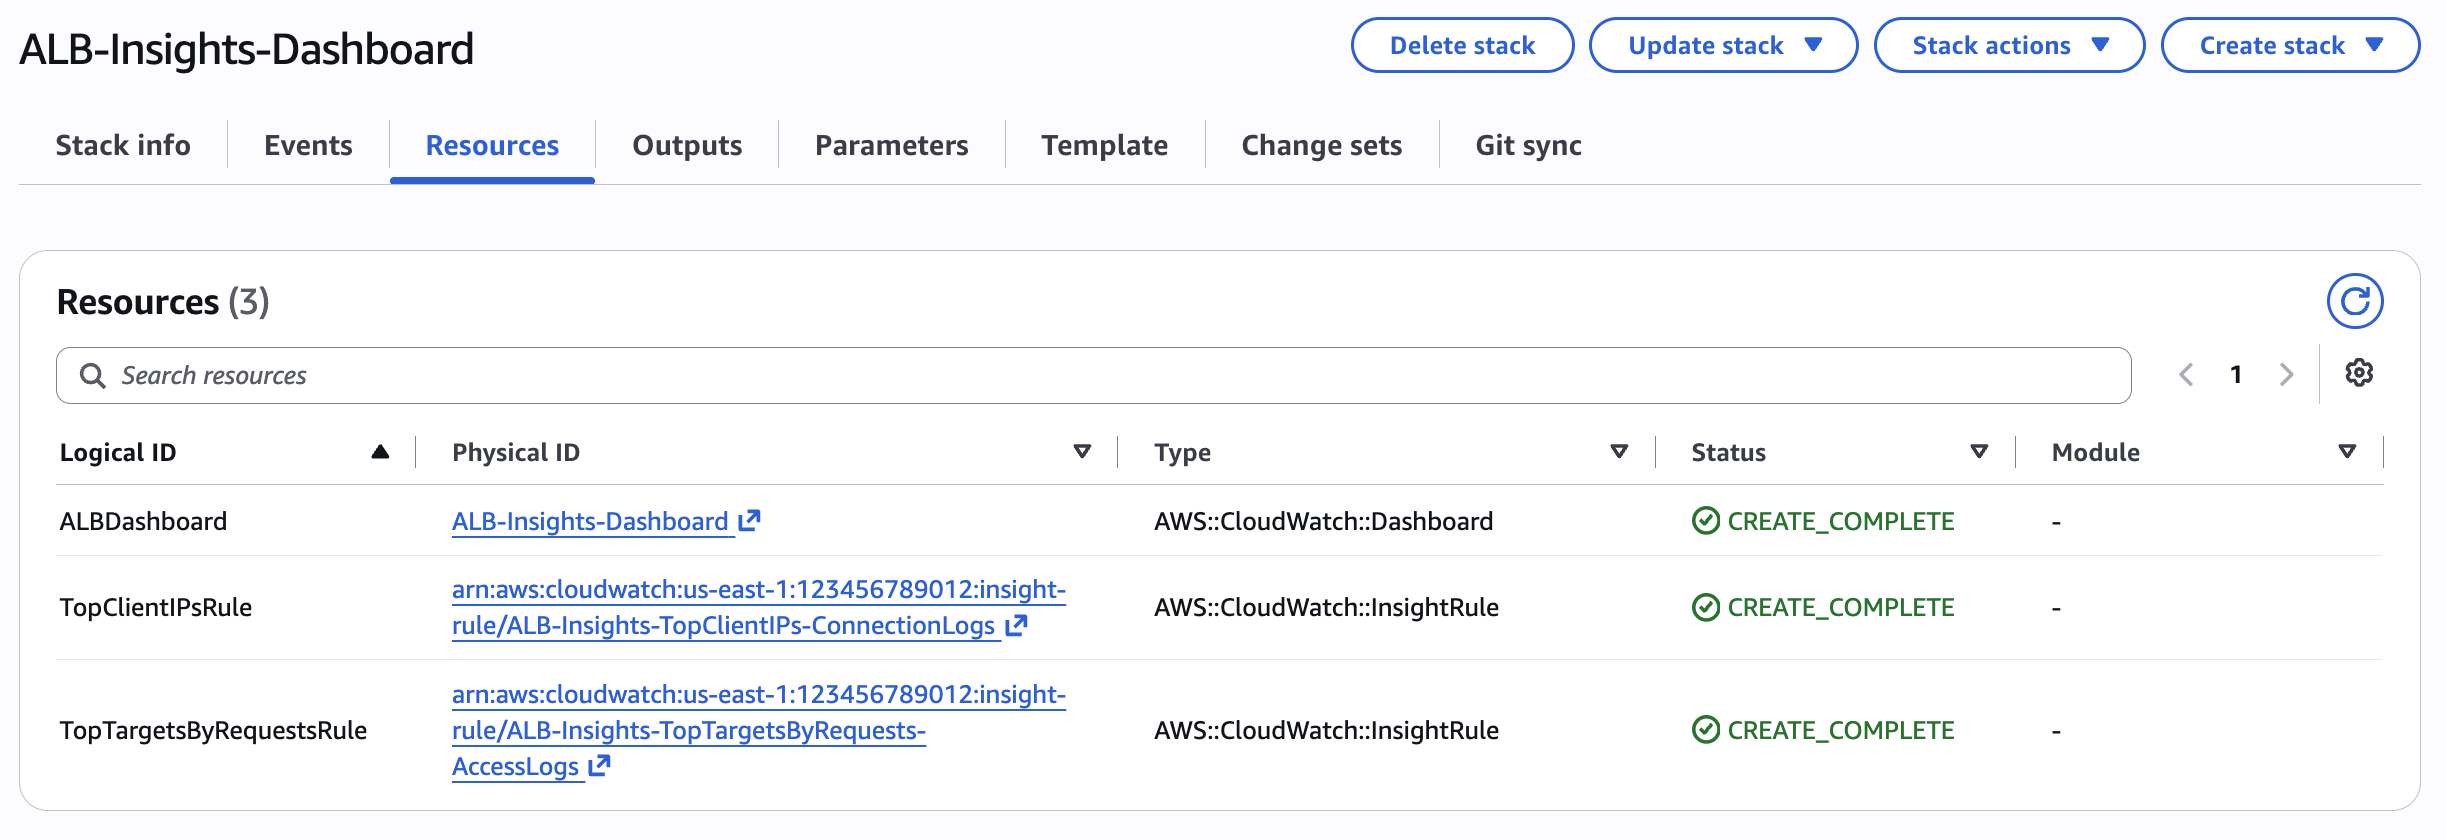
Figure 6: CloudFormation Resources tab showing the dashboard and both Contributor Insights rules with CREATE_COMPLETE status
Analyzing ALB Logs with Log Analytics
With the dashboard deployed, you can also run ad-hoc queries directly. Open Logs > Log Analytics in the CloudWatch console. Here are the queries that answer the most common operational questions.
Is the 5xx from the load balancer or the application?
Which routes are slow?
Per-target reliability combining access and health check logs
SOURCE logGroups()
| filterIndex @data_source_name in ["aws_alb"]
| filterIndex @data_source_type in ["access","health_check"]
| fields coalesce(target_port, target_addr) as target
| filter ispresent(target)
| parse elb /^app\/(?<lb>[^\/]+)/
| stats count(request_line) as requests,
        sum(elb_status_code >= 500) as errors_5xx,
        sum(elb_status_code >= 500)*100.0/count(request_line) as error_pct,
        pct(target_processing_time,99)*1000 as p99_ms,
        count(status) as probes,
        sum(status = "FAIL") as probe_failures
        by lb, target
| sort probe_failures desc, errors_5xx desc
| limit 20
Using Log alarms for alerting ALB health check failures
CloudWatch Log Alarms let you create alarms directly from a Log Analytics query with no custom metrics required. The query runs on a schedule, an aggregation expression produces a numeric value, and the alarm fires when that value breaches a defined threshold. Log Alarms use the same query language as Log Analytics, with no additional cost for custom metric ingestion or storage.
Example: Alarm on health check failures
- Open the CloudWatch console and navigate to Alarms > All alarms.
- Choose Create alarm, then choose Logs as Data source.
- Click Create query in Log Analytics
- Run the below query and click Continue to Alarms
- For Aggregation expression, enter sum(probe_failures).
- For Alarm Conditions, choose Greater than and enter 0.
- For Schedule, choose a frequency (for example, rate(5 minutes)).
- Set StartTimeOffset to 300 seconds (matches the 5-minute schedule).
- For M out of N, set to 1 out of 1 to alarm on the first occurrence.
- Configure an Amazon SNS topic for notifications.
- Choose Create alarm.
The alarm now evaluates your query every 5 minutes and fires when any health check probe fails.
(Optional) Expanding Capabilities
The enablement rule and CloudFormation template are sufficient to get started. The following sections describe optional capabilities for teams that want to go further.
Enrich ALB Logs at Ingestion with a Pipeline
CloudWatch Logs pipeline processes ALB records at ingestion, letting you enrich, transform, or reshape fields before they reach your log group.
Create a pipeline
- Open the CloudWatch console and navigate to Ingestion > Pipelines.
- Choose Create pipeline.
- On the Getting started page:
- For Select data source, choose AWS Application Load Balancer logs.
- For Log source type, choose the log type you want to enrich (Access, Connection, or Health Check).
- For Service access, choose Auto create and use a new service role to let CloudWatch create the required IAM role.
- Choose Next to configure the pipeline destination and log group settings.
- On Configure processors page, add processors to transform the data. Below are sample processors that are useful for ALB logs:
- Convert Type (Mutate Events) – Converts elb_status_code from string to integer so that numeric comparisons in metric filters (for example, {
$.elb_status_code >= 500}) evaluate correctly. - GeoIP (Enrich) – Adds geographical information (country ISO code, city name, ASN organization) to records based on the client_ip field, writing the result to a new client_geo Use a conditional expression (
client_ip != "") to skip records where the field is empty. This lets you answer “where is my traffic coming from?” directly in your queries without maintaining an external IP lookup. - Translate (Mutate Events) – Maps elb_status_code values to a human-readable elb_status_meaning field using static mappings (for example, 503 -> “no_registered_or_healthy_targets”). Add a run-when condition (
elb_status_code != ""andelb_status_code != "200") so the processor only runs on error responses, keeping the field absent on successful requests to reduce noise.
- Convert Type (Mutate Events) – Converts elb_status_code from string to integer so that numeric comparisons in metric filters (for example, {
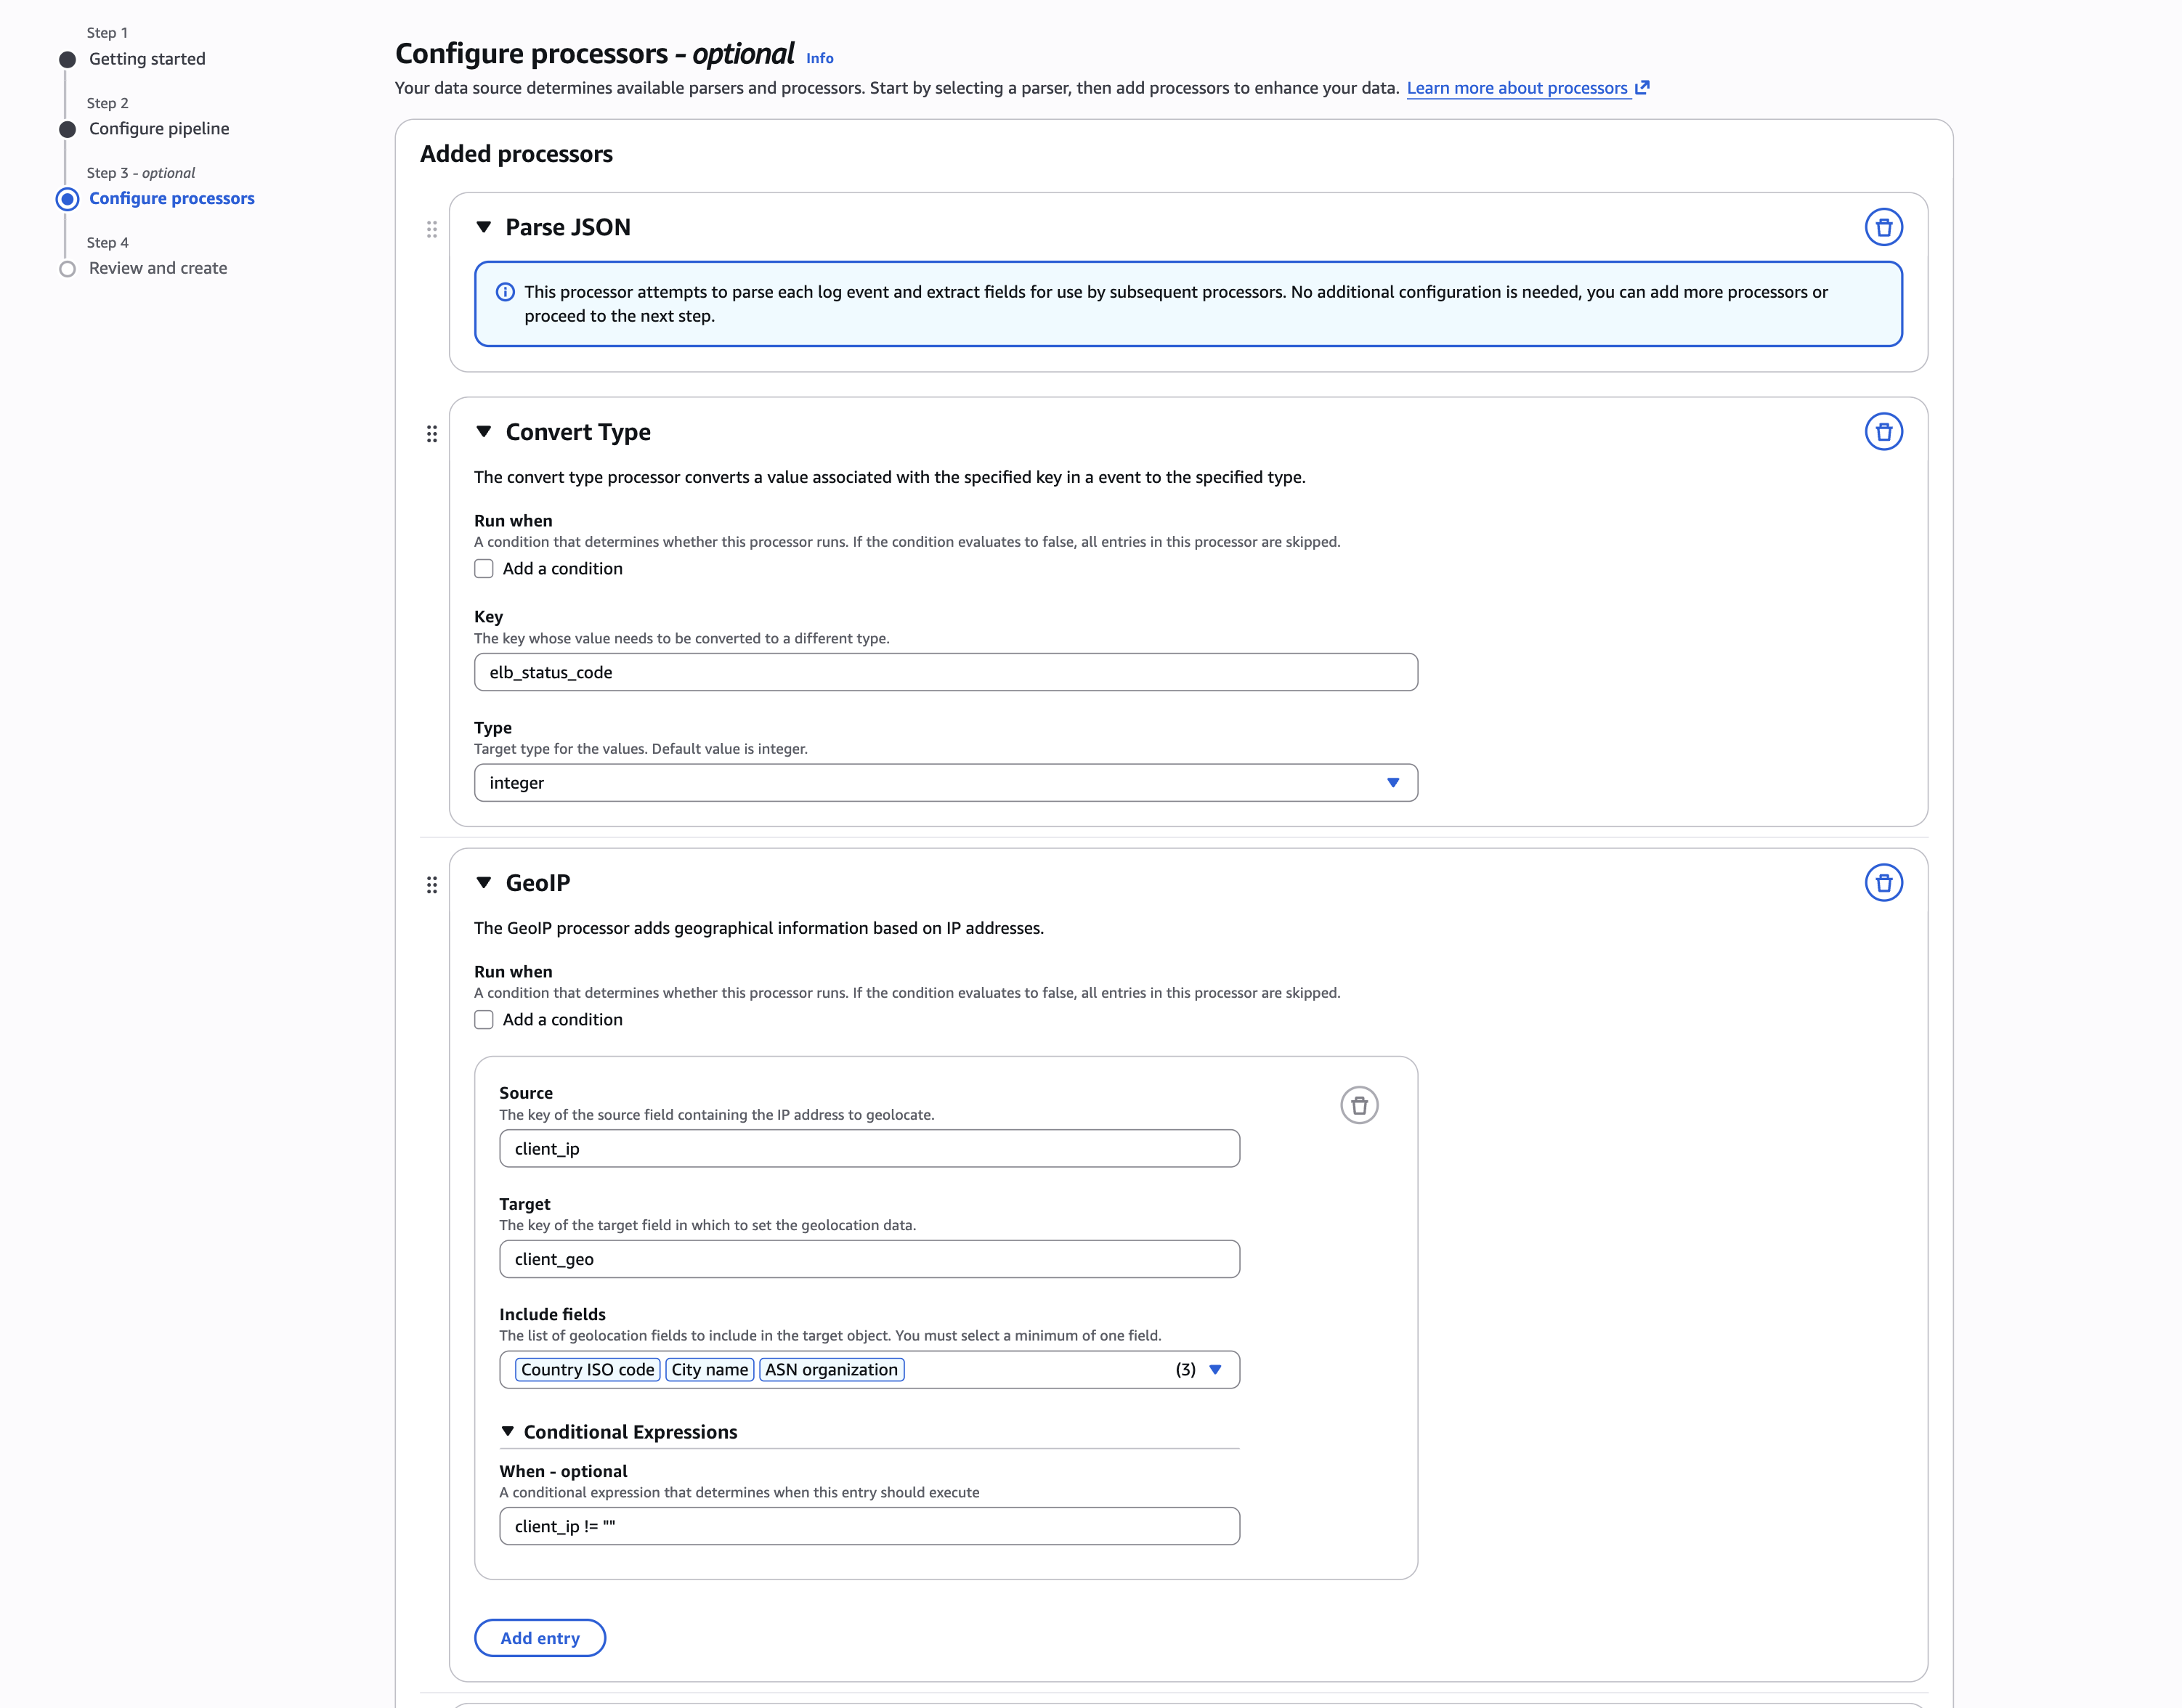
Figure 7: Configure processors page with Parse JSON, Convert Type, and GeoIP processors added
- Choose Test processors to validate your configuration against sample log events before saving.
- Review and create the pipeline.
Centralize ALB Logs into One Account
If you run workloads across multiple accounts, CloudWatch Logs centralization consolidates log groups from multiple accounts and Regions into one destination account. Centralized log groups are enriched with @aws.account and @aws.region fields, so a platform team can query the entire fleet from one place.
For detailed steps, see Simplifying log management using Amazon CloudWatch Logs centralization.
Contributor Insights
Contributor Insights continuously ranks the top-N contributors to a pattern. The template creates two rules:
| Rule | Key field | What it ranks |
| TopClientIPs-ConnectionLogs | $.client_ip | Top client IPs by connection count (from connection logs) |
| TopTargetsByRequests-AccessLogs | $.target_port | Top targets by request volume (from access logs) |
To create the top client IPs rule manually:
- Open the CloudWatch console and navigate to Insights > Contributor Insights.
- Choose Create rule.
- For Rule name, enter ALB-TopClientIPs-ConnectionLogs.
- Under Log group(s), select your ALB log group (for example, /aws/elb).
- For Log format, choose JSON.
- For Aggregate on, choose Count.
- Under Contribution:
- For Key, enter
$.client_ip.
- For Key, enter
- Under Filters, add a filter:
- For Match, enter
$.client_ip. - For Condition, choose
IsPresent = true.
- For Match, enter
- Choose Create rule.
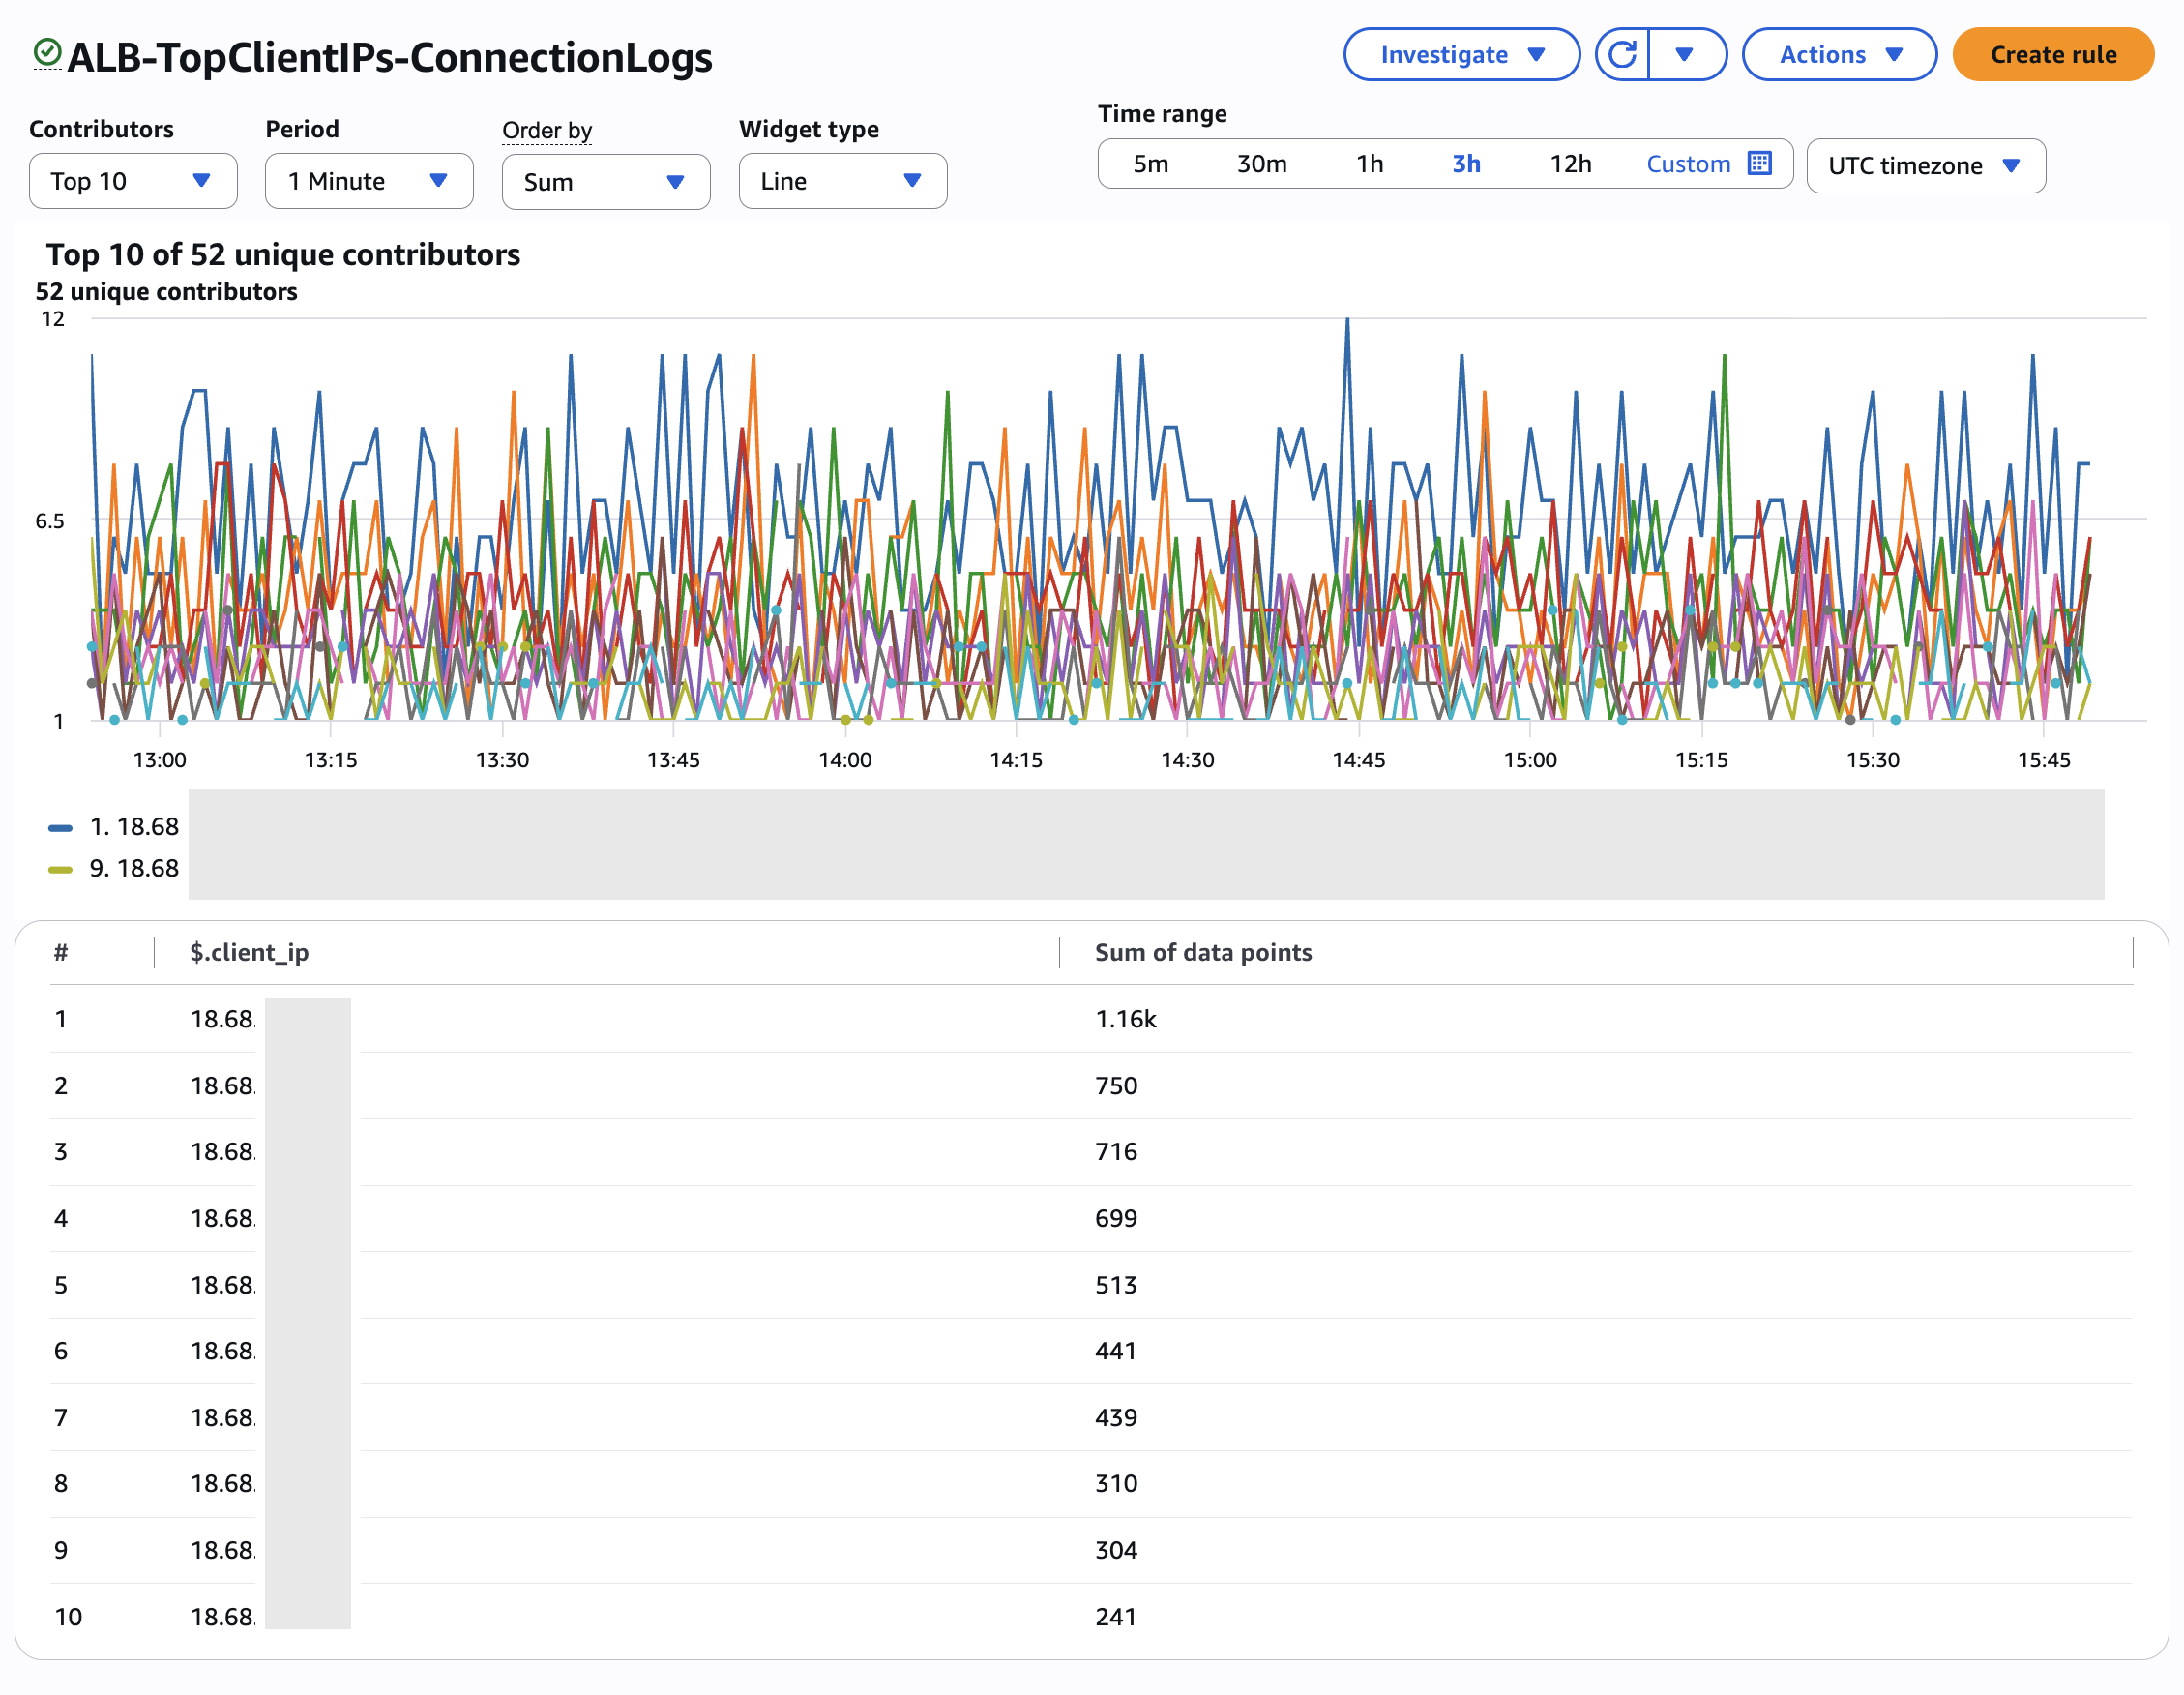
Figure 8: The TopClientIPs-ConnectionLogs rule ranking the top 10 client IPs by connection count over a three-hour window
Cleanup
To stop charges, remove resources in this order:
- Delete the telemetry enablement rule from Ingestion > Enablement rules.
- Delete the pipeline from Ingestion > Pipelines, if you created one.
- Delete the CloudFormation stack (removes the dashboard and Contributor Insights rules).
- Delete the ALB log groups or set short retention.
Conclusion
ALB access, connection, and health check logs now deliver directly into CloudWatch Logs as structured JSON, giving you request-level, connection-level, and target-level visibility into your workload’s entry point. A single enablement rule covers every load balancer in your AWS organization. Log Analytics separates load balancer faults from application faults. Log Alarms notify you when something breaks. Contributor Insights ranks the clients and targets driving your traffic. No pipelines, no parsing, no additional infrastructure.
To get started, open the CloudWatch console, navigate to Ingestion > Enablement rules, and create a rule for your Application Load Balancers. For more information, see the Amazon CloudWatch Logs documentation.