AWS Cloud Operations Blog
Analyze logs usage with Amazon CloudWatch enhanced automatic dashboard
Gain deeper visibility into your Amazon CloudWatch Logs usage patterns, costs, and potential issues with an improved automatic dashboard that helps you optimize and manage your CloudWatch Logs usage. In this post, we’ll explore why understanding usage is important, where to find the dashboard, and what you’ll discover. We’ll also share other tools to help you understand your CloudWatch usage and cost.
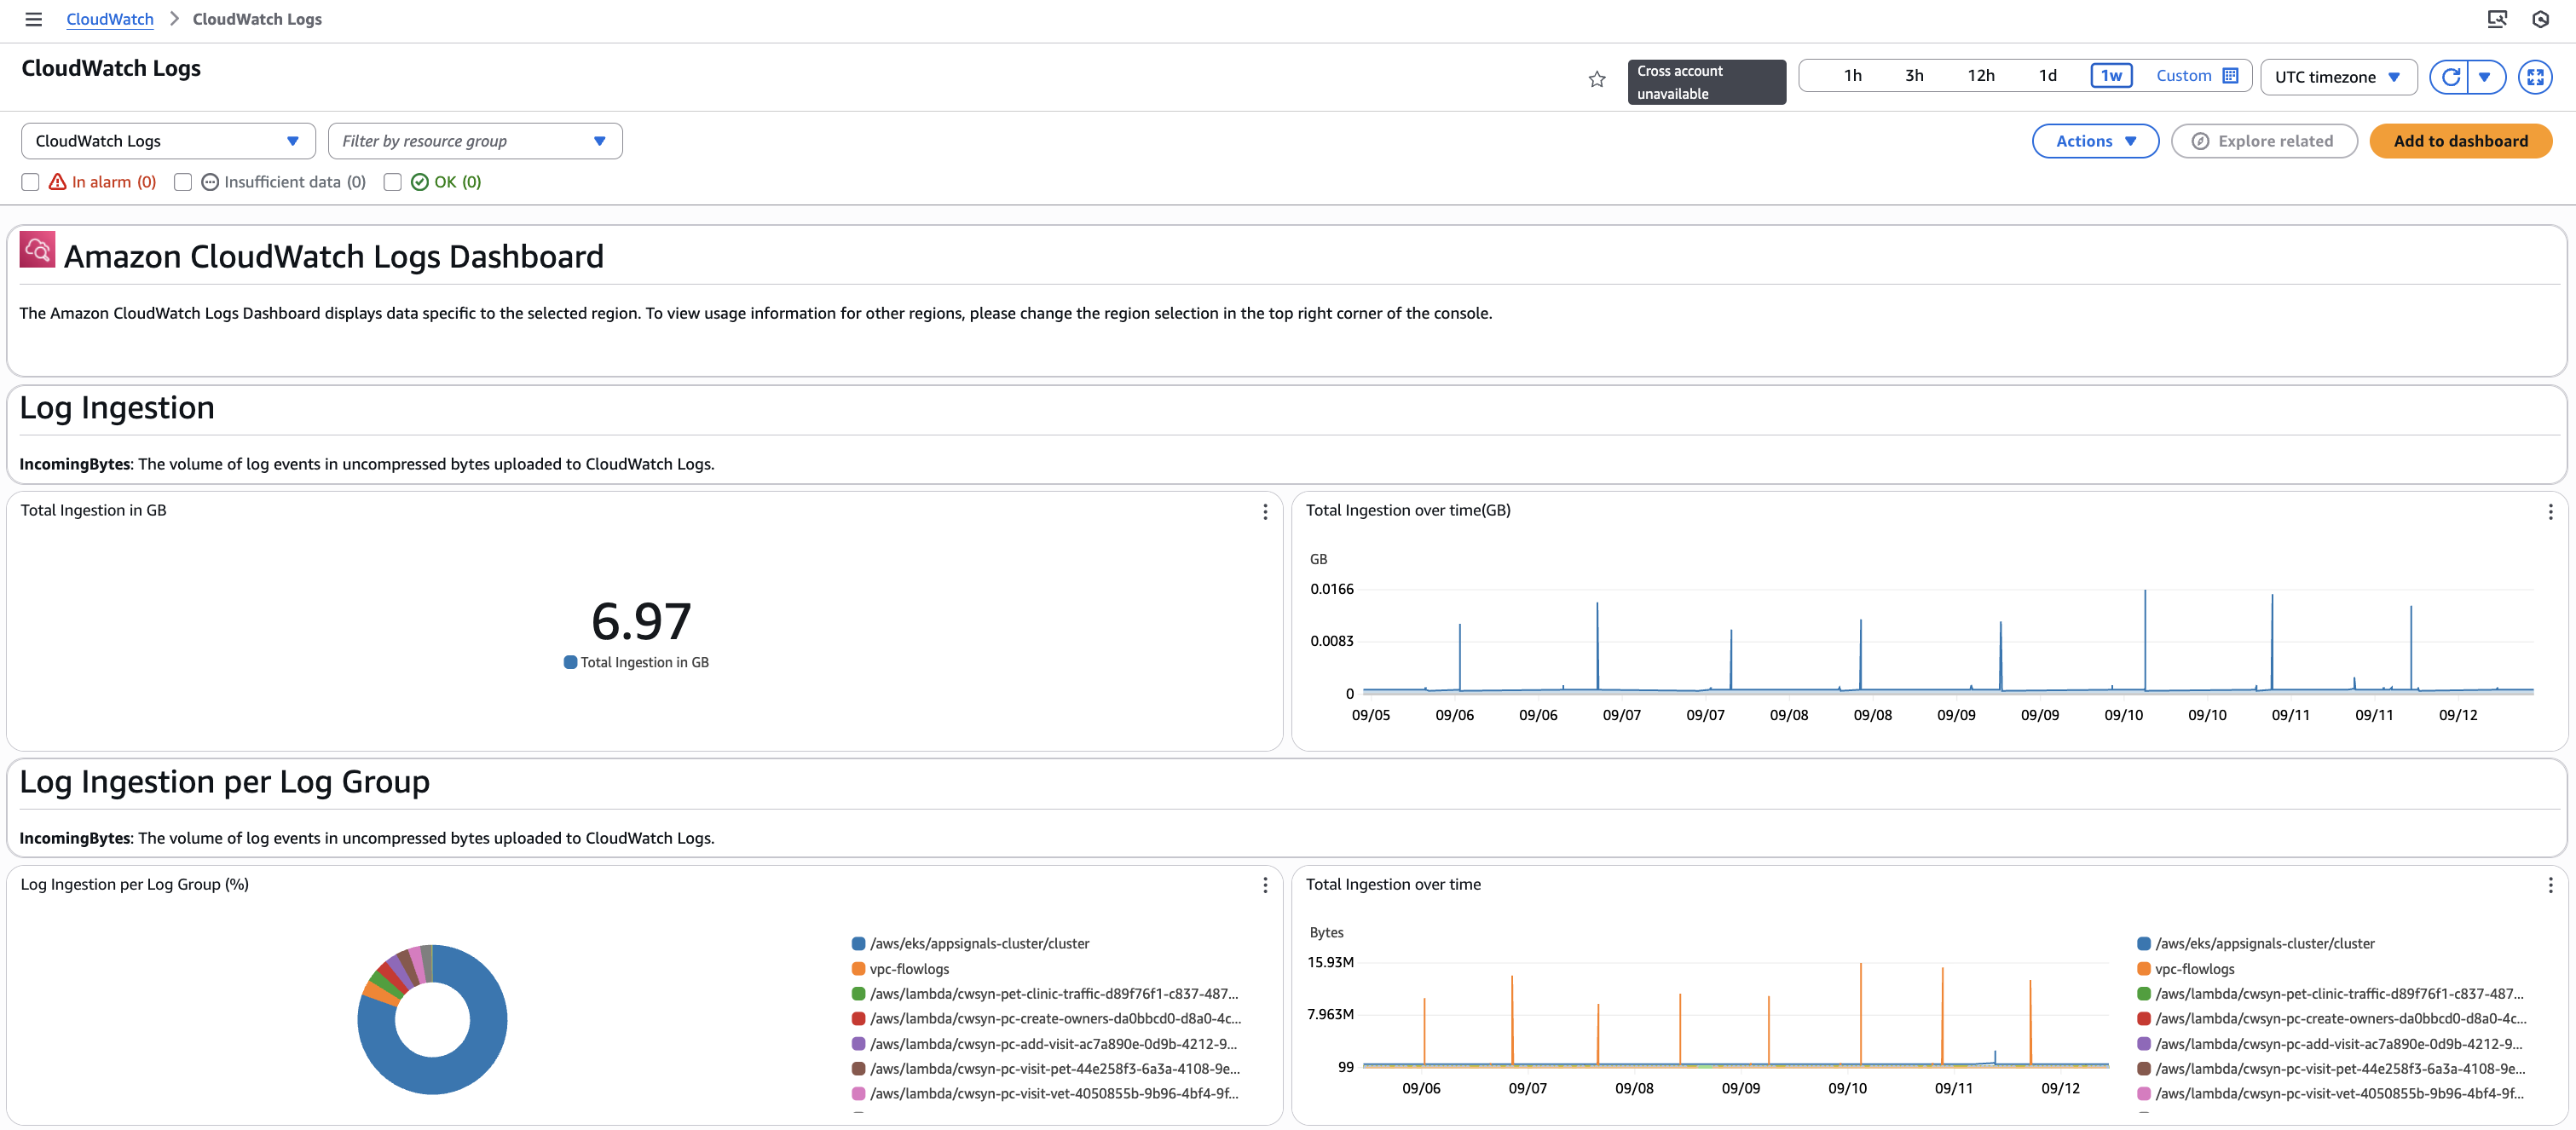
Figure 1: Part of the new improved automatic dashboard for CloudWatch Logs.
Why understanding usage is important
CloudWatch is an observability service that allows you to understand the health of your applications and infrastructure. Observability provides information to help you understand your customer experience, maintain operational health, optimize resource utilization, and quickly respond to performance changes. By collecting metrics, logs, and trace data, CloudWatch enables you to analyze, visualize, and take actions based on your data.
Understanding the costs associated with your applications is a key component of understanding the value that an application brings. Cost and usage data allows you to identify areas for cost optimization, including those associated with operations support such as observability. By understanding what drives your CloudWatch usage, you can make data-driven decisions about your observability strategy and see the impact of those changes on your costs.
Finally, understanding where there are errors or throttling in your CloudWatch experience enables you to identify and remediate any issues to ensure you are able to use all of the data you expect.
This new dashboard is an out-of-the-box experience which provides details on usage in commonly requested areas for CloudWatch Logs.
The dashboard can be found in the CloudWatch console.
- Navigate to the Dashboards section in the left menu, and then to the Automatic dashboards tab.
- This tab contains several out-of-the-box dashboards. Choose CloudWatch Logs to view the dashboard.
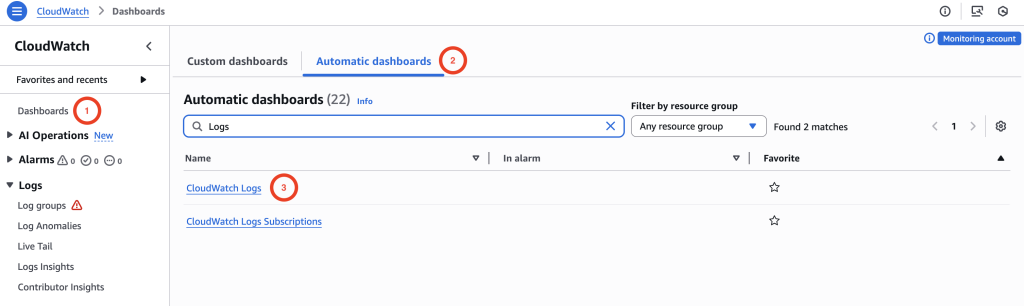
Figure 2: Part of the new improved automatic dashboard for CloudWatch Logs.
Dashboard Overview
The dashboard is split into sections, allowing you to see different areas of CloudWatch Logs utilization.
The displayed data corresponds to your current Region and account. To view CloudWatch usage for other Regions, simply change the Region selection in the top right of the console.
Most of the data is presented as time-series graphs, enabling you to observe the impact of any changes you have made. Numeric displays show aggregated data for your selected time range. You can adjust both, the time range and the time zone, using the time controls at the top right of the dashboard.
To examine a specific time series in a single chart, select the name in the legend to hide all other series. Related widgets containing the same series name will automatically adjust to match your selection. Select the series name again to revert to the full view.
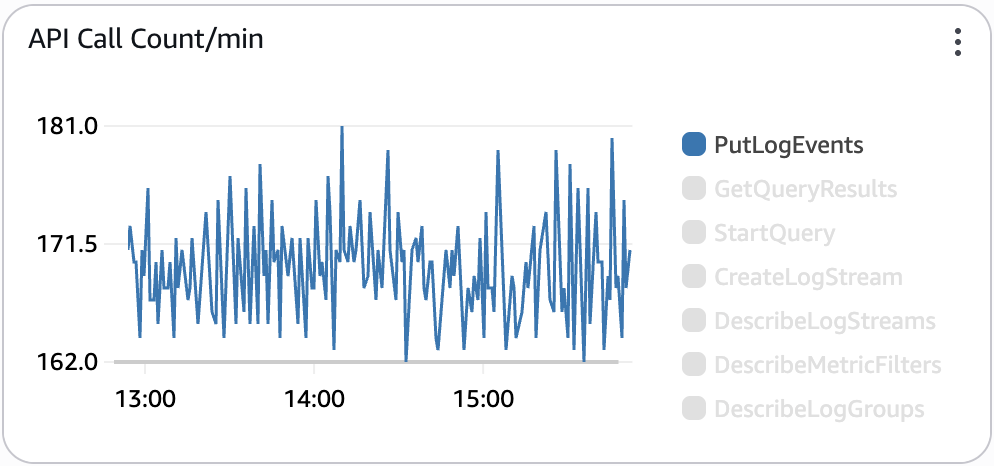
Figure 3: CloudWatch dashboard widget showing a single series being displayed after selecting it from the legend.
The dashboard shows usage information. For more information on translating this into costs, refer to the Amazon CloudWatch pricing page.
The dashboard is divided into several key sections, each with a number of dashboard widgets.
- Log ingestion by account
- Log ingestion by log group
- Service usage
- Embedded Metric Format (EMF)
- Subscription filters
- Log anomaly detection
- Log data protection
- Log transformers
Sections 1 & 2: Log ingestion
Log ingestion is typically one of the more significant drivers of costs for CloudWatch Logs. The cost of log ingestion should be reflected in the value it provides. Knowing the log groups driving this can allow you to have conversations with the teams supporting the associated application. Alongside considering what you ingest (volume, verbosity, filtering), consider whether to use standard or infrequent access log class, depending on the functionality you require. This is set at the log group level.
Section 1: Account log ingestion
Widgets:
- Total GB volume for logs ingested.
- GB volume of logs ingested over time.
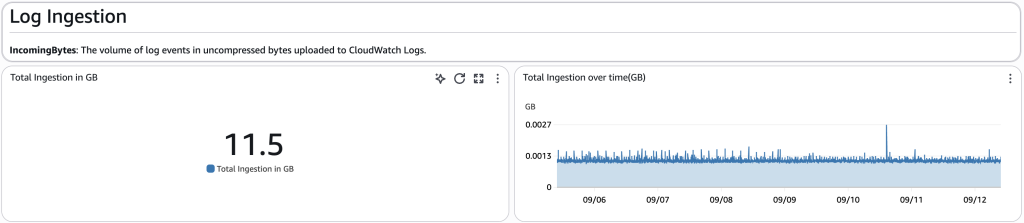
Figure 4: Dashboard section on log ingestion for the account.
Section 2: Log ingestion per log group
Widgets:
- Pie chart showing how log ingestion (GB) is distributed across log groups.
- Volume (GB) log ingestion over time by log group.
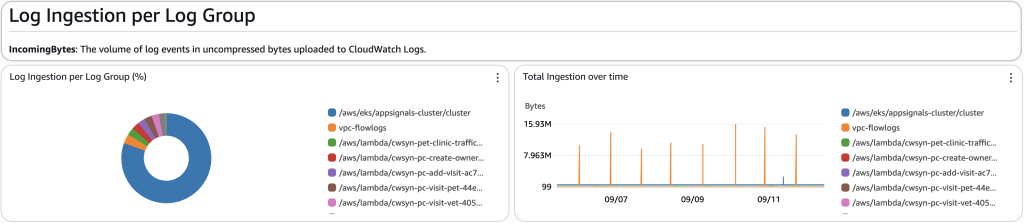
Figure 5: Dashboard section on log ingestion broken down by log group.
Section 3: Service usage
Service usage encompasses all API calls made to CloudWatch, whether direct or indirect. When you upload logs to a log group, CloudWatch uses the PutLogEvents API call. Similarly, running Logs Insights queries invokes the StartQuery API.
CloudWatch enforces limits on API calls, and when you exceed this you may see API errors or throttling, which can also be seen in this section. For more information about throttling, refer to How do I troubleshoot throttling errors in my CloudWatch logs?
Widgets:
- Count of main API calls over time (i.e. DescribeDestinations).
- API error count over time.
- API throttling count over time.
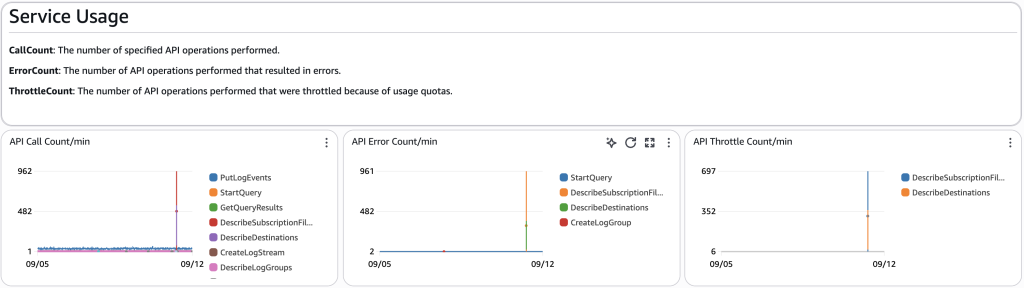
Figure 6: Dashboard section on service usage.
Section 4: Embedded Metric Format
With Embedded Metric Format (EMF), you can include both metrics and detailed log information in the same log event. CloudWatch automatically creates the corresponding metrics in CloudWatch Metrics when it ingests EMF log events. Being able to combine metric data and detailed log information within the same event creates a direct association between log messages and their associated metrics. This can be an effective alternative to sending metrics using the PutMetricData API.
Follow the EMF specification to ensure proper JSON structure and successful automatic metric extraction for your logs. You can use the provided widgets to monitor any ingestion failures.
Widgets:
- Count of validation errors over time, split by log group name.
- Count of parsing errors over time, split by log group name.
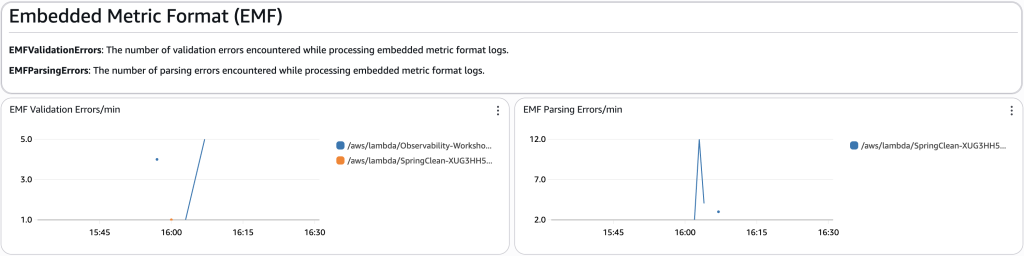
Figure 7: Dashboard section on Embedded Metric Format (EMF).
Section 5: Subscription filters
Subscription filters enable real-time streaming of log data from CloudWatch Logs to other AWS services for additional processing, analysis, or storage. You can create subscription filters on a log group to automatically send matching log events to your chosen destination.
While subscription filters themselves don’t incur an additional cost, costs are incurred by the destination services such as Amazon Data Firehose or AWS Lambda. Monitoring the number of forwarded events and their source log groups helps you understand usage and associated costs. This section also contains graphs of errors and throttling over time, broken down by log group, so you can identify and remediate any issues.
Widgets:
- Count of events forwarded over time, split by log group name.
- Count of errors over time, split by log group name.
- Count of throttling over time, split by log group name.
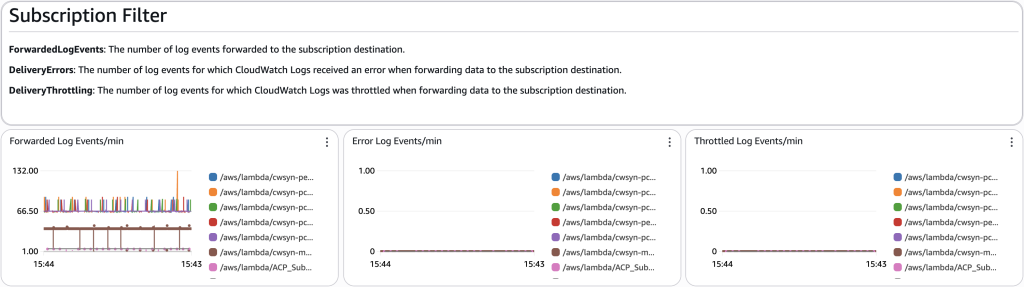
Figure 8: Dashboard section on subscription filters.
Section 6: Log anomaly detection
CloudWatch Log Anomaly Detection uses machine learning to analyze log data and identify patterns in your logs, surfacing any anomalous behavior, such as a sudden decrease in log events with a 200 status code. When anomalies are detected, CloudWatch assigns a priority of high, medium, or low to the finding, based on the magnitude of the change in the number of log events, and on specific keywords such as “Exception”. Note that you can use the pattern functionality in Logs Insights independently of the anomaly detection feature.
Widgets:
- Total number of low, medium, and high log anomalies detected.
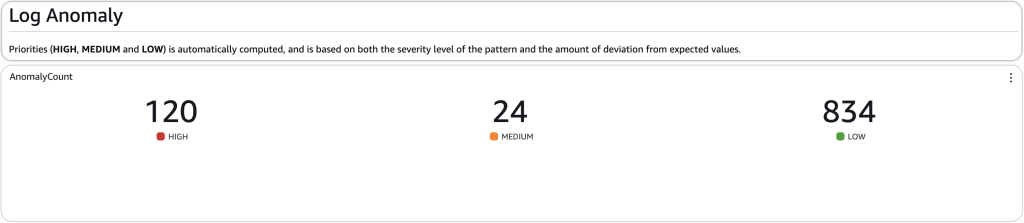
Figure 9: Dashboard section on log anomaly detection.
Section 7: Log data protection
With CloudWatch Logs you can create a data protection policy that will identify and mask sensitive data upon ingestion. Within a policy you define the type of sensitive data such as credit card numbers, API keys, or Personally Identifiable Information (PII). You can create policies for individual log groups, or account wide.
Widgets:
- Number of log events matching a policy over time, split by log group.
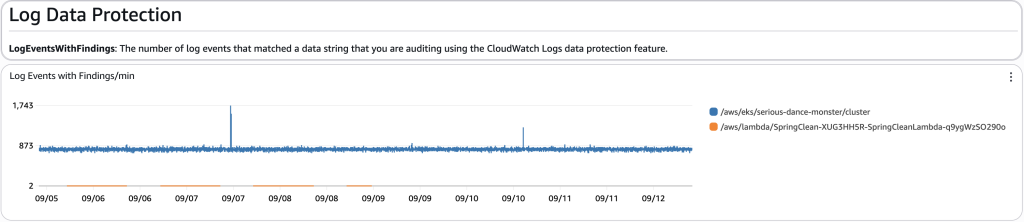
Figure 10: Dashboard section on log data protection.
Section 8: Log transformers
When you want to standardize your logs, you can use CloudWatch Log Transformers to process and transform log data on ingestion. You can use transformers to improve consistency by standardizing field names (such as converting variations like user_id, userId, and user), add structure by convert a log event into JSON for easier searching, or enhance context by including additional data such as application names. Transformers use built-in processors, which can be applied in sequence to achieve your desired result. You can apply transformers to individual log groups, or account wide.
Widgets:
- Count of log events transformed over time, by log group.
- Count of bytes transformed over time, by log group.
- Count of transformation errors over time, by log group.
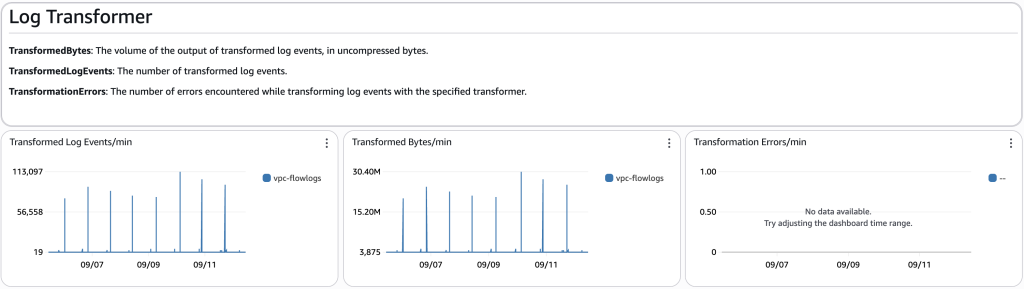
Figure 11: Dashboard section on log transformers.
Costs
The CloudWatch Logs dashboard provides an out-of-the-box experience at no additional cost.
Note: creating your own CloudWatch custom dashboard has associated costs for the dashboard. Refer to the Amazon CloudWatch pricing page for details.
Other tools for understanding usage and cost
While this new dashboard provides valuable insights, there are other resources to help you understand your CloudWatch usage and costs:
- AWS documentation for Analyzing, optimizing, and reducing CloudWatch costs.
- AWS Cost Explorer: Visualize, understand, and manage your AWS spend across accounts.
- CUDOS Dashboard: Part of the Cloud Intelligence Dashboards framework, providing deep insights into AWS spend and usage across your entire organization.
- Build your own custom CloudWatch dashboard to explore specific areas of interest. For examples and AWS CloudFormation templates, refer to “Visualizing Amazon CloudWatch Costs – Part 1” and “Visualizing Amazon CloudWatch Costs – Part 2 – Where does the data come from?“.
Conclusion
This improved out-of-the-box CloudWatch automatic dashboard offers a better understanding of your CloudWatch Logs usage at no additional costs. You can use this data to identify cost drivers and optimize your CloudWatch usage to get the most value from the service.
To enhance your usage monitoring, consider setting up billing alarms or CloudWatch alarms based on the more detailed metric data shown in this dashboard, such as log group ingestion. CloudWatch alarms can be configured using individual metrics or metric math, with the flexibility to use either a static threshold or anomaly detection.
Note: Creating your own CloudWatch custom dashboard has associated costs for the dashboard. Refer to the Amazon CloudWatch pricing page for details.
While this new dashboard provides valuable insights, there are other resources to help you understand your CloudWatch usage and costs:
- AWS documentation for Analyzing, optimizing, and reducing CloudWatch costs.
- AWS Cost Explorer: Visualize, understand, and manage your AWS spend across accounts.
- CUDOS Dashboard: Part of the Cloud Intelligence Dashboards framework, providing deep insights into AWS spend and usage across your entire organization.
- Build your own custom CloudWatch dashboard to explore specific areas of interest. For examples and AWS CloudFormation templates, refer to “Visualizing Amazon CloudWatch Costs – Part 1” and “Visualizing Amazon CloudWatch Costs – Part 2 – Where does the data come from?“.