AWS Cloud Operations Blog
Visualizing Amazon CloudWatch Costs – Part 1
Amazon CloudWatch monitors your AWS resources and the applications you run on AWS in real-time. You can use CloudWatch to collect metrics, logs, traces, set up alarms, create synthetic checks, and more. The information you collect lets you observe, validate, and alert on areas of interest to you.
In this two-part post, we’ll explore a CloudWatch dashboard that you can deploy into your own account to get a real-time view of some typical main contributors to CloudWatch costs: log ingestion, log storage, custom metrics, and selected metrics API calls. The dashboard is designed to help you identify high cost areas, and see the impact of any changes made over time.
This dashboard will let you:
- Identify the main log group(s) contributing to ingestion and storage costs.
- Identify the main metric API calls contributing to costs.
- Make decisions around the value of this data to decide if you want to reduce the volume/retention.
- See the impact of configuration changes made to reduce costs.
In this first post, we’ll describe the different sections of the dashboard, show what each part of the dashboard might look like, and offer some suggestions for cost optimization. We’ll also explain how to deploy this dashboard into your own account using an AWS CloudFormation template. In part 2, we’ll give an overview of how the data was gathered so that you can learn how to create something similar, or modify the widgets to suit your needs.
High-level cost view
Once deployed, the first section of this dashboard shows high-level cost information to help you identify the main areas contributing to the costs, and the size of that contribution, by account, region, and usage type.
The following figure shows a widget providing (from left to right):
- Costs per-account (including any linked accounts if deployed in a payer account).
- Costs per-region for the current account.
- Costs per-region and usage type for the current account.
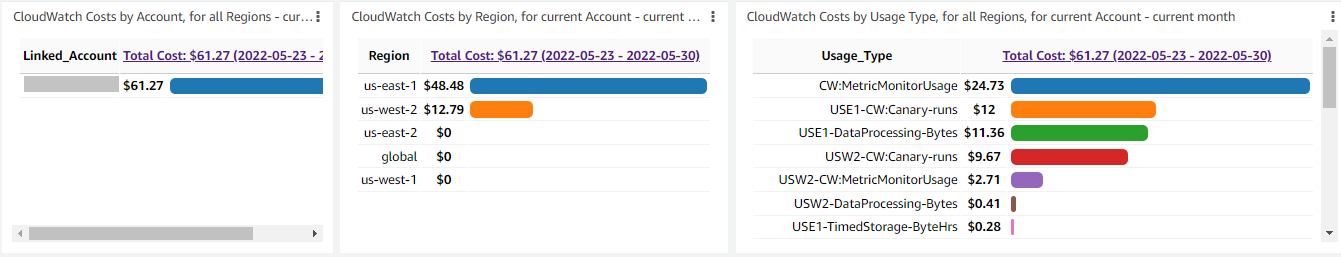
Figure 1: Account, Region, and Usage Type Widgets.
How do I use this data?
Use these high-level costs widgets to identify the account, region, and usage types that you’re interested in based on their impact on incurred costs. You can get more information from the remaining dashboard sections.
Note that the remainder of the dashboard focuses on the current account. Therefore, you must deploy the dashboard in the account of concern. The widgets show the data across all regions, so you can deploy the CloudFormation in any region.
The remainder of the dashboard will support your exploration into contributors in these areas (the related usage type is shown in bold):
- Log Event ingestion to CloudWatch Log Groups: <region>-DataProcessing-Bytes
- Log Group storage: <region>-TimedStorage-ByteHrs
- GetMetricData API call <region>-CW:GMD-Metrics
- Put Metric Data and Get Metric Statistics <region>-CW:Requests
If you want to see how the cost data changes over time, then you can see this in the AWS Cost Explorer console. To see only CloudWatch costs, choose to filter the Service to CloudWatch (AmazonCloudWatch). Then, you can use the appropriate Group by options of Linked Account, Region, or Usage Type.
Log ingestion – volume and events
This section of the dashboard shows data across all regions in the current AWS Account and shows log ingestion volume and the number of log events ingested. These are visualized as: a total volume/count for each region; a top 10 for log groups across all regions (as a pie chart over the last day); and top 10 log groups across all regions as a time chart over the time period of the dashboard. The following figure shows the log ingestion/volume widgets.
There are similar widgets on the dashboard for the number of log events ingested.
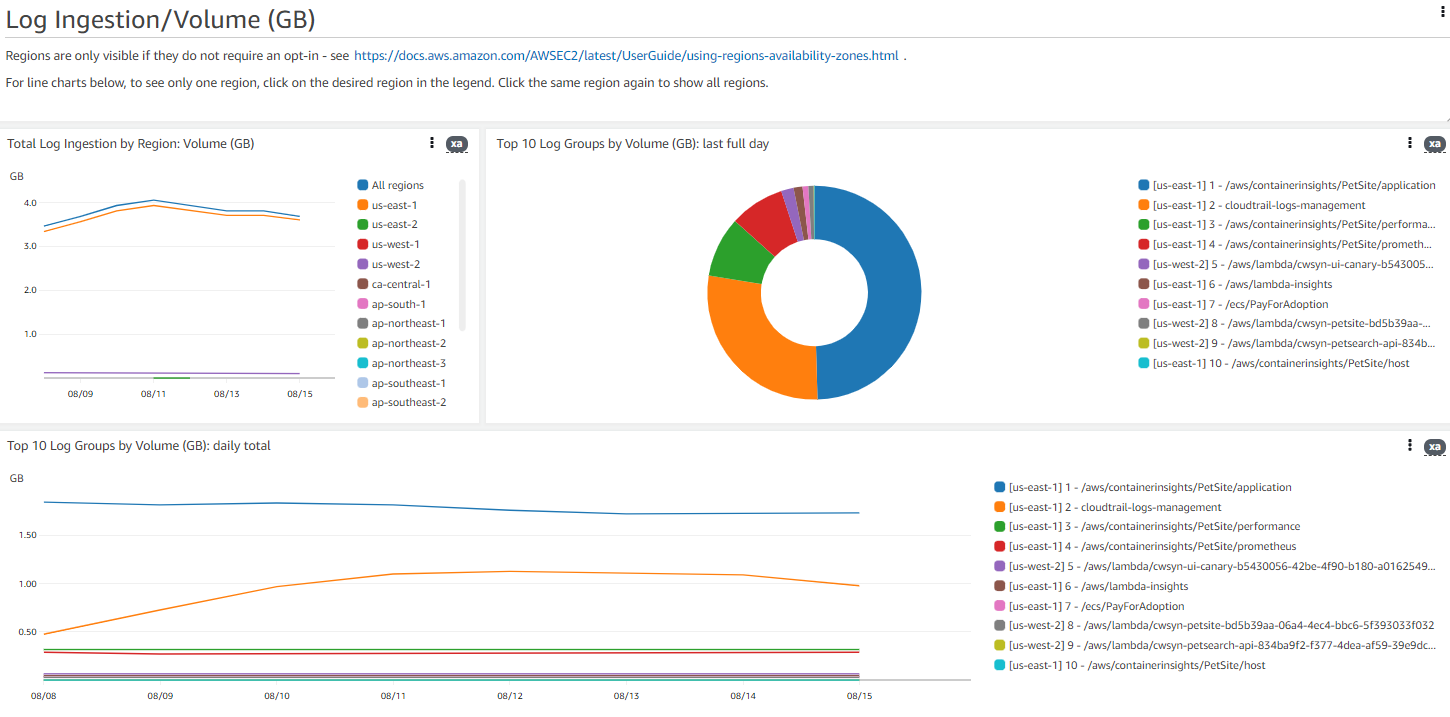
Figure 2: Log Ingestion Volume Widgets
How do I use this data?
These visualizations are designed to let you identify the top 10 log groups and their regions ordered by log ingestion volume. These widgets will let you see how these contributions have changed over time, and they’ll let you identify log groups with high event ingestion volume or event count. Whilst the number of events does not influence the cost of ingestion, log groups which are known to contain small events are often overlooked when reviewing usage, but might show a significant reduction by turning off the ingestion of some common log events.
To help interpret or further optimize this data, you may find it helpful to ask yourself the following questions:
- How much value and use do these logs have?
- Are these contributions in dev, test, or production? Are the logs used in all of these environments?
- Has there been a change in the log volume?
- Perhaps a change coincides with a recent deployment, or addition of a new service? Was this intentional? Is the data being logged useful?
- Are you making most use of the data?
- Is there a way we could make this log data more valuable, by leveraging a metric filter, a logs insights query, or a contributor insight rule?
In the case of log groups that are top contributors for event count, but not for ingest, it is likely that a large number of small events are being written. Although there is no charge for how often the Put Log Events API is called, it’s still possible for a high volume of small log events to build up over time. An increase in number of events may also be indicative of a change in log verbosity, or an ongoing issue.
Log storage
This widget shows the top 10 log groups in terms of the current log storage. You can see the log group name, the associated Log Volume, and the percent of the total log volume stored.
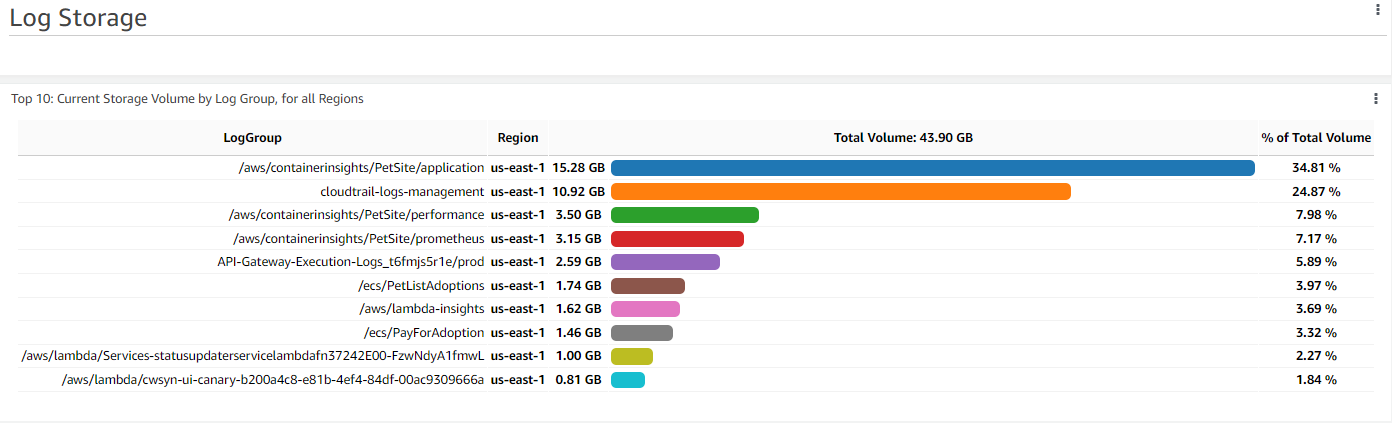
Figure 3: Log Storage by log group
How do I use this data?
This visualization is designed to let you identify the log groups with high volume of logs stored within CloudWatch. CloudWatch Logs storage is cheaper than log ingestion. However, there can still be an opportunity to reduce retention settings and save costs. We recommend that you check the retention settings on those log groups. Consider your retention needs in terms of troubleshooting, compliance, or your need to explore historic data/application behavior.
You can set/change the retention in different ways, including in the CloudWatch console under Log Groups, using put-retention-policy in the AWS Command Line Interface (AWS CLI), or in your CloudFormation when you specify your AWS::Logs::LogGroup resource.
Metric API calls
The next group of widgets show the most common cost contributors for Metrics, by region: GetMetricData, PutMetricData and GetMetricStatistics, and for the top 10 regional Metric API calls.
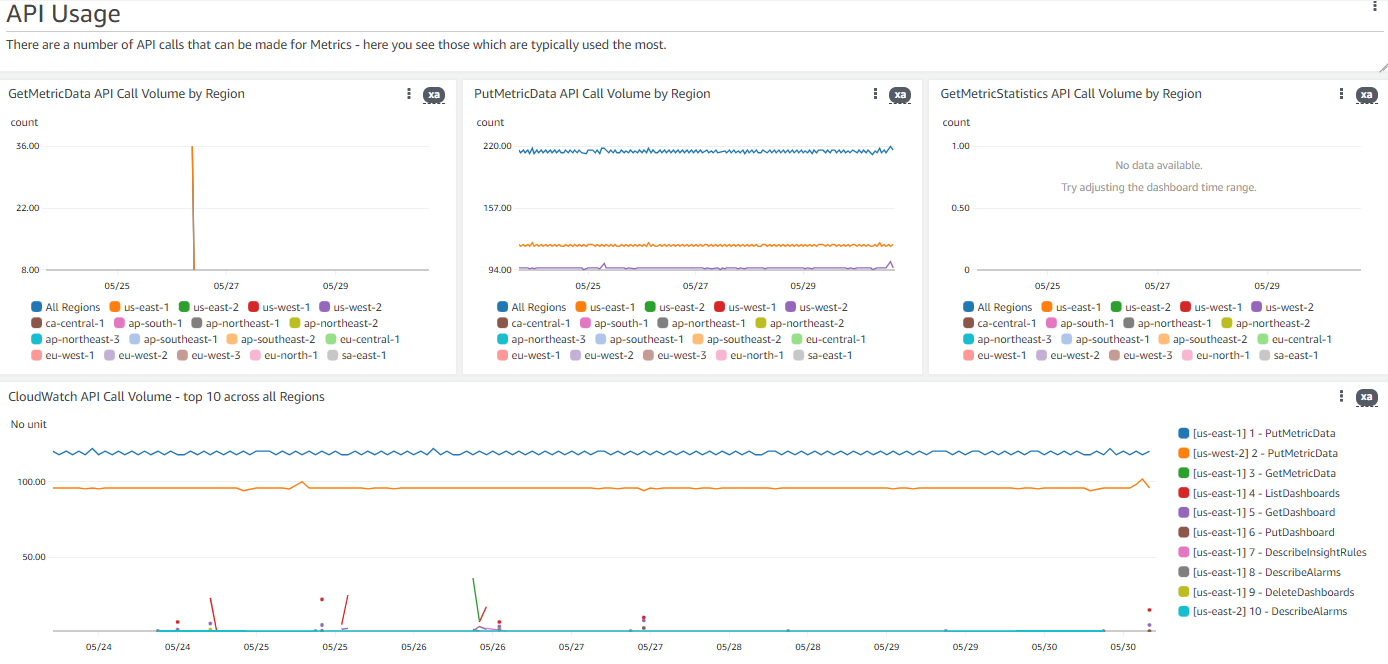
Figure 4: Metric API Usage
How do I use this data?
A high volume of GetMetricData API calls often comes from calls from third-party Observability tools using the CloudWatch Metrics in their platform (Observability tools such as New Relic, DataDog, Splunk, SumoLogic, AppDynamics, and others, as well as cloud financial tools like CloudAbility, CloudHealth, and others).
Consider which data is valuable to you, as well as the frequency of collection. Reducing the frequency of collection can result in a linear reduction in cost (i.e., reducing frequency from 1 min to 5 mins can result in 1/5th of the cost).
Deploying the dashboard
This dashboard and associated resources are available for you to deploy into your own AWS account as a CloudFormation template.
Prerequisites
To see the data High level cost view data, you must enable Cost Explorer in the console. After you enable Cost Explorer, it can take 24 hours for the current data to be available.
If you haven’t enabled Cost Explorer, then you’ll see an error message on the high level cost widgets: “Data is not available. Please try to adjust the time period. If just enabled Cost Explorer, data might not be ingested yet.”
What will the CloudFormation template deploy?
The CloudFormation template will deploy the following resources into the AWS account:
- CloudWatch dashboard (called CloudWatch-Costs-<stackname>)
- Resources for the Custom widgets used in the dashboard
- AWS Lambda functions
- CustomWidgetCostExplorerCloudWatch-js-<stackname>
- CustomWidgetLogStorageVolume-js-<stackname>
- AWS Identity and Access Management (IAM) role for Lambda
- <stackname>-LambdaIAMRole-<unique id>
- allows writing to CloudWatch logs, and access to the Cost Explorer and CloudWatch Log APIs.
- CloudWatch Log group for the Lambda functions
- normal naming convention, i.e., /aws/lambda/<function name>
- set to seven days retention
- created explicitly here so that they will be deleted with stack deletion
- AWS Lambda functions
Once deployed, the CloudWatch dashboard can be found in the CloudWatch console, under Dashboards > Custom dashboards > CloudWatch-Costs-<stackname>.
Once deployed, the dashboard will immediately be populated with existing data (none of the data visualized is specifically created for this dashboard).
How to deploy the CloudFormation template
- Download the yaml file.
- Navigate to the CloudFormation console in your AWS Account.
- Choose Create stack.
- Choose Template is ready, upload a template file, and navigate to the yaml file that you just downloaded.
- Choose Next.
- Give the stack a name (max. length 30 characters), and select Next.
- Add tags if desired, and select Next.
- Scroll to Capabilities at the bottom of the screen, and check the box I acknowledge that AWS CloudFormation might create IAM resources with custom names, and Create stack.
- Wait for the stack creation to complete.
- Navigate to the CloudWatch console > Dashboards.
- Select the dashboard called CloudWatch-Costs-<stackname>.
The first time that you view the dashboard you may see the following for some of the widgets – these are custom widgets that you must approve to run. Choose Allow always.
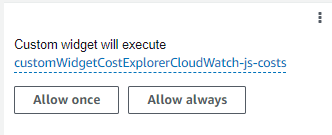
Figure 5: Allow Execution of Custom Widgets
Costs
There is a cost associated with using this CloudWatch dashboard because it utilizes custom widgets. Custom widgets run Lambda code, and in this case the Lambda functions make API calls. The cost should be minimal, but you should be aware.
All pricing details are on the Amazon CloudWatch pricing page.
Clean-up
If you decide that you no longer want to keep the dashboard and associated resources, then you can navigate to CloudFormation in the AWS Console, choose the stack (you will have named it when you deployed it), and choose Delete. All of the resources will be deleted.
Should you want to add the dashboard back in at any point, you can create a stack again from the CloudFormation yaml.
Conclusion
You can use this dashboard to get a better understanding of your CloudWatch costs. Use this data to identify cost drivers and optimize your CloudWatch usage to get the most value from the service.
Take this one step further by creating billing alarms, or alarms based on the more detailed metric data used in this dashboard, like log group ingestion. CloudWatch alarms can be based off of individual metrics or metric math, and can use either a static threshold or anomaly detection.
See how you can leverage custom widgets and metric math expressions to build more powerful dashboard to suit your needs.
Another way that you can get insights into your CloudWatch costs and usage is through the CUDOS Dashboard. CUDOS is part of the Cloud Intelligence Dashboards framework. Any customer can deploy the dashboards into their account to get deep insights into their AWS spend and usage across their entire organization. In the Monitoring and Observability tab, you can see CloudWatch spend-per-account, Usage Type Group and API operation together with resource level granularity, cost, and usage details for top 10 CloudWatch log resources.
In part 2, we’ll look at how these widgets were created so that you can learn how to create something similar, or modify the widgets to suit your needs.
&nbs;
About the authors: