AWS Cloud Operations Blog
Communicate monitoring information by sharing Amazon CloudWatch dashboards
Amazon CloudWatch provides you with data and actionable insights to monitor the health and performance of your infrastructure and applications hosted on AWS and on-premises servers. CloudWatch dashboards and alarms enable you to to rapidly detect performance issues that affect end user experience. CloudWatch has added the ability to share dashboards with users outside of your AWS account. Sharing dashboards is an easy and secure way for operators to communicate application and infrastructure health and performance data with technical and business audiences without having to provision AWS user accounts for all recipients. In this post I’ll show how to share CloudWatch dashboards, explain the use cases and the security and design considerations of this capability.
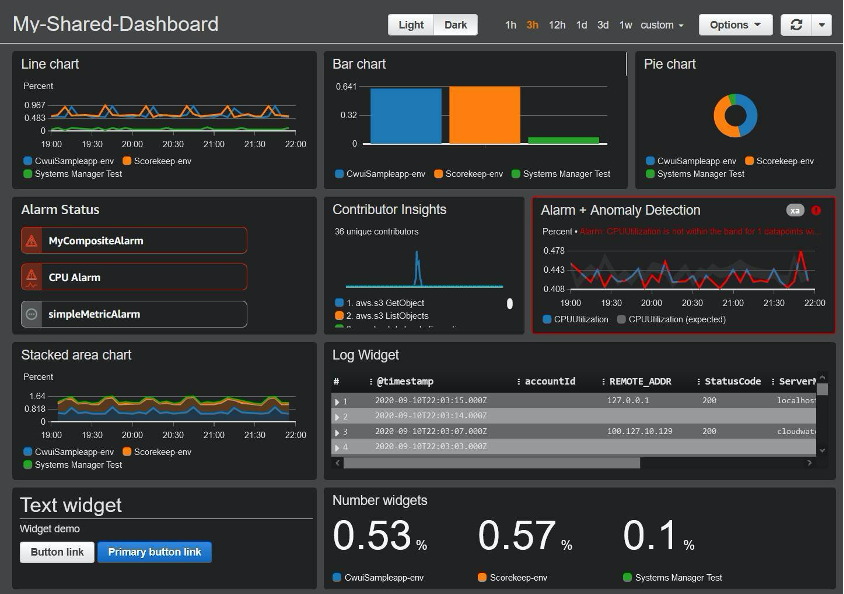
Dashboards display different visualizations or widgets for the data being shared. Figure 1 shows a dashboard with charts, alarms, logs, and Contributor Insights widgets. Other customizations include light or dark display mode and time periods for the data aggregation.

Figure 1: A sample Amazon CloudWatch dashboard
Use cases
Here are some of the benefits of sharing dashboards:
- You can communicate with a wide audience in a secure manner. You can design and share purpose-built dashboards on social media or wiki-like platforms with anonymous users while retaining control over the data visible on them.
- You can design and build custom dashboards suited for mobile and tablet devices.
- You can embed a custom dashboard in a webpage using the shared link.
- You can share custom dashboards with compliance and governance teams or organization owners in a multi-account environment.
- Application owners can design and share custom dashboards with operations teams (and vice versa) to convey the most important metrics required to monitor the health of their application. These dashboards are useful for network operations center (NOC) environments where multiple applications are monitored simultaneously.
- You can build and share dashboards with NOC teams to display on their TV screens. The teams can use the dashboards to detect performance issues and start the triage process.
- Because CloudWatch uses Amazon Cognito to store user information, you can set long session timeouts (up to 10 years) for dashboard observers. Longer sessions help consumers like the NOC teams who can now view dashboards without needing to sign in frequently.
Steps for sharing dashboards
The Dashboards page in the CloudWatch console displays a list of dashboards available in your account. Each dashboard has a Share option. If you select a dashboard to view, you can also use the Actions menu to share it.

Figure 2: Dashboard page in the Amazon CloudWatch console
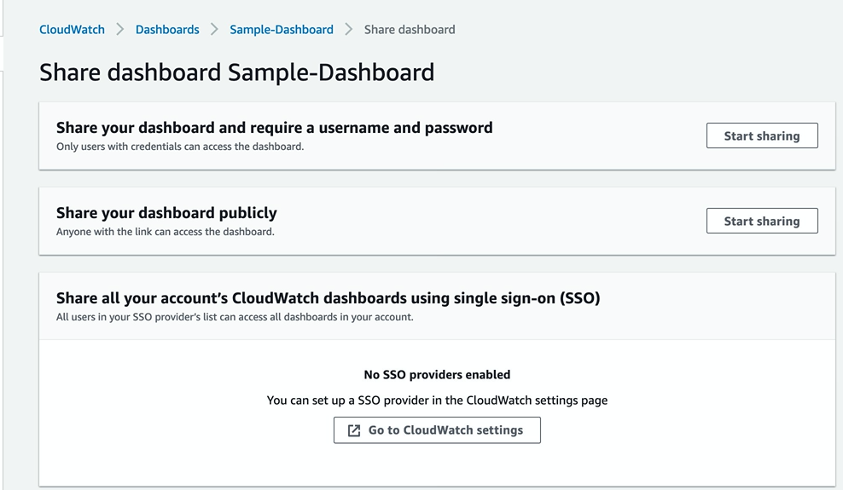
First, choose the audience that you want to share the dashboard with. Dashboard sharing is not permanent. You can stop sharing at any time.

Figure 3: Dashboard sharing options in the console
The console provides three sharing options:
- Share with user name and password. When you choose this option, the recipient receives an email notification with a user name and temporary password. For security reasons, the email notification does not contain a link to the shared dashboard. You must send that link to the user separately. The recipient must change the password when they first sign in to view the dashboard in their browser.
- Share publicly. This option gives dashboard access to anyone who has the dashboard URL. Be mindful of the contents of the dashboard widgets when you choose this option.
- Share with multiple accounts using single sign-on (SSO). Use this option to share a dashboard with all users in an SSO provider’s domain. This option reduces the user maintenance and security requirements involved in sharing information publicly.
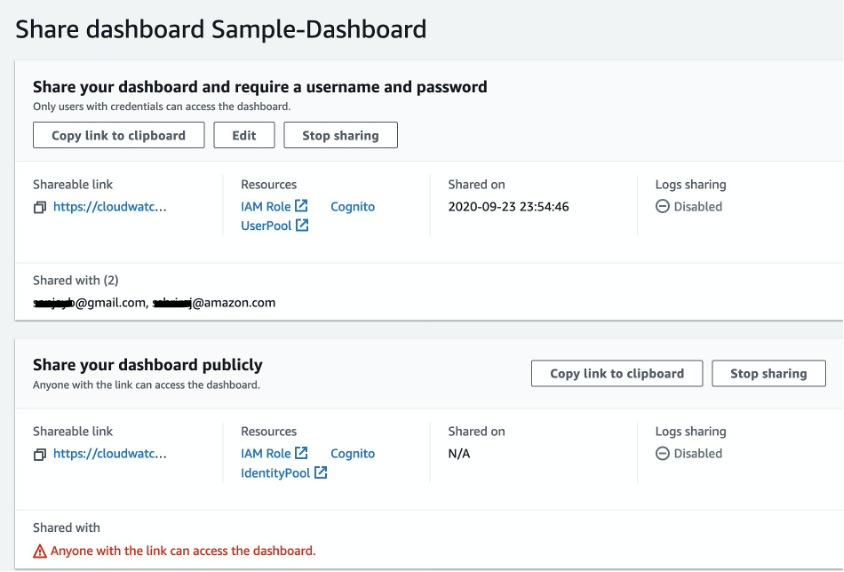
The status of shared dashboards is updated when you’re done sharing. In Figure 3, you can see buttons to edit sharing permissions and stop sharing. The figure also shows that a dashboard has been shared with two email addresses.

Figure 4: Sample dashboard section shows shareable link, resources, and other detail
Security considerations
Before you share dashboards with external audiences, be aware of these security considerations.
Each dashboard sharing action creates an IAM service role (CloudWatchDashboard-ReadOnlyAccess–DashboardName–Identifier). The role has a policy of the same name attached. It provides read-only access to CloudWatch and Amazon Elastic Compute (Amazon EC2). You can review the policy by clicking the IAM Role link in each shared dashboard page. It’s important to familiarize yourself with the policies before sharing.
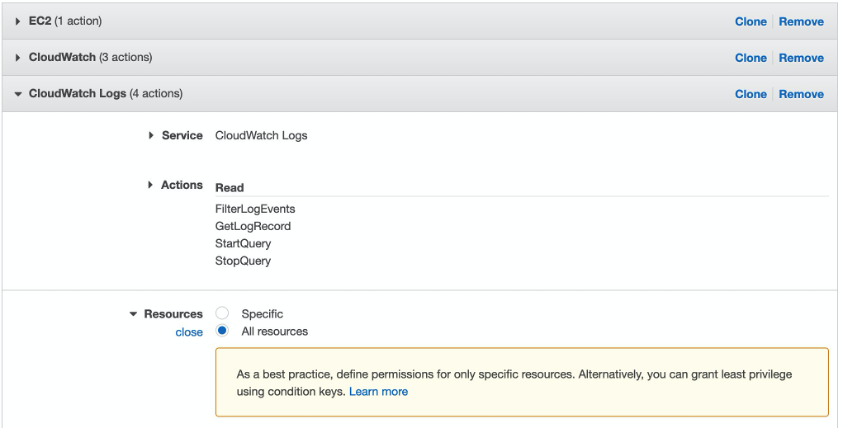
By default, the sharing of log widgets is disabled. This means that the widgets do not appear on shared dashboards. Sharing dashboards that contain CloudWatch Logs Insights widgets could reveal confidential information if the log file contents expose such information. If you enable log sharing, the IAM service policy attached to the sharing role contains read permissions for the FilterLogEvents, GetLogRecord, StartQuery, and StopQuery API actions.

Figure 5: Expanded Amazon CloudWatch Logs permissions in IAM console
The default policy applies to all CloudWatch Logs groups. You can edit the policy so that it applies only to the log groups that you want visible on your shared dashboard.
Design considerations
Sharing dashboards expands the audience you can communicate with. Custom dashboards make it possible to create interesting data sets for your target audience. It’s important to consider the information that will be helpful to your audience.
Dashboards consist of a 24-unit (column) grid. The default width of a widget is 6 units. Dashboards that are intended to be viewed on mobile devices are most usable if the widgets are 24 units wide.
Dashboard data is refreshed at one-minute intervals. Although you can change this to refresh at a 10-second interval, keep in mind that the performance data might not change as frequently. For more information about data aggregation and refresh rates, see the Amazon CloudWatch User Guide.
Conclusion
In this post, I described the new Amazon CloudWatch dashboard sharing capability and its communication benefits to a broad audience. I also shared security considerations to help you retain control over the shared data and the design considerations for a great end user experience.
You can review the CloudWatch Dashboards documentation in the Amazon CloudWatch User Guide for details on creating dashboards. A detailed walk-through of displaying alarms and will help you design dashboards more effectively. Think of an audience that you want to share performance data with, and start creating a dashboard you can share with them.
About the author
 Sanjay Bhatia is an Enterprise Support lead for Global Accounts at AWS. Based in the Bay Area, Sanjay works with a global team to help AWS customers operate their workloads efficiently and frugally on AWS. Sanjay has helped a diverse set of customers design and operate a broad variety of workloads using AWS Services and has a keen interest in Performance Management solutions.