AWS Cloud Operations Blog
Introducing Amazon CloudWatch Omni: Observability for the AI Era
An AI-powered observability experience for AI agents and applications, built on open standards and delivered outside of the AWS Console.
Organizations are handing agents the keys to their day-to-day operations, from resolving support tickets and managing infrastructure to approving expenses, shipping production code, and increasingly the long tail of workflows that keep the business running. IDC expects more than 1 billion actively deployed AI agents by 2029, executing roughly 217 billion actions a day (Source: IDC Blog, Agentic AI is critical infrastructure, March 2026). At that scale, agents stop being a productivity layer and become part of the operating core, and that means accepting a new bar: the agent must be trustworthy and reliable from day one. But AI agents don’t fail the way traditional software does. The same input can produce different tool calls, different reasoning paths, and different outputs on every invocation. Latency and error rates don’t reliably indicate hallucination or toxicity. Traditional monitoring can confirm if the agent ran, not whether it reasoned correctly, so customer trust erodes quietly yet quickly while every metric stays green.
Meanwhile, the applications these agents interact with have grown more distributed, built across multiple languages, frameworks, and clouds. Operations teams juggle dozens of disconnected consoles for logs, metrics, and traces. Diagnosing a production issue means context-switching between tools, mentally correlating signals that were never designed to connect, and hoping you piece together the full picture before customers notice. We hear this consistently from customers: the tooling hasn’t kept pace with how applications are actually built and run today.
We see these as converging problems. Agents call APIs, depend on services like Amazon Bedrock, Amazon S3, and third-party endpoints, and run on infrastructure that has its own failure modes. When something breaks, the root cause might be the agent’s reasoning, a stale knowledge base, or a latency spike in a downstream database three layers removed. Today, diagnosing that means switching between an agent tracing tool, an APM console, and an infrastructure dashboard that shares no data. The question isn’t just “is it up?” but “why did it do that, and what caused it?” That’s why we built Amazon CloudWatch Omni.
“Capital One operates one of the largest observability footprints in financial services. As a design partner for Amazon CloudWatch Omni, we helped shape a single AI-powered observability solution that will give our engineers topology-aware intelligence and natural-language querying across all telemetry from a single surface, with full data ownership through OpenTelemetry. It’s a fundamentally different operating model for AIOps and resilience at scale.”
— Parvez Naqvi, Managing Vice President, Cloud Platform & Resilience Engineering, Capital One
What is Amazon CloudWatch Omni?
CloudWatch is the foundation of how teams operate on AWS – it processes trillions of observability signals daily for millions of active customers across every industry and region. Amazon CloudWatch Omni is the next generation of CloudWatch: unified observability bringing your applications and the AI agents running alongside them into one reimagined off-AWS console experience, with auto-discovered topology, natural language and SQL queries, and AI-guided investigation powered by AWS DevOps Agent across both.
CloudWatch Omni helps address some of the biggest observability challenges teams face today:
Ship agents you can trust: Eval-driven observability that answers “why did my agent do that?”, not just “is it running?” Developers trace agent behavior, evaluate quality continuously, and run experiments to validate fixes before they ship. Omni works across agents built across frameworks (CrewAI, LangGraph, OpenAI Agents SDK, Strands, Vercel AI SDK, and more) and meets developers where they already work: an Omni IDE extension for VS Code, Cursor, and Kiro, plus a dedicated Omni web experience for production.
See applications as customers do: Understand applications as your customers see them, not as disconnected resources. You work in an Omni space (a workspace built around an application, team, or set of workloads), where everything organizes around your services, user journeys, and business transactions, with auto-discovered topology, fleet dashboards, golden metrics, and native alerting in one place. It ingests application and agent telemetry from Azure today, with other cloud providers coming soon.
Correlate across the full stack: Agents call APIs, depend on services, and run on infrastructure. When something breaks, the root cause might be the agent’s reasoning, a stale knowledge base, or a latency spike in a downstream service. Omni is built on the CloudWatch unified data store (the telemetry store already trusted by millions of customers), so it correlates agent behavior to application health to infrastructure in one experience.
Investigate with AI: Intelligence runs through the whole Omni experience. Rather than starting from a dashboard you built and maintained, you engage with your telemetry however suits the moment: natural-language chat in the console, a guided point-and-click path through the signals that matter most, or directly from your tool of choice using AWS Agent Toolkit plugins. Ask a question in natural language and the built-in AI assistant finds the relevant telemetry, builds dynamic views of the signals you care about, and helps you get to the root cause. Native AWS DevOps Agent, an AI agent that investigates operational issues, automatically correlates data and identifies the root cause across agents, applications, and infrastructure.
Work in one place: Omni shifts your day from hunting across tools and switching context to asking questions and resolving incidents in a single experience. It lives outside the AWS Console entirely with its own UI and access model: a dedicated web experience for operators and a native IDE extension for VS Code, Cursor, and Kiro, so developers see agent traces the moment they run locally.
“At Sony, our enterprise-wide agentic AI platform is now supporting hundreds of proof-of-concept and production workloads. At this scale, observability and evaluation are essential. With Amazon CloudWatch Omni, I can go from a single trace straight to evaluation, AI analysis, comparison, or dataset creation, it’s all right there. The ability to create a dataset from live traces with a single click was especially impressive. Assembling datasets for evaluations is often a bottleneck on the business side, and being able to create them directly from traces significantly lowers that barrier. Additionally, being able to work within my development environment seamlessly across local and cloud data made the whole experience very easy to use.”
— Masahiro Oba, Senior General Manager of AI Acceleration Division, Digital & Technology Platform, Sony Group Corporation
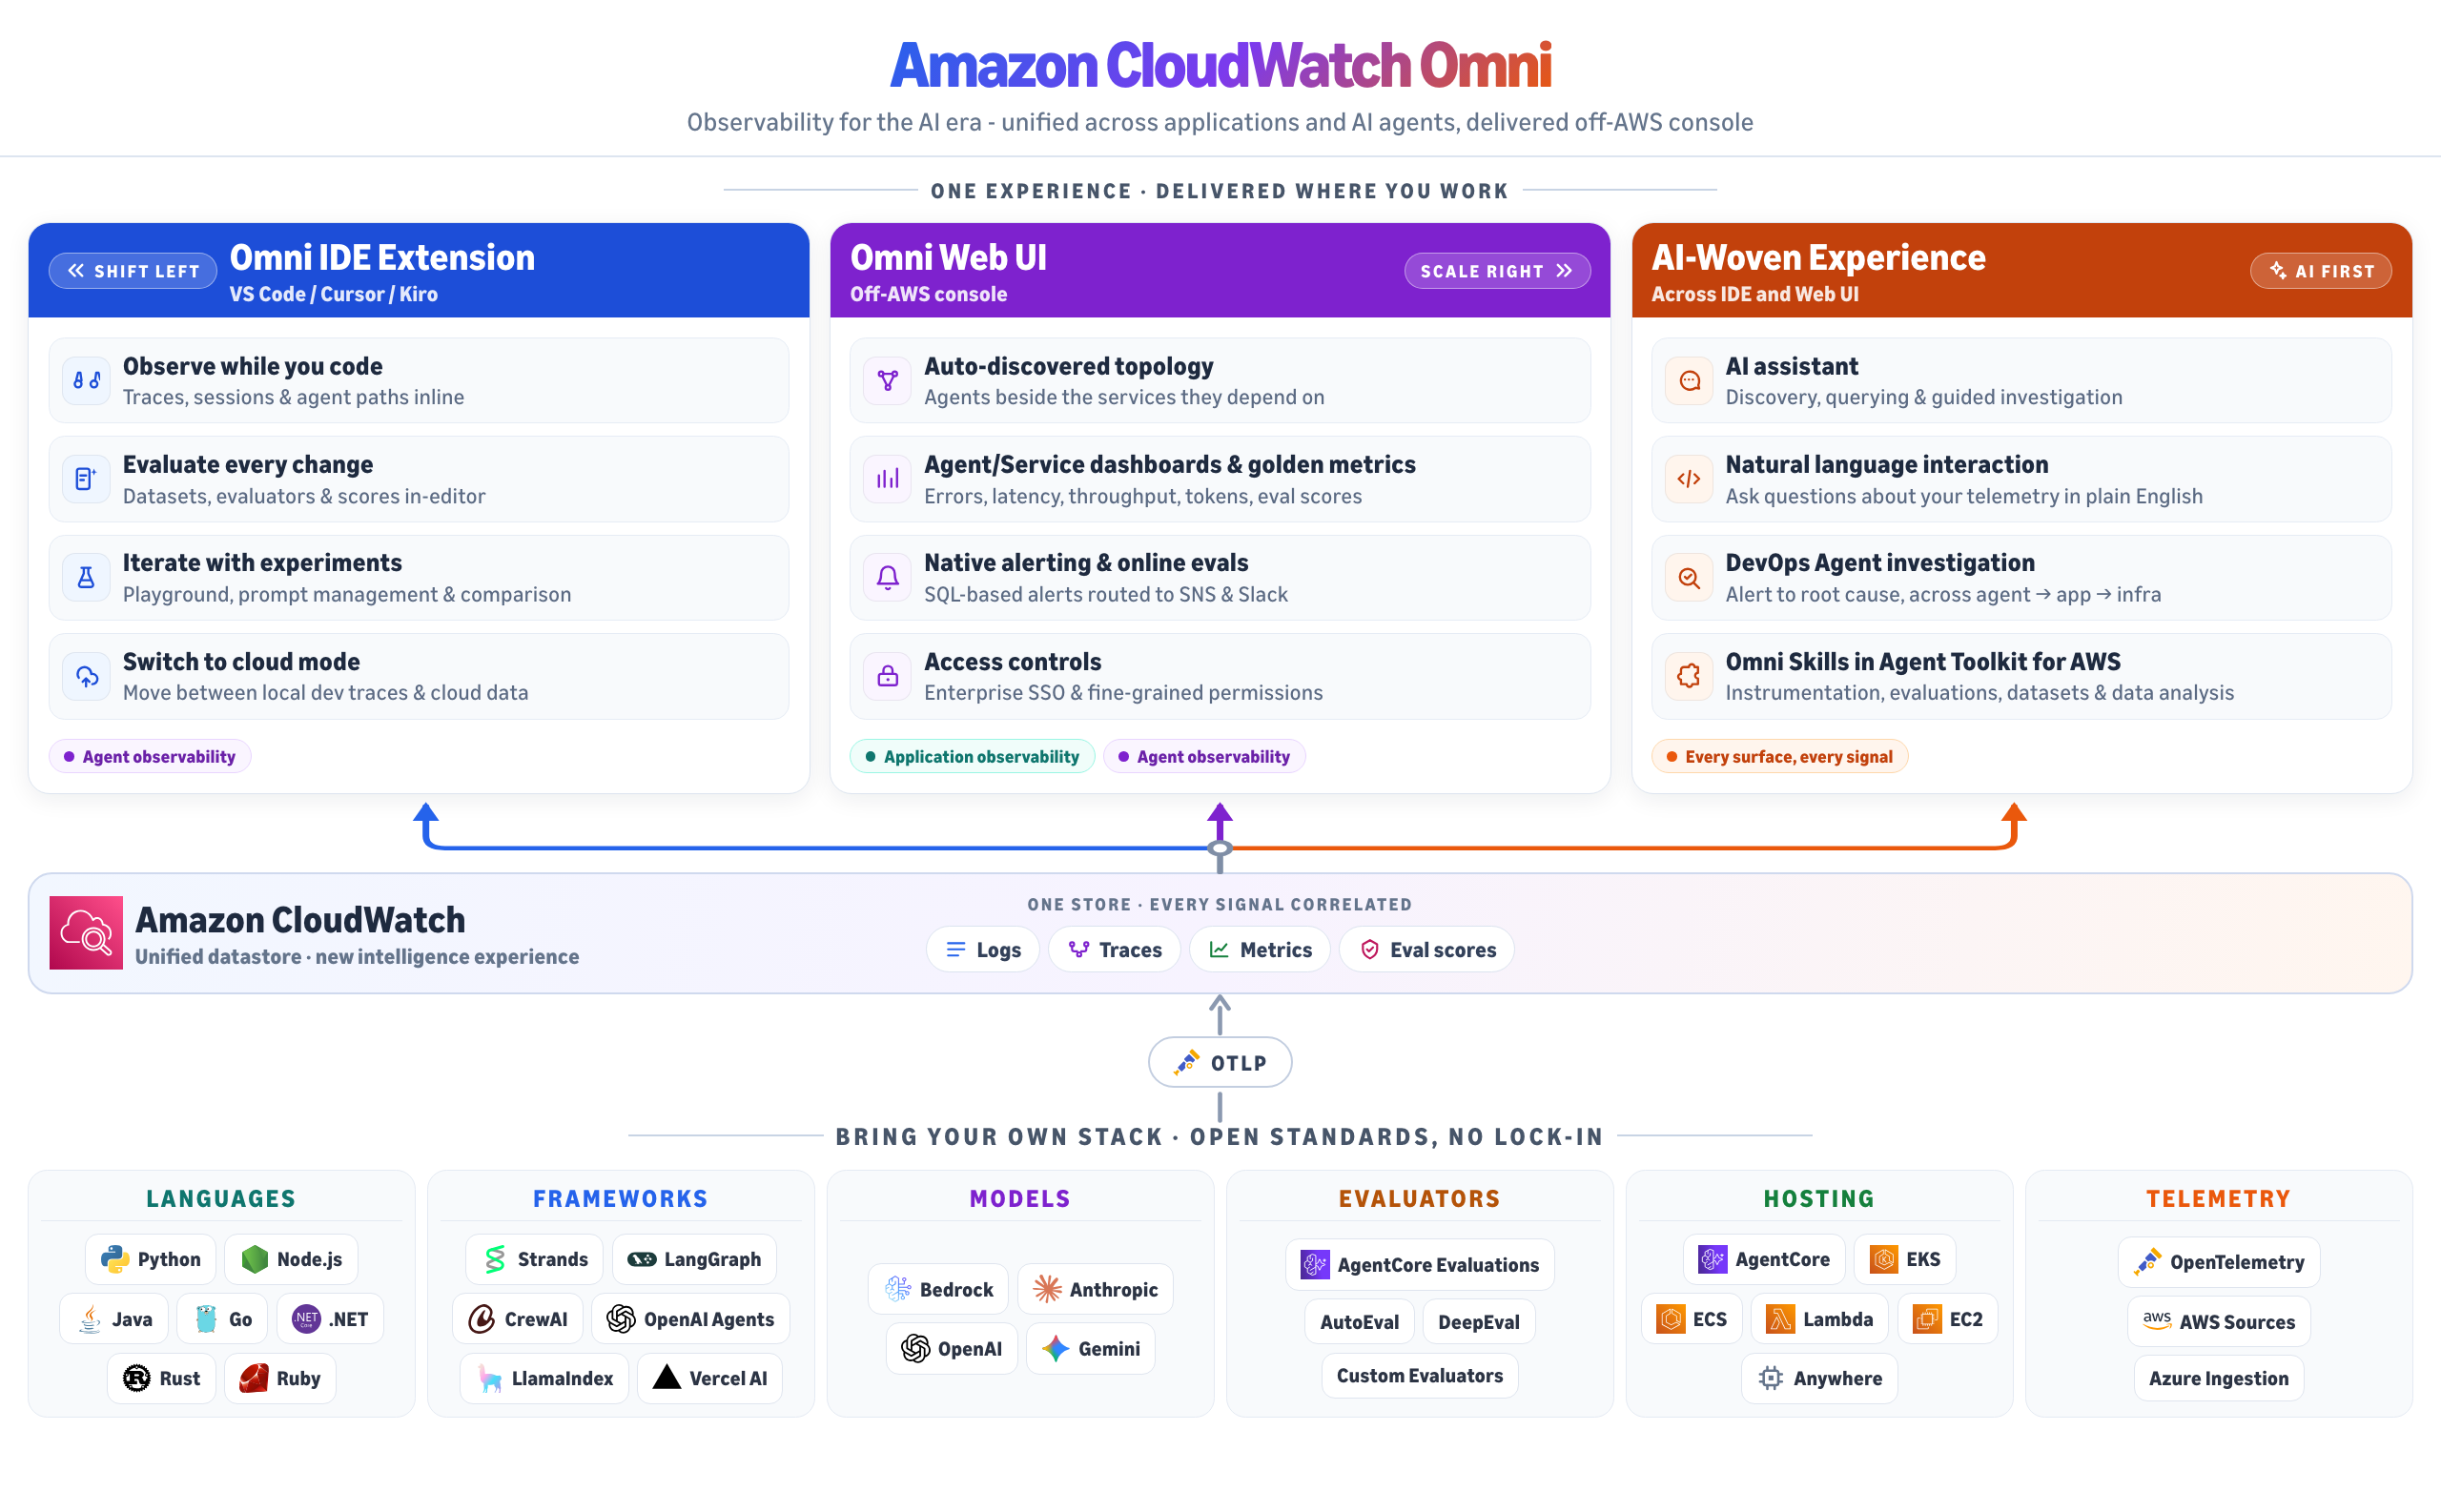
Figure 1: Introducing Amazon CloudWatch Omni, the next generation of CloudWatch.
For developers, that means staying in your workflow. For operators, it means the end of screen-hopping. And to help you get started, we’ve kept CloudWatch Omni pricing refreshingly simple: you pay for the telemetry you send and store, dashboards and alerts come at no additional charge, query volume up to 5× your monthly ingestion is free, and every eligible account starts with a 30-day free trial and $1,000 in credits toward OTel telemetry ingestion.
How it works
Close the loop from broken agent to validated fix
When an agent’s output isn’t meeting your quality bar, CloudWatch Omni gives you a structured path from diagnosis to validated improvement. Trace your agent and see every prompt, model call, tool invocation, and sub-agent interaction in a single timeline, then work the eval-driven loop without leaving the workflow:
- Diagnose: Open the flagged trace in the playground to try a different prompt or model config against real data
- Score: Run evaluators to score correctness, coherence, retrieval quality, and tool selection
- Compare and ship: Put the new version side by side against a dataset built from production traffic and ship the variant that scores higher with no regressions
- Watch: set those evaluators to run continuously against live traffic so you catch quality degradation before customers do.
The whole cycle runs in one place, each step feeding the next.
CloudWatch Omni works across frameworks (LangGraph, CrewAI, OpenAI Agents SDK, Vercel AI SDK, Strands, and more). A native extension for VS Code, Kiro, and Cursor surfaces traces the moment you run your agent locally, while operators work from an off-AWS console web experience with enterprise SSO. Both surfaces share one data layer, so when an operator spots a regression, a developer opens that exact trace in their IDE and starts fixing it.
Teams building on Amazon Bedrock AgentCore, our managed platform for building, deploying, and scaling AI agents, get observability in CloudWatch Omni automatically. If you already use AgentCore Observability (the built-in telemetry for agents running on the AgentCore runtime), Omni carries your existing instrumentation forward and extends it into your IDE and Omni web UI. AgentCore’s built-in evaluators for retrieval quality, tool selection, guardrail enforcement, and memory coherence are available in Omni out of the box and teams using independent evaluation tools like AutoEval and DeepEval can bring those evaluators into CloudWatch Omni directly and keep their existing investment.
When an agent produces a bad result, the cause can live anywhere in the chain, and in CloudWatch Omni agent traces and application telemetry share one data layer so you can follow it. The agent’s decision (“called tool X, got a bad result”) connects to the application signal (“that API returned an error because the backing service hit a capacity limit”) connects to the infrastructure metric (“the database connection pool was exhausted”), and you follow the thread from top to bottom in one investigation.
See your applications as your customers see them
CloudWatch Omni auto-discovers your application topology and organizes telemetry around services, dependencies, and the traffic flowing between them. You start from the application as a whole, then drill into the specific service, trace, or log line that matters. For existing CloudWatch customers, the path is immediate. Telemetry you already send to CloudWatch (logs, metrics, and traces) becomes available in Omni through a unified data store that enables correlated analysis across all signal types, with no reconfiguration required. Your existing instrumentation, dashboards, and alarms carry forward, and Omni extends what you already have into a new, application-centric experience. For teams new to CloudWatch, onboarding is just as straightforward: send telemetry via OpenTelemetry (OTLP) endpoints, create a CloudWatch Omni space, and Omni auto-discovers your topology and begins surfacing dependencies and health signals immediately.
Omni’s built-in AI assistant lets you describe what you’re seeing in natural language, then identifies anomalies, suggests hypotheses, and walks you through the investigation. Unified search lets you query across logs, metrics, and traces in one place using natural language or SQL. Alerts trigger on conditions across any signal type, and Slack and GitHub integrations route those signals to your team where they already work. CloudWatch Omni supports ingesting application and agent telemetry from Azure environments today, with deeper multi-cloud observability coming soon. Org-level domains, enterprise SSO, and fine-grained permissions mean your entire organization onboards through one setup, with each person seeing data scoped to their role.
Getting started
Agent developers: Install the CloudWatch Omni extension from the VS Code Marketplace (free, no AWS account needed for local development), or download the extension from Open VSX, instrument your agent via OTLP, if you’re using Kiro or Cursor, and run it to explore traces, evaluations, and experiments right away. Get started with Get started with agent observability.
Application teams: Create a CloudWatch Omni space to organize your services and team access. If you already use CloudWatch, your logs, metrics, and traces are there with zero reconfiguration. If you’re starting fresh, send telemetry via OTLP and Omni auto-discovers your topology and health signals immediately. Get started with application observability in Omni and check out our documentation.
What comes next
CloudWatch Omni gives your team the visibility to understand both your agents and your applications, and the workflows to make them better, in one experience.
This is just the beginning. We’re expanding multi-cloud coverage so the observability follows wherever your infrastructure runs, building toward proactive operations that catch issues before they become incidents, and deepening agent workflows so the path from detection to fix takes less manual effort. That’s where we’re taking CloudWatch: one experience for agents, applications, and infrastructure, across clouds, with AI woven into every workflow.
Join our webinars to see Omni in action: on Oct 7, 2-3 pm ET (GMT-5), or Oct 7, 9-10 am Singapore time (GMT+8), or Oct 8, 2:30-3:30 pm BST (GMT+1).
Source: IDC Blog, Agentic AI is critical infrastructure, March 2026