AWS Cloud Operations Blog
Monitor Private VPC Endpoint Health in Hybrid DNS Environments Using CloudWatch Synthetics
We start by paying homage to the Amazon CloudWatch Synthetics canary naming convention, which nods to the original use of canaries to detect carbon monoxide in coal mines. The bird’s small size, high metabolism, and intensified breathing led to their early demise when exposed to the poisonous gas, thereby allowing miners to take corrective action before succumbing themselves. Aptly named, CloudWatch Synthetics canaries now let us detect customer experience and security challenges before our customers are directly impacted.
Canaries are configurable Node.js or Python scripts that let you monitor your REST API, URL, and website content on a recurring schedule, as they trace the same routes and conduct the same actions as your typical end-user. Continuous evaluation of endpoint availability and latency verifies your expected customer experience, either utilizing pre-built canary blueprints or custom scripts you’ve written.
To further actualize the CloudWatch Synthetics canary value, we will explore a real-world customer use-case, implementation strategy, and adoption outcome. Our spotlight customer supports an internal title search solution allowing analysts to evaluate ownership and claims on a real estate asset before a transaction involving the asset can occur. Their solution leverages a set of underlying microservices exposed via Amazon API Gateway. This requires a method for configuring cross-region disaster recovery (DR) traffic swings based on the health of their private API Gateway Endpoints within a hybrid DNS environment, where their REST APIs can only be accessed from their Amazon Virtual Private Cloud (VPC) using VPC interface endpoints.
Solution Overview
With private Amazon API Gateway Endpoint health as our air quality, and 4XX/5XX status codes as our indicator of dangerous gases, the following solution details out how to create and configure CloudWatch Synthetics canaries in order to monitor VPC Endpoint Health with hybrid DNS enabled between on-prem and AWS.
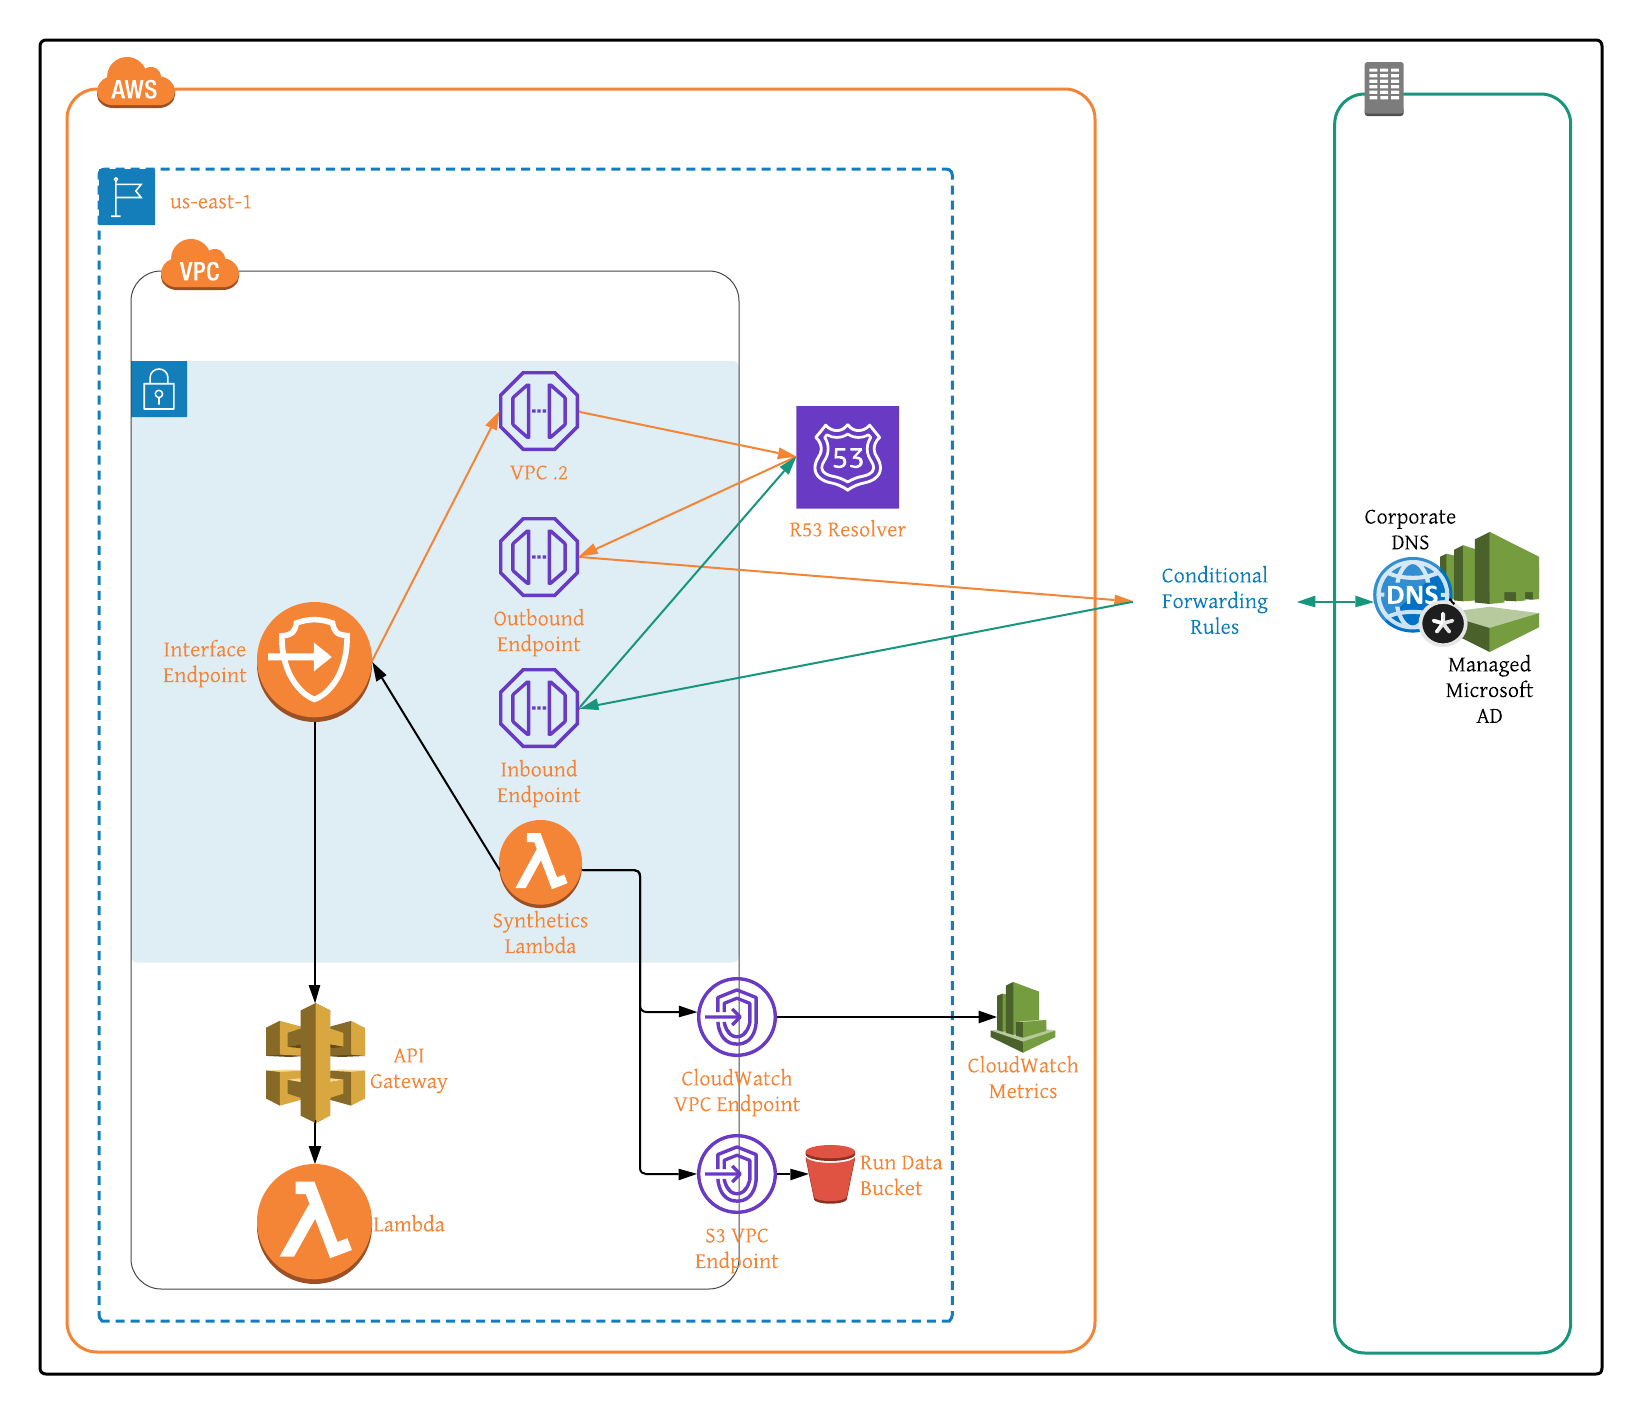
Figure 1: Architecture Overview of Amazon API Gateway VPC Interface Endpoints in Hybrid DNS Environment.
Customer Use Case
To move from their historically monolithic architecture over to a microservice-based approach, our spotlight customer chose a fully-serverless design utilizing Amazon API Gateway with an AWS Lambda backend. While highly available and scalable, the serverless architecture does not natively consider every aspect of a well thought out DR strategy. In building their serverless infrastructure and standardizing on Amazon API Gateway, we identified four chief metrics requiring monitoring to ensure optimal and resilient API performance.
The presence of 4XX status codes generally indicates that the request for the customer-owned resource contains bad syntax, presumably due to the requester. To account for client-side errors, such as missing or incorrect authentication headers, we monitored the clients’ HTTP requests and resulting 4XX status codes. CloudWatch Synthetics canary scripts let you specify an acceptable limit, signaling when the number of issues exceeds your defined threshold within a given window.
In addition to client-side errors, 5XX response codes can indicate server-side errors, like an endpoint timeout or potential bug. As with 4XX responses, we can generally tolerate 5XX responses within a reasonable and defined limit. However, more errors than our defined limit over a sustained time period is concerning. Thankfully CloudWatch Synthetics canary scripts also let us configure our server-side error threshold, similar to how we did with client-side errors.
The third metric utilized for monitoring API Gateway health was request count. This includes requests resulting in both successful and error responses. Helpful for monitoring the costs associated with API Gateway (billed based on the number of per million requests per month), request count let us pinpoint bugs in application code that resulted in erroneous requests or even retries to a specific endpoint. Permission challenges can also be identified when the request count is close to or equal to zero. This means that the application code calling the API Gateway endpoint is malfunctioning.
Finally, API Gateway request latency, the elapsed time between your API receiving and responding to a request, let us ensure business-defined SLA requirements were met. Higher latency can point to application code bugs or issues with the underlying transport. To discern where the request latency originates from, CloudWatch Synthetics canaries let us measure both the resulting time it takes your API endpoint to return, and the round-trip time for the request. The closer these two values, the more likely that the source code is the issue, while greater disparity indicates an infrastructure challenge.
In our case, when any of the above metrics fell outside of specified lower or upper bound parameters, we manipulated routing in order to send traffic for a given API Gateway endpoint to its secondary counterpart within another region, while also alerting our administrator to the apparent application challenge. Closed-loop automation let us minimize impact to our end-users, while detailed error reporting presented the opportunity to make changes to application code, thereby mitigating the risk of similar future challenges.
Solution Implementation
Our solution is in 3-parts:
- Monitoring VPC Interface Endpoint Health with CloudWatch Synthetics Canaries.
- Enabling Hybrid DNS Between On-Prem and AWS.
- Subsequently Testing Canary Run Metrics Within Hybrid DNS Environment.
Part A: Monitoring VPC Interface Endpoint Health with CloudWatch Synthetics Canaries
Step 1: Create Private API Gateway Endpoint.
Step 2: Create VPC if one is not already configured, and then note the VPC ID, private subnet IDs, and security group IDs for later use when configuring the Synthetics canary.
Step 3:
- If VPC has internet access enabled, then create NAT Gateway and add it to VPC and skip to Step 4.
- If VPC does not have internet access enabled, then follow the steps below:
- Create S3 VPC Endpoint to store Synthetics canary run data and create CloudWatch VPC Endpoint with com.amazonaws.region.monitoring as the service name in order to collect Synthetics canary run metrics.
- Enable VPC DNS resolution and hostnames.
Step 4: Launch your CloudWatch Synthetics Canary CloudFormation Stack by selected ‘Launch Stack’ below:

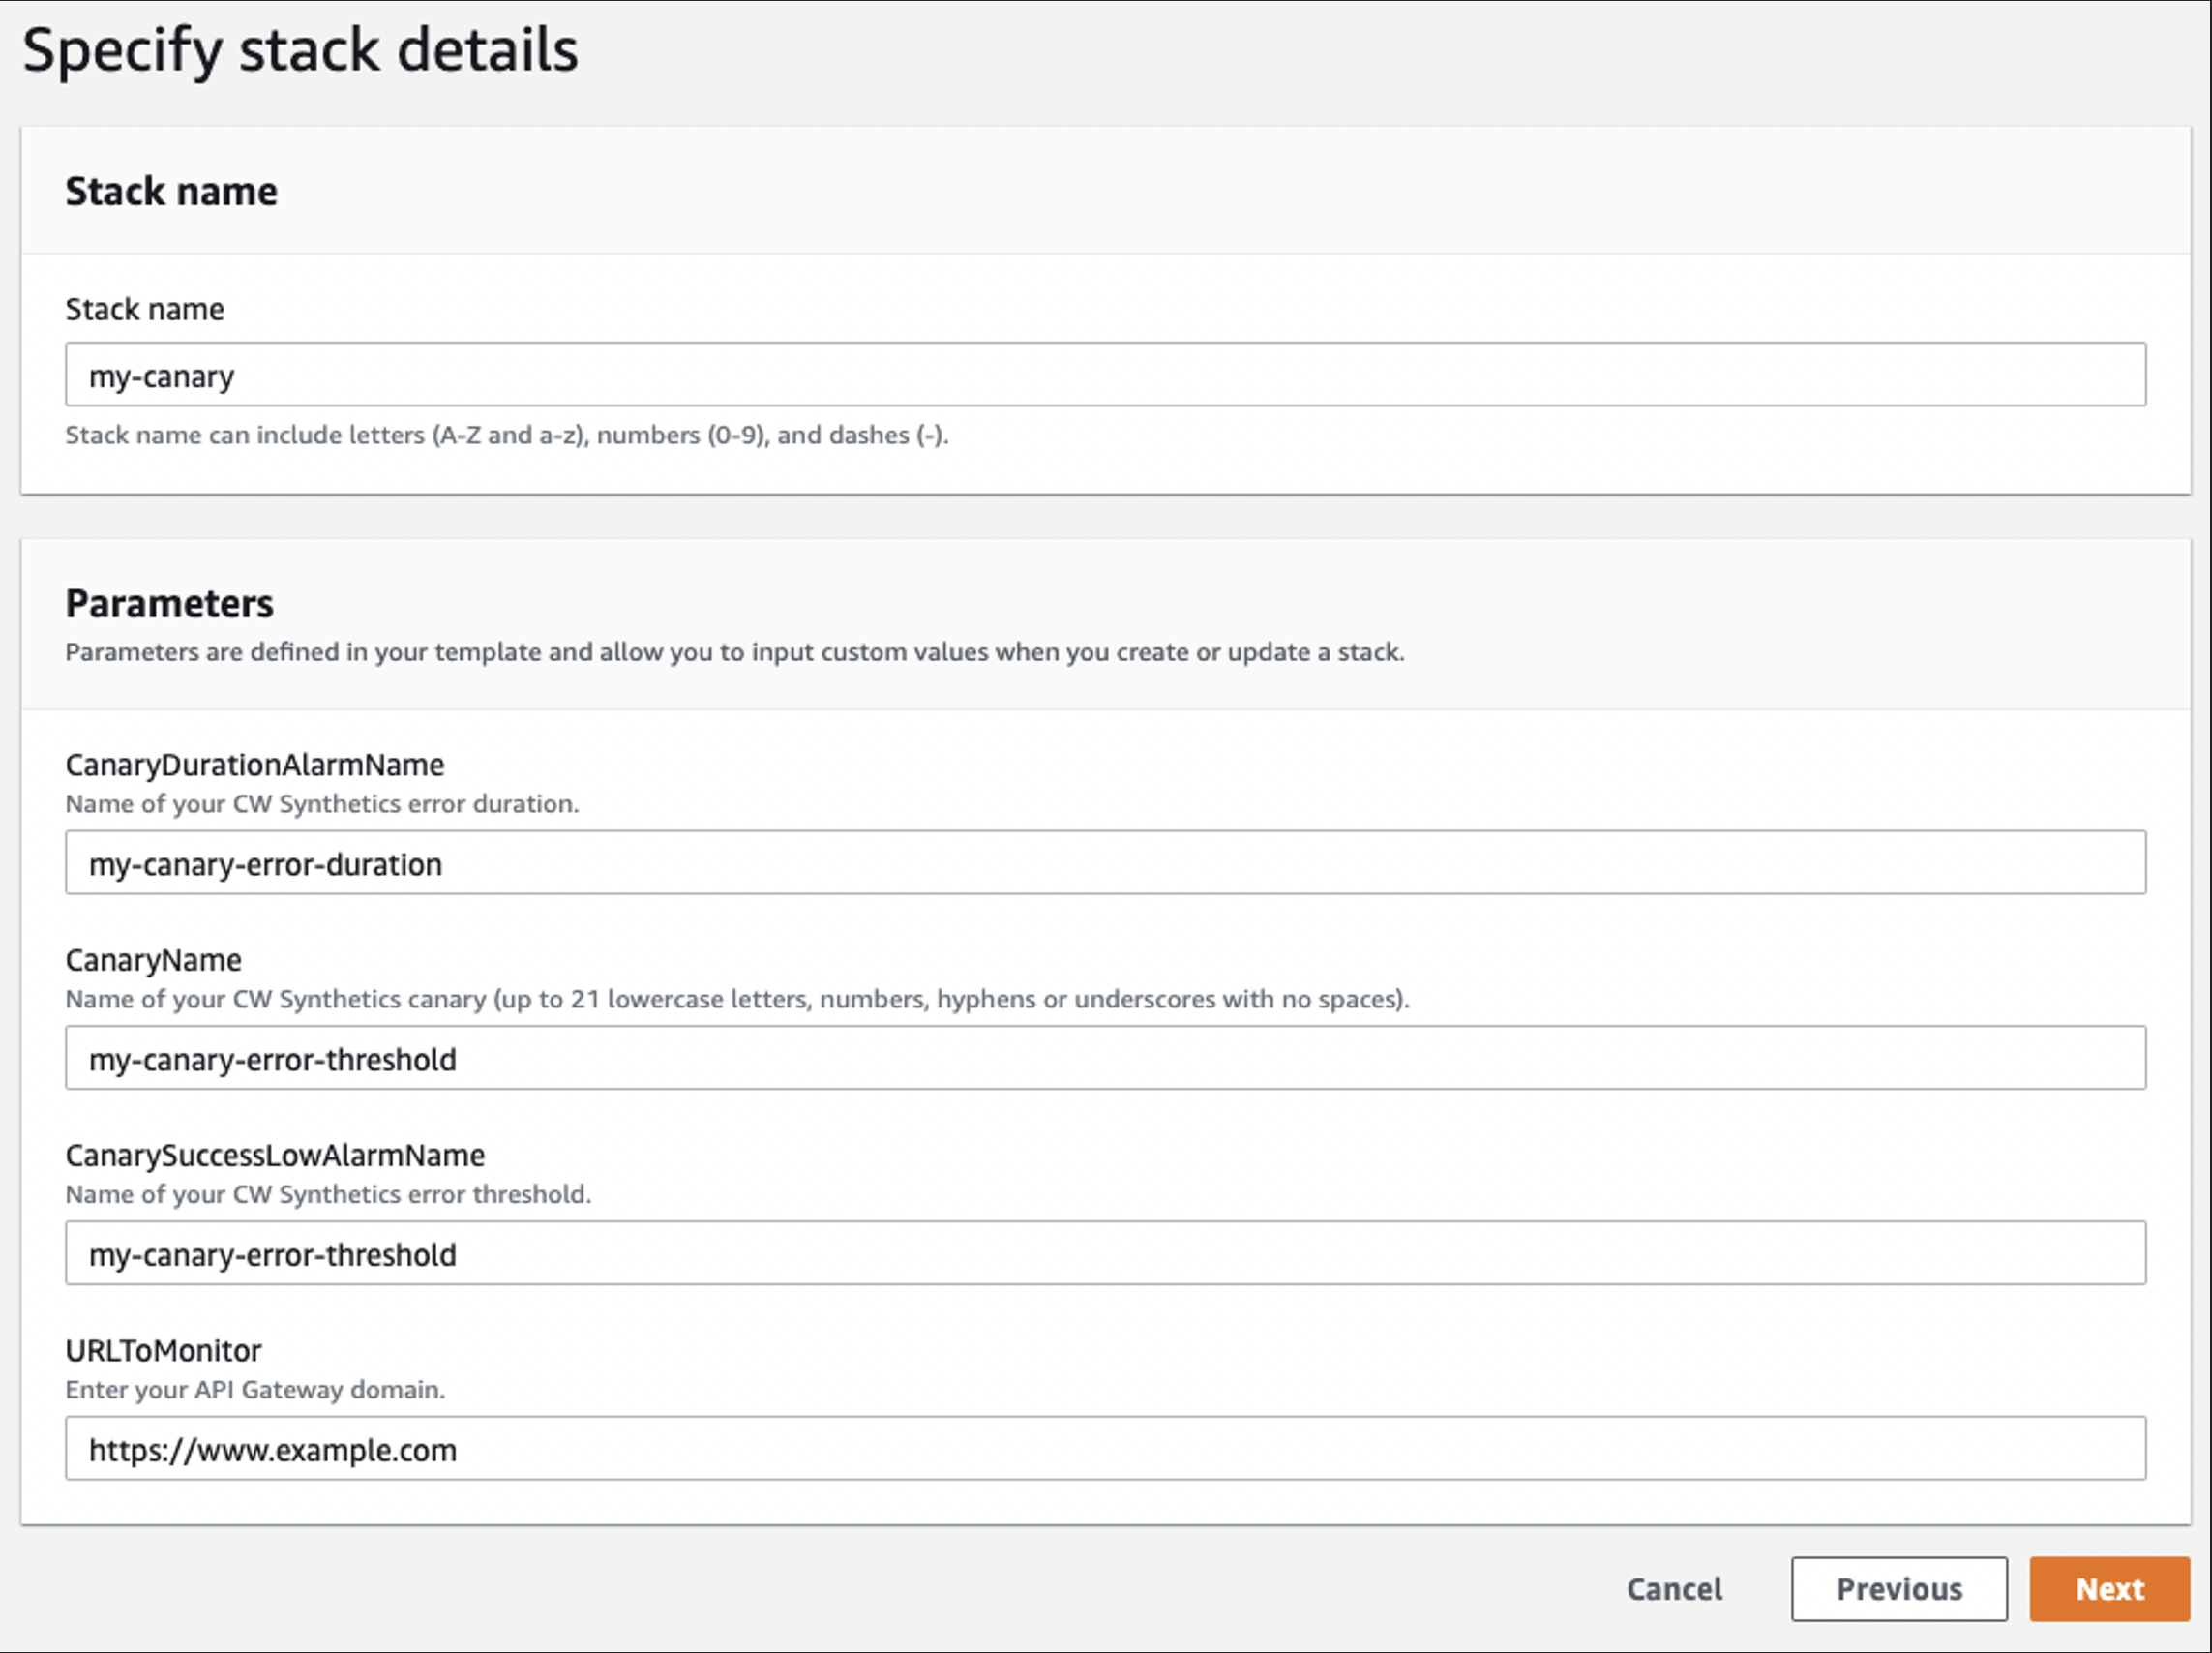
Figure 2: CloudFormation Specify Stack Details Configuration Example
Step 5: Navigate to canaries list page and select recently created Synthetics canary to monitor run metrics (Running state, screenshots, HTTP archive (HAR) files, and log files).
Step 6: (Optional) Navigate to CloudWatch User Guide: Troubleshooting a canary on a VPC if you encounter errors when creating the Synthetic canary.
Part B: Enable Hybrid DNS Enabled Between On-Prem and AWS
Step 7: If on-premise DNS service is unavailable, then create AWS Managed Microsoft AD to represent on-premise DNS server. If using on-premise DNS server, then note your DNS server addresses and skip to Step 3.
- Enter directory information:
- Edition: Standard Edition.
- Directory DNS name: <your-corp-dns>
- Directory NetBIOS name – optional: corp
- Directory description – optional: <description>
- Admin password: <password>
- Confirm password: <password>
- Select Next.
- Choose VPC and subnets:
- VPC: <Step-2-VPC>
- Subnets: <Private-Subnet-1A>, <Private-Subnet-2A>
- Select Next.
- Select Create Directory.
Step 8: Capture Directory details within Directory Service console, and note your DNS server addresses (each AD domain controller comes with embedded DNS service).
Step 9: Create Route 53 Outbound Endpoint (no Conditional Forwarding Rules yet) in order to enable DNS query forwarding to your AD domain DNS servers.
- General settings for outbound endpoint:
- Endpoint name: <outbound-endpoint-name>
- VPC in the Region: us-east-1 (N. Virginia): <Step-2-VPC>
- Security group for this endpoint: <Step-2-VPC-Security-Group>
- IP addresses:
- IP address #1:
-
- Availability Zone: us-east-1a
- Subnet: <Private-Subnet-1A>
- Select Use an IP address that is selected automatically
-
- IP address #2:
-
- Availability Zone: us-east-1b
- Subnet: <Private-Subnet-2A>
- Select Use an IP address that is selected automatically
- Select Submit (Outbound Endpoint creation can take up to 5 minutes).
Step 10: Create Route 53 Inbound Endpoint – (Optional for API Gateway deployments, Inbound Endpoints enable your on-premises DNS to query the Route 53 Resolver for any DNS zones (i.e., Private Zones) hosted on Route 53).
- General settings for inbound endpoint:
- Endpoint name: <inbound-endpoint-name>
- VPC in the Region: us-east-1 (N. Virginia): <Step-2-VPC>
- Security group for this endpoint: <Step-2-VPC-Security-Group>
- IP addresses:
- IP address #1:
-
- Availability Zone: us-east-1a
- Subnet: <Private-Subnet-1A>
- Select Use an IP address that is selected automatically
-
- IP address #2:
-
- Availability Zone: us-east-1b
- Subnet: <Private-Subnet-2A>
- Select Use an IP address that is selected automatically
- Select Submit (ENI created and IP addresses assigned behind the scenes).
Step 11: Create Route 53 Conditional Forwarding Rules.
- Rule for outbound traffic:
- Name: <outbound-rule-name>
- Rule type: Forward
- Domain name: corp.firstam.com
- VPCs that use this rule – optional: <Step-2-VPC>
- Outbound endpoint: <Step-9-Outbound-Endpoint>
- Target IP addresses:
- IP address: <Managed-AD-Domain-Controller-IP-Address-01>
-or-
<On-Premise-DNS-Server-IP-Address-01>
Port: 53 - Select Add target.
- IP address: <Managed-AD-Domain-Controller-IP-Address-02>
-or-
<On-Premise-DNS-Server-IP-Address-02>
Port: 53 - Select Submit.
- IP address: <Managed-AD-Domain-Controller-IP-Address-01>
Part C: Test Canary Run Metrics in Hybrid DNS Environment
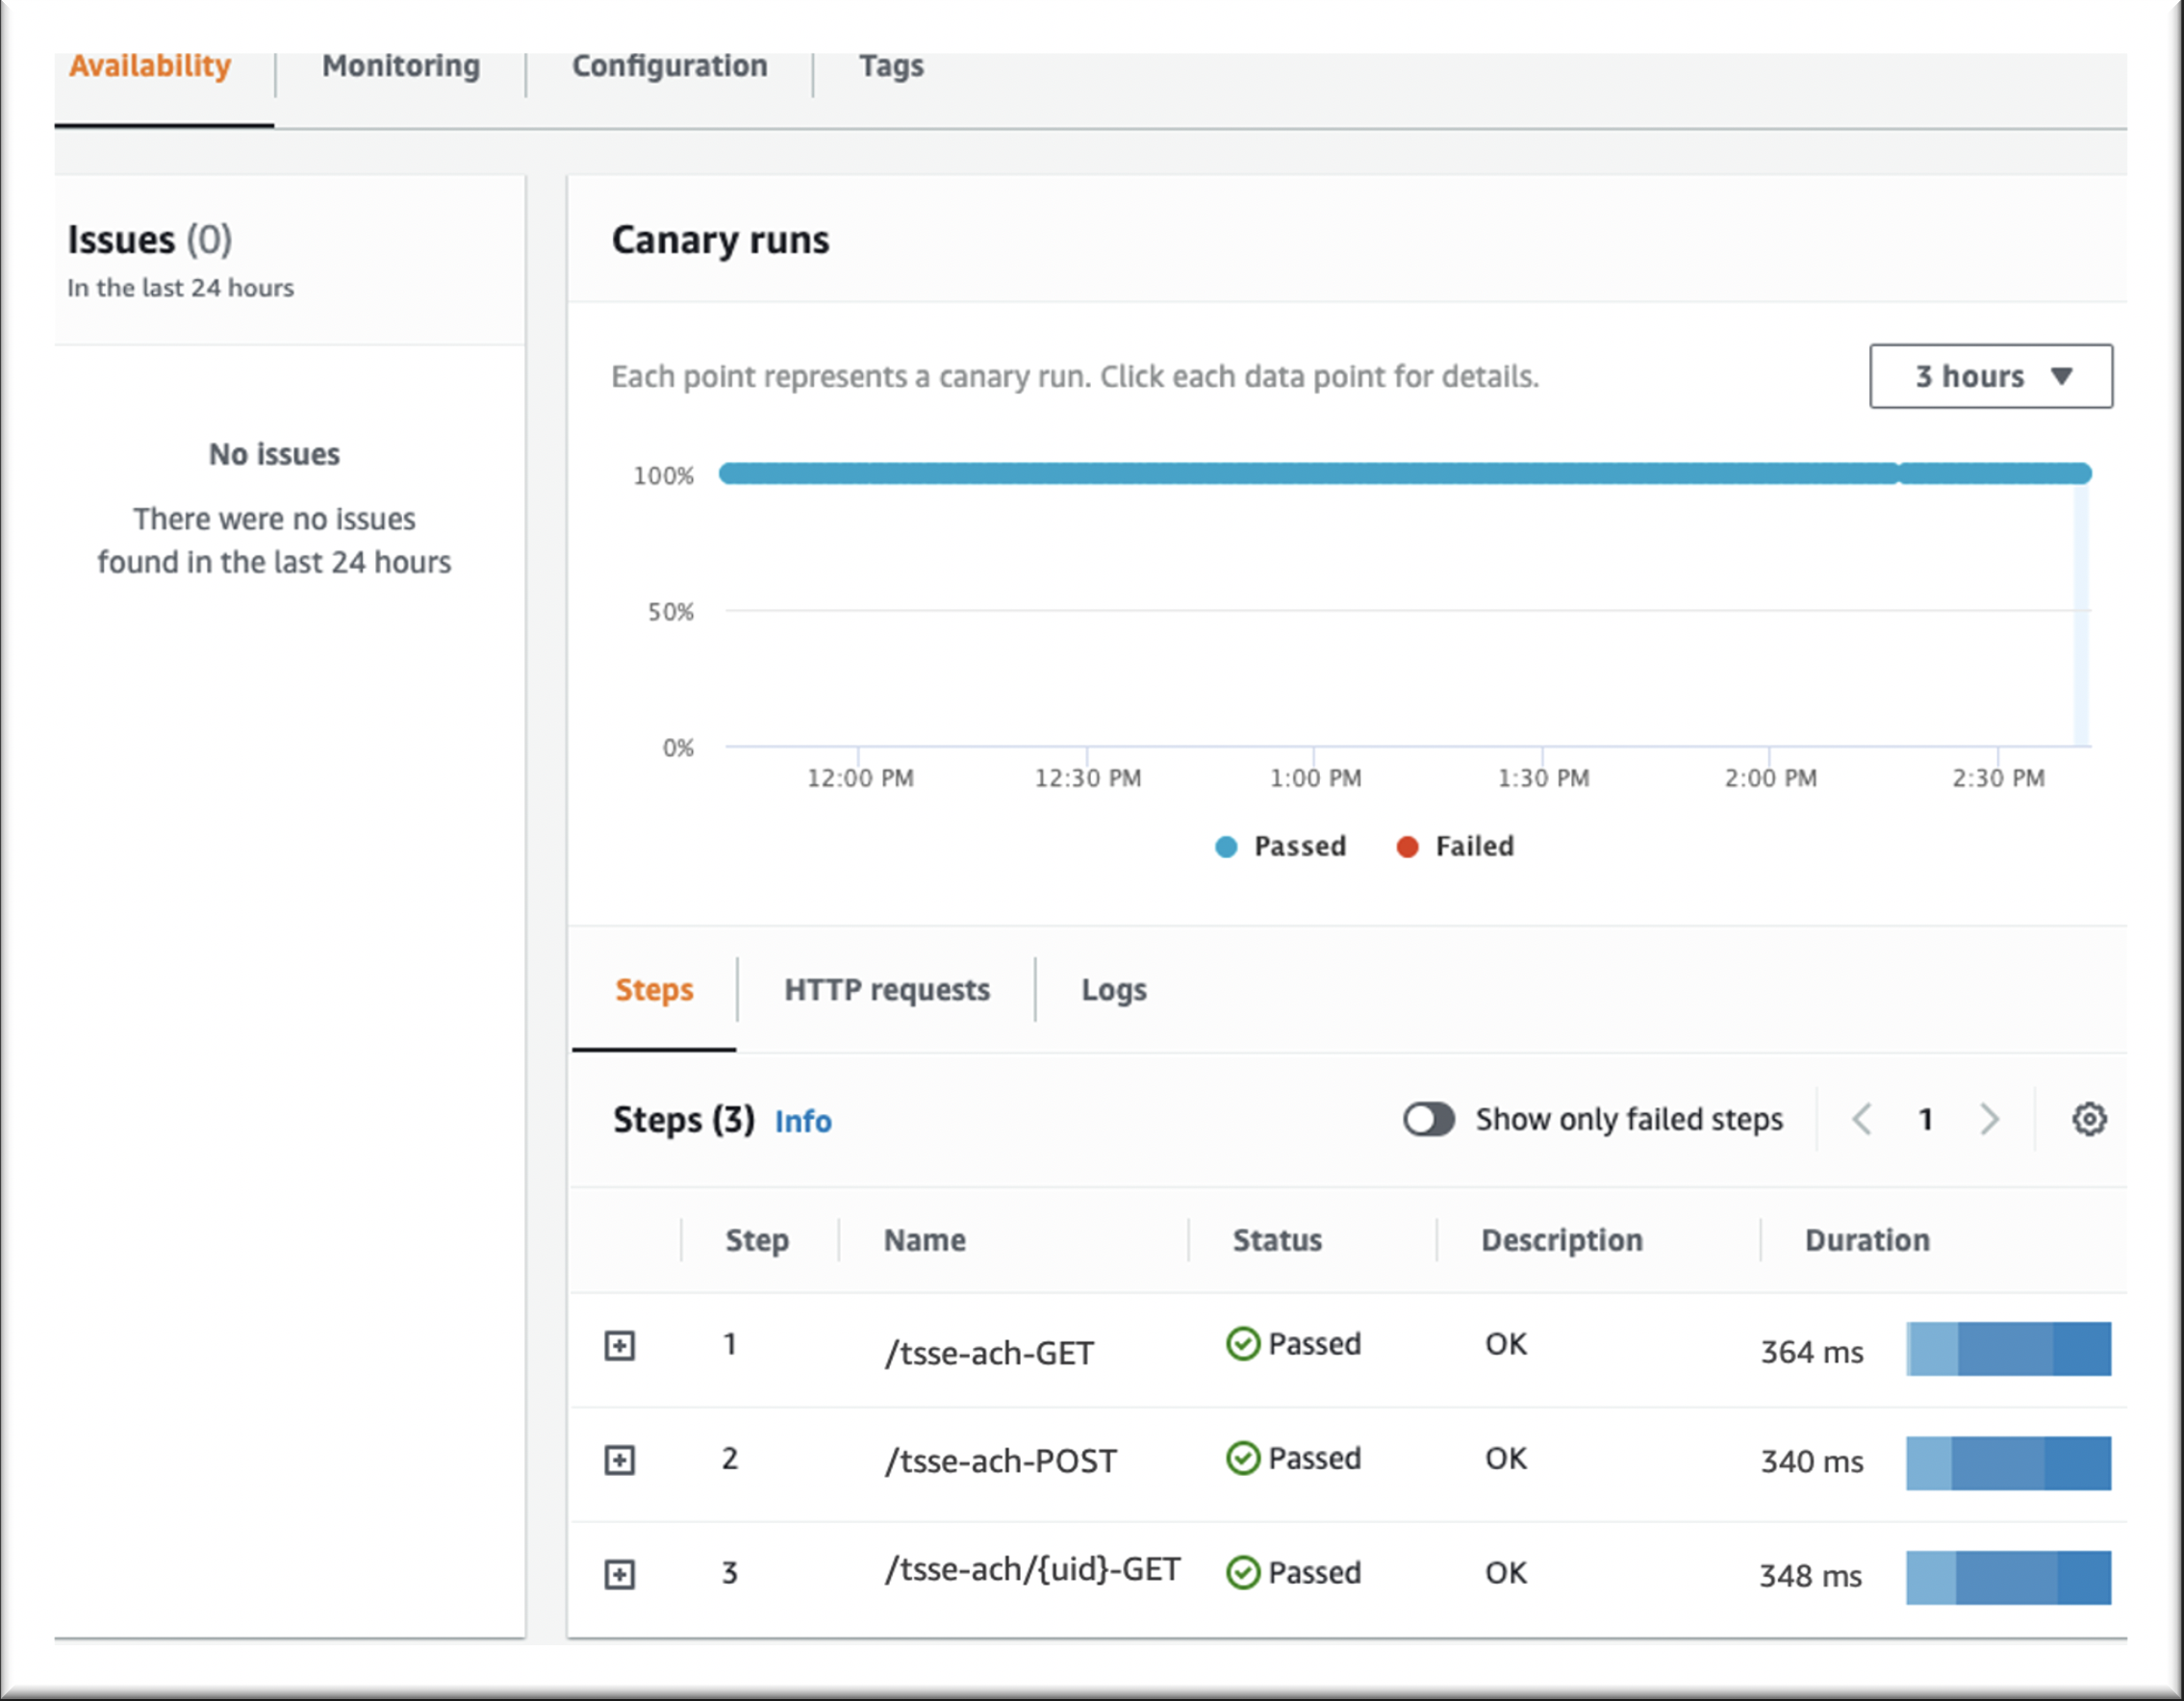
Test configuration by navigating to canaries list page to monitor the recently created Synthetics canary’s run metrics. Successful configuration of hybrid DNS Synthetic canaries results in metrics that are still populating in near real-time, and they should match output similar to that below within the AWS Management Console.
 |
 |
Figures 3 and 4: CloudWatch Synthetics Console Showing Canary Test Runs and Their Expanded HTTP Method Call Details.
Testing both our Synthetics and hybrid DNS configuration is conducted simply by navigating to the canaries list page within the Management Console in order to monitor the recently created CloudWatch Synthetics canary’s run metrics. In our case, we are testing the API’s reliance on cookies present within the request header in order to provide custom functionality to specific users by setting cookies in our CloudWatch Synthetics script to mimic and validate custom behavior and validate it, showing restricted for users with invalid cookies.
Cleanup
To avoid incurring future charges, delete all resources configured using the above implementation guidance.
- Open the Amazon CloudWatch console.
- Choose the canaries you created and from Actions, choose Stop. Repeat this step for every region. This step is needed only if there are active canaries in Running state.
- Open the Amazon S3 console, and choose all the buckets that start with ‘my-synthetics-‘. Empty the bucket contents.
- Open the AWS CloudFormation console, select the CloudFormation Stack created in Step 4, and select Delete.
- Navigate to the AWS Directory Service console, and delete the optional directory created in Step 7.
- Within the Amazon Route 53 console, delete your inbound and outbound endpoints created in Steps 9 and 10 respectively, and delete your forwarding rules configured in Step 11.
Conclusion
Following successful testing of their private API Gateway endpoint DR configuration, our spotlight customer approved CloudWatch Synthetics for use within their Production environments. They deploy their canaries using CloudFormation templates (AWS::Synthetics::Canary) and have begun additional testing of CloudWatch Synthetics canaries across other projects as a viable solution for their cross-region private endpoint DR strategy. The customer’s next goal is integrating CloudWatch Synthetics with CloudWatch ServiceLens and X-Ray for more granular visibility into how an error may be affecting specific application components.