AWS Cloud Operations Blog
Monitoring CoreDNS for DNS throttling issues using AWS Open source monitoring services
Monitoring Infrastructure and Application is essential today as it provides important information to the operations engineers to ensure the technology stack runs healthy to achieve the business outcomes. To build a microservices environment using container orchestration tool like Kubernetes, which is designed to increase flexibility and agility, there are many distributed parts that have to be monitored. CoreDNS is one such critical component of the Kubernetes ecosystem. Tracking performance issues & monitor throttling issues related to CoreDNS is really important as name resolution is one of the initial steps performed by a microservice in connecting to another microservice.
CoreDNS is a flexible, extensible Domain Name System (DNS) server that can serve as a Kubernetes cluster DNS. CoreDNS and DNS throttling issues can be challenging to identify and troubleshoot. While most of us check the CoreDNS logs and metrics in the name of monitoring, customers often forget the hard limit of 1024 packets per second (PPS) set at the ENI level. To understand how this hard limit can result in throttling issues, let’s understand a typical Kubernetes pod’s DNS resolution flow. A Kubernetes pod will have to resolve the domain names of both internal and external services for successful communication, and it utilizes the CoreDNS pod for this purpose. The CoreDNS pod then routes the DNS queries through the worker node’s (on which the CoreDNS pod is running) ENI for external endpoint resolution. In the case of internal endpoints, the packets will still have to use the worker node’s ENI, if the CoreDNS pod is not present in the same worker node as the pod making the DNS query.
Let’s now assume that there is a sudden influx of DNS queries being made and the PPS is approaching the hard limit of 1024. At this point, we will start seeing DNS throttling and we will have no clue on the root cause of the problem as the natural troubleshooting intuition is to focus on CoreDNS pod and not on the ENI metrics. This ENI level hard limit can impact all of the microservices running on that specific worker node and it is important to constantly monitor this metric to avoid outages. In this blog post we walk you through a solution that will help monitor packet drops that might occur at the ENI level to determine if there are DNS throttling issues.
An easy way to identify DNS throttling issues in worker nodes is by capturing some specific network performance metrics. The Elastic Network Adapter (ENA) driver publishes network performance metrics from the instances where they are enabled. You can troubleshoot DNS throttling using the linklocal_allowance_exceeded metric. The linklocal_allowance_exceeded is number of packets dropped because the PPS of the traffic to local proxy services exceeded the maximum for the network interface. In this blog post, we will capture the linklocal_allowance_exceeded metrics using AWS Distro for OpenTelemetry Collector. The metrics will then be stored in a Amazon Managed Service for Prometheus workspace and visualized using Amazon Managed Grafana.
Solution Overview
The following diagram in Figure1 shows the environment setup details that we will walk through in this blog post:
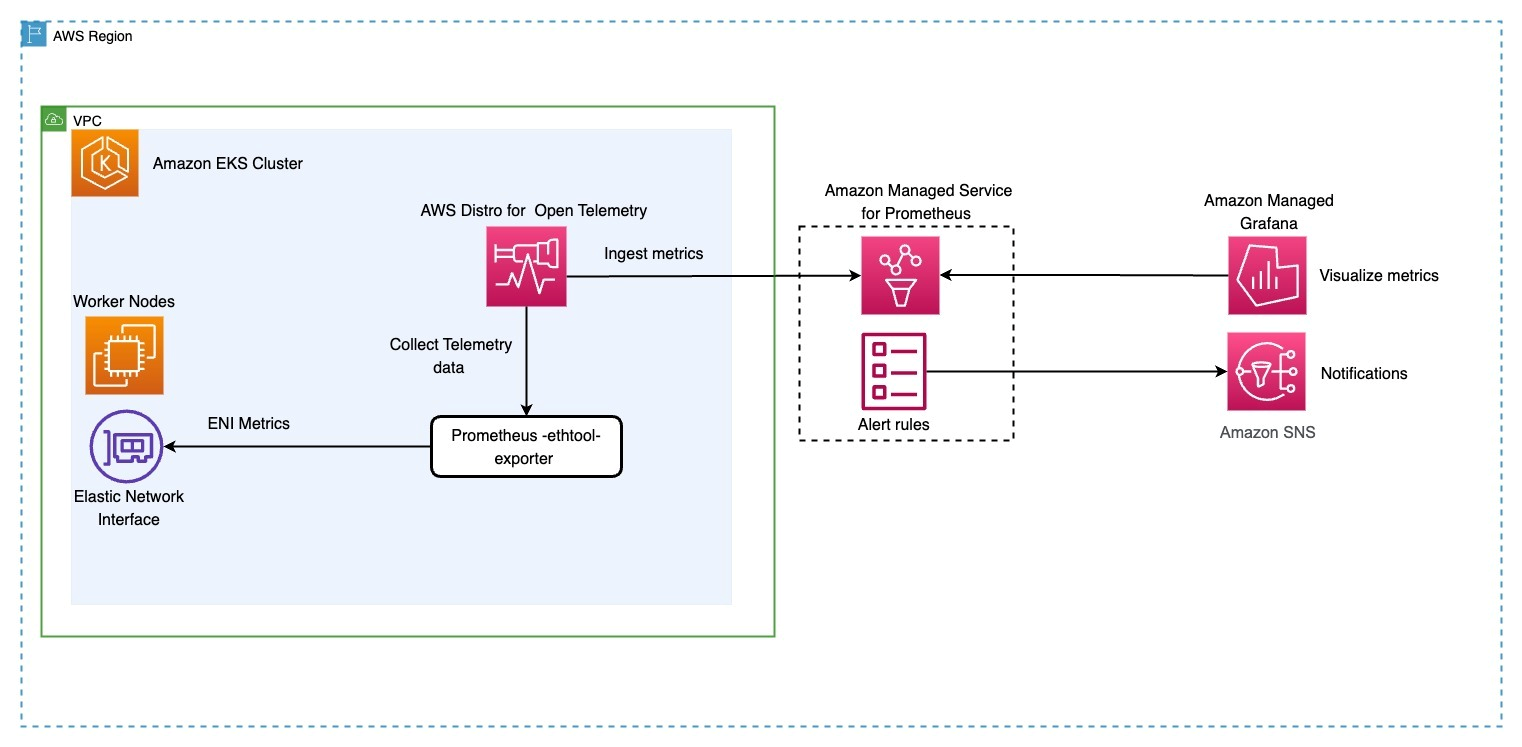
Figure 1. Architecture diagram: CoreDNS Monitoring.
Prerequisites
You will need the following to complete the steps in this post:
- AWS Command Line Interface (AWS CLI) version 2 is a utility for controlling AWS resources
- Amazon EKS Cluster
- eksctl is a utility for managing Amazon EKS clusters
- kubectl is a utility for managing Kubernetes
- helm is a tool for automating Kubernetes deployments
- ethtool – Ensure the worker nodes have ethtool installed
- An existing Amazon Managed Grafana Workspace
- jq
Step 1: Create an Amazon Managed Service for Prometheus workspace
In this step we will create a workspace for Amazon Managed Service for Prometheus.
You start by setting a few environment variables:
Use AWS CLI to create the workspace using the following command:
The Amazon Managed Service for Prometheus workspace shown in Figure 2 should be created in just a few seconds. Once created, you will be able to see the workspace as shown below:
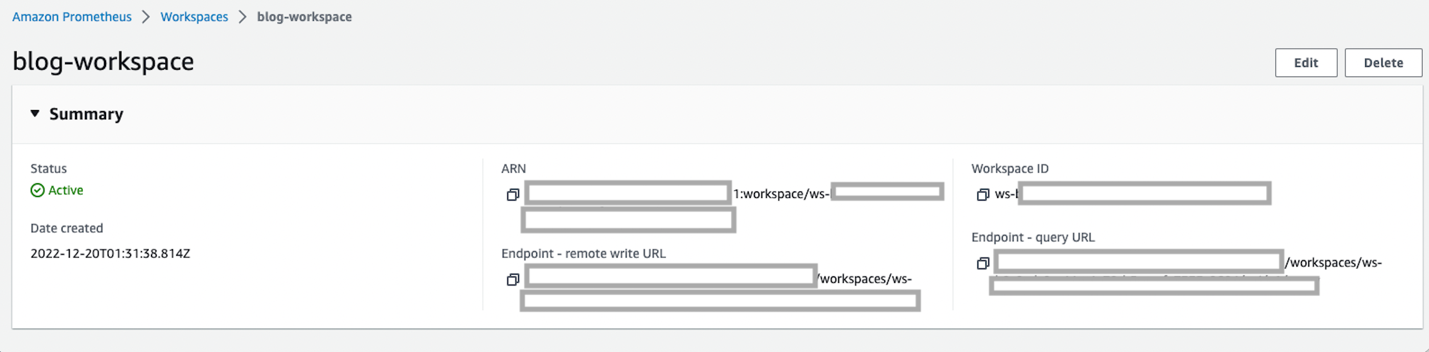
Figure 2. Amazon Managed Prometheus workspace.
Step 2: Deploying Prometheus ethtool exporter
ethtool is a networking utility on Linux. It is used to configure Ethernet devices on Linux. ethtool can also be used to find a lot of information about connected Ethernet devices on your worker nodes. We will be using the ethtool’s output to detect if there are any packet loss. We will use a prometheus ethtool exporter utility to store the output of ethtool command in prometheus format.
In this step, you will deploy the prometheus ethtool exporter: In the code snippet below, notice the pod spec contains the annotation “prometheus.io/scrape: ‘true’” which will be discovered by the ADOT collector for scraping the metrics exposed by ethtool.
Step 3: Deploying AWS Distro for Open Telemetry (ADOT) Collector to scrape the ENI metrics
In this step we will deploy the ADOT collector and configure the ADOT collector to ingest metrics to Amazon Managed Service for Prometheus. We will be using the Amazon EKS add-on for ADOT operator to send the metrics “linklocal_allowance_exceeded” to Amazon Managed Service for Prometheus for monitoring CoreDNS.
Before installing the AWS Distro for OpenTelemetry (ADOT) add-on, you must meet the following prerequisites and considerations.
- Meet the TLS certificate requirement to ensure end-to-end encryption.
- If installing an add-on version that is v0.62.1 or earlier, grant permissions to Amazon EKS add-ons to install the ADOT operator.
Installing cert-manager
Install cert-manager using the following command. This creates the necessary cert-manager objects that allow end-to-end encryption. This must be done for each cluster that will have the ADOT collector installed.
Verify that cert-manager is ready using the following command.
The example output is as follows:
Create an IAM role and Amazon EKS Service Account
We will be deploying the ADOT collector to run under the identity of a Kubernetes service account “adot-collector”. IAM roles for service accounts (IRSA) lets you associate the AmazonPrometheusRemoteWriteAccess role with a Kubernetes service account, thereby providing IAM permissions to any pod utilizing the service account to ingest the metrics to Amazon Managed Service for Prometheus.
You need kubectl and eksctl CLI tools to run the script. They must be configured to access your Amazon EKS cluster.
Install ADOT add-on
You can check the list of add-ons enabled for different versions of Amazon EKS using the following command:
Determine the ADOT versions are available that are supported by your cluster’s version.
Run following command to install the ADOT add-on, replace the –addon-version flag based on your Amazon EKS cluster version as show in step above.
Verify that ADOT add-on is ready using the following command.
Configure the ADOT Collector
To configure ADOT collector, let’s create collector-config-amp.yaml file. The collector-config-amp.yaml contains a config map “my-collector-amp-collector” which defines the scrape configuration to collect metrics. The config scrapes metrics from pods that has the annotation “prometheus.io/scrape: ‘true’”.
Note: We will be scraping this metric every 15s to constantly monitor and send alert notifications if there are packet drops. There will be cost implications of setting the scrape_interval low and we encourage you to set it accordingly if you are concerned about cost.
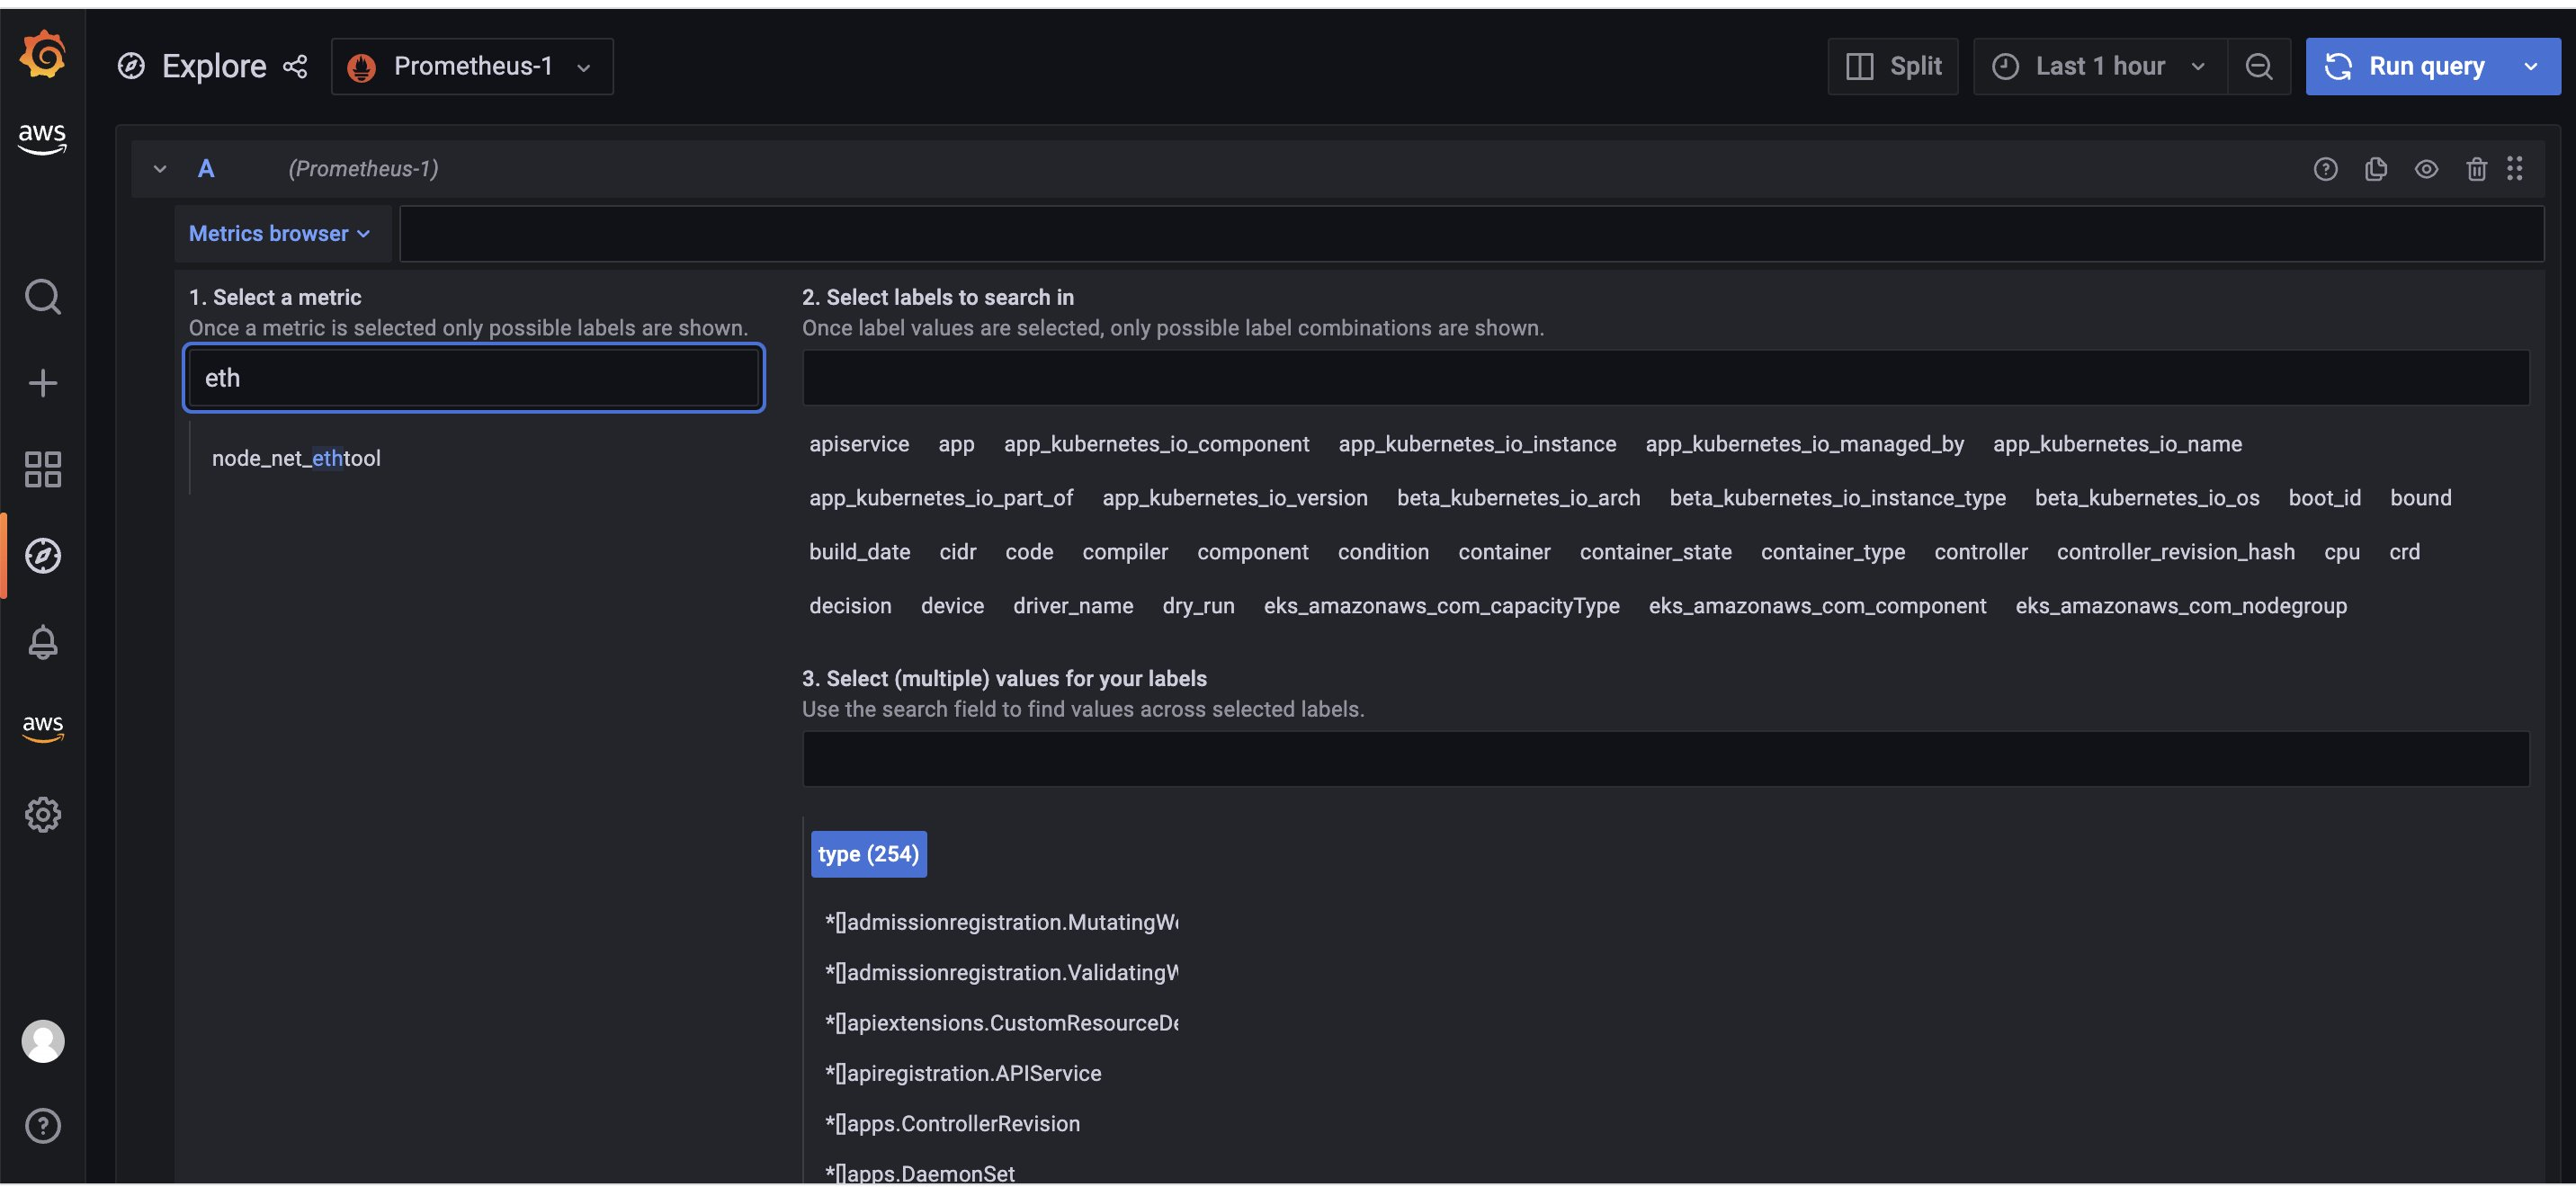
Figure 3. Exploring the metric in Amazon Managed Grafana.
Let’s build a dashboard for the linklocal_allowance_exceeded metric by using the query
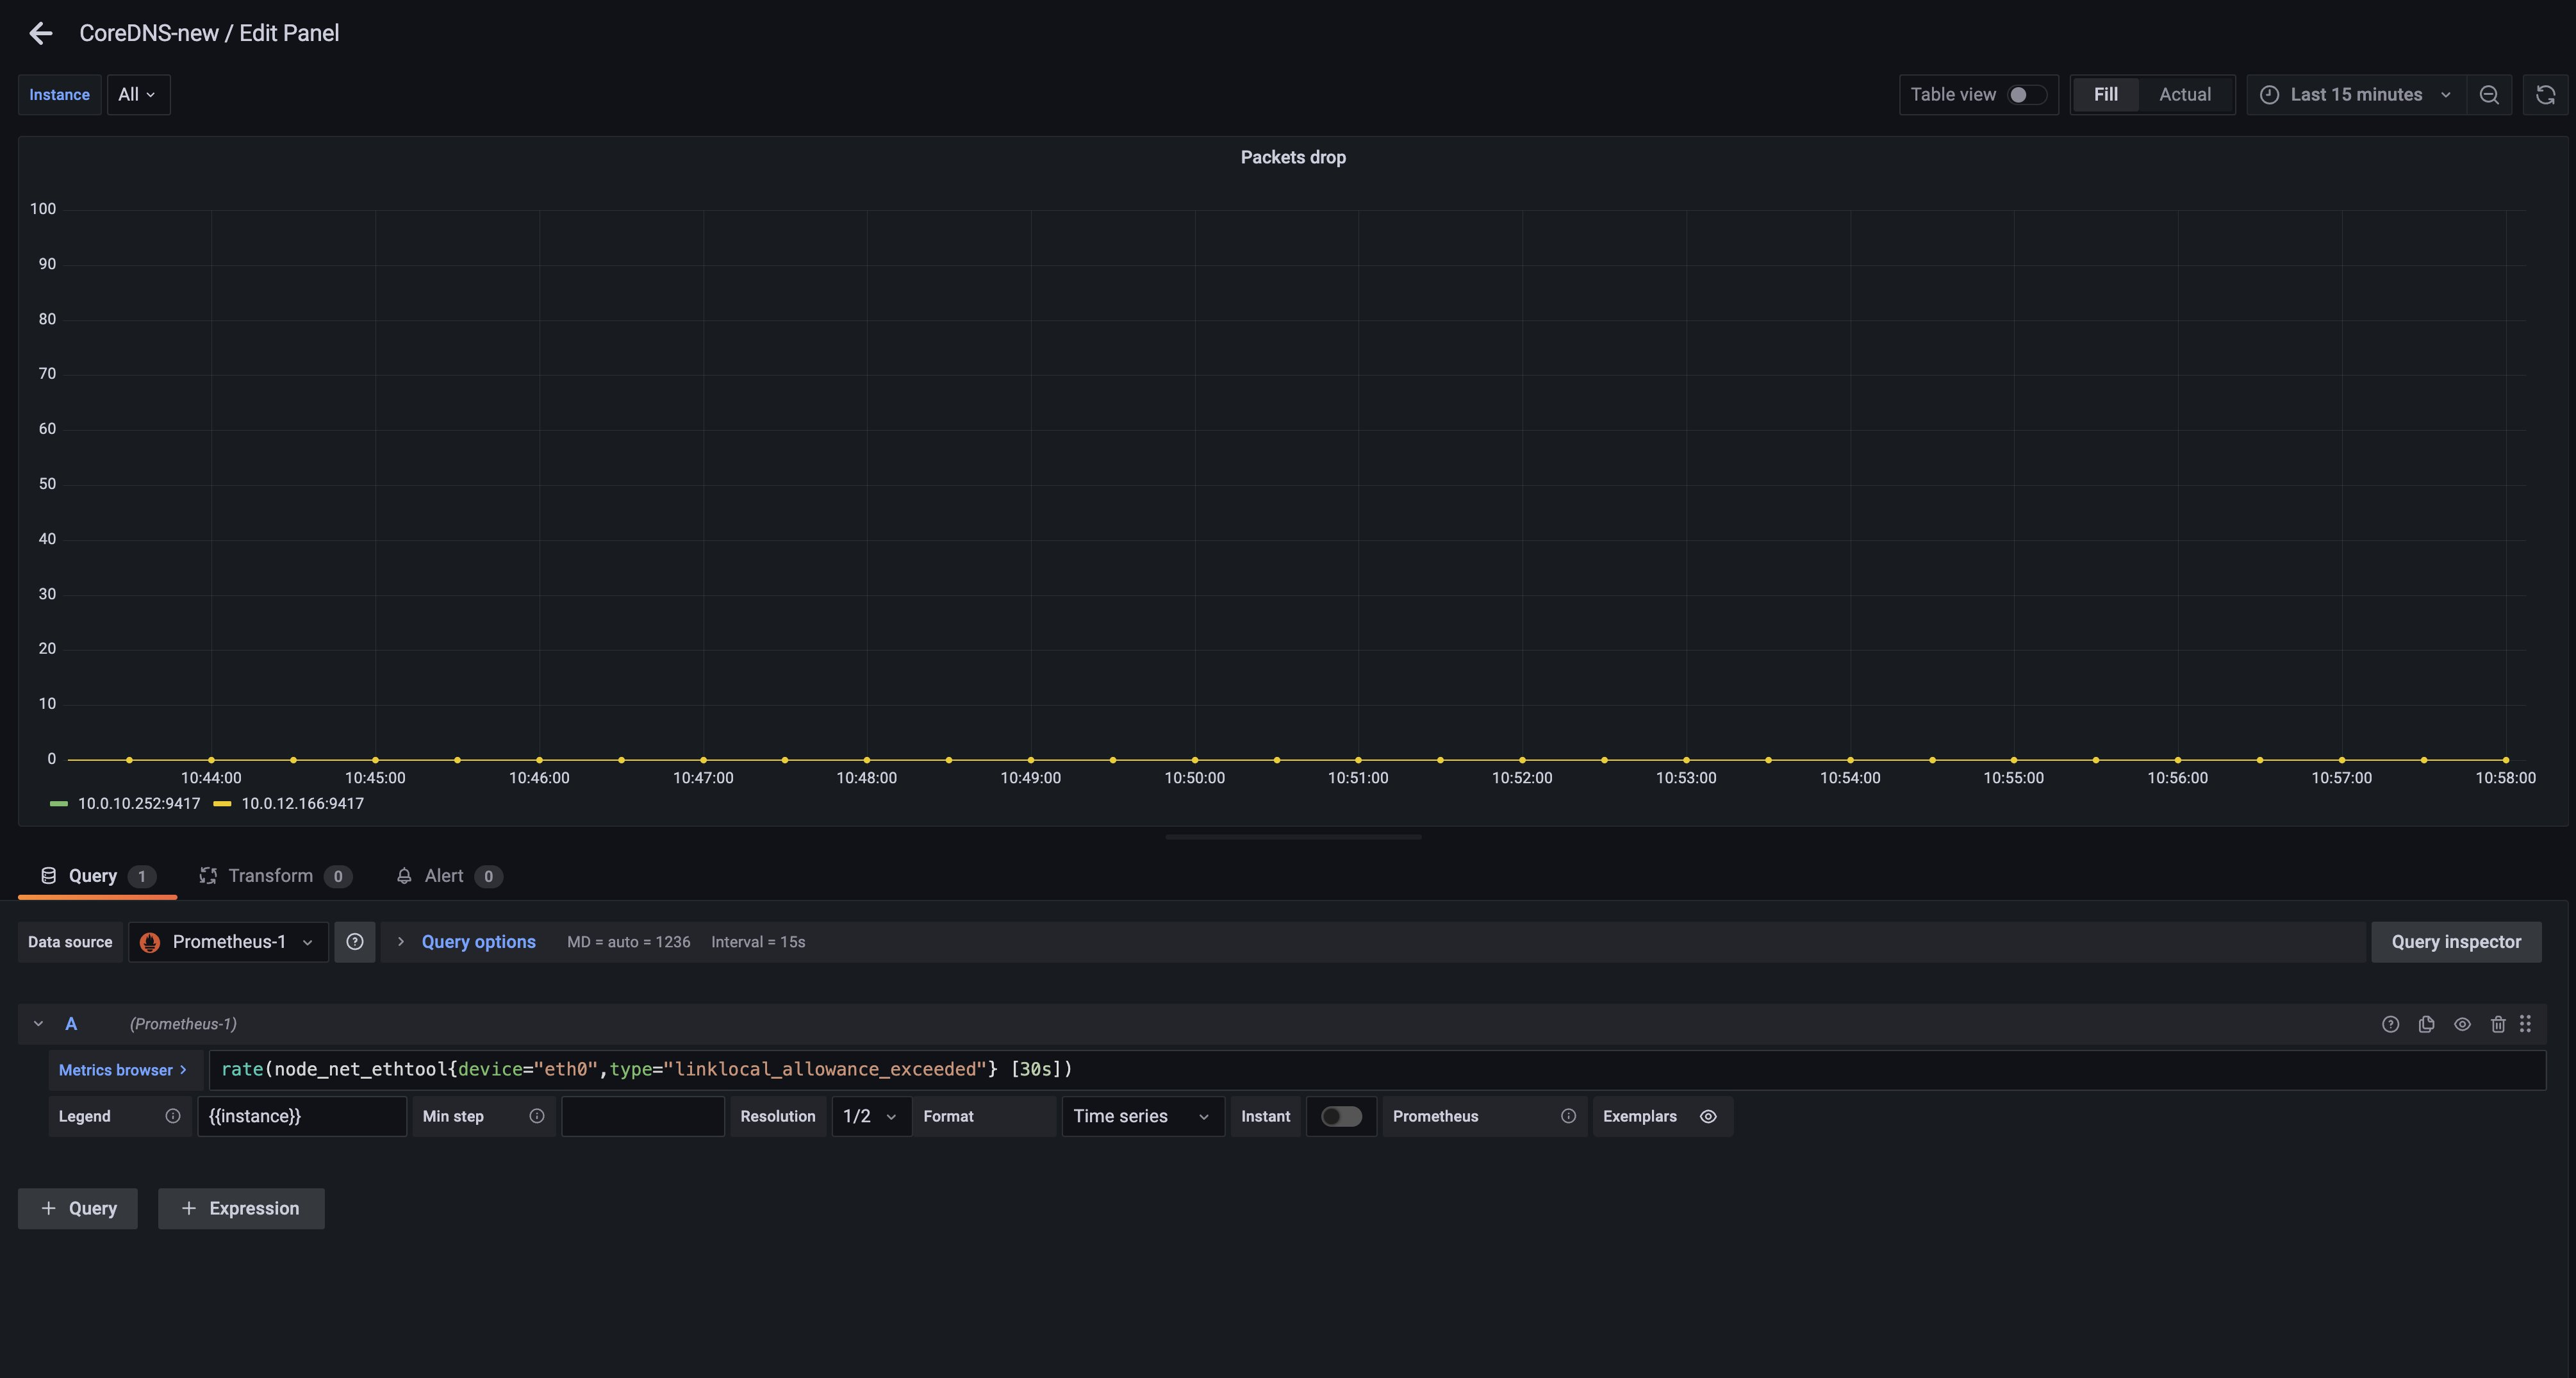
Figure 4. Creating the panel for “linklocal_allowance_exceeded” metric in Amazon Managed Grafana.
We can see that there were no packets dropped as the value is zero. You can further extend this by configuring alerts in alert manager in Amazon Managed Service for Prometheus to send notifications
Step 5: Configure alert manager in Amazon Managed Service for Prometheus to send notifications.
Let’s configure recording rules and alerting rules to check for the metric captured “linklocal_allowance_exceeded”. Configuring the alert manager rules in Amazon Managed Service for Prometheus will ensure notifications being sent to the appropriate teams in a timely manner when a packet drop happens.
We will use the ACK Controller for Amazon Managed Service for Prometheus to provision the alerting and recording rules.
Let’s use Helm to install an ACK service controller on your cluster. Set the SERVICE and AWS_REGION environment variables to make sure that the Prometheus controller is installing in the current region.
You can also verify the installation by running the following command:
This returns output that shows as below
Note : The role that you will use to provision Amazon Managed Service for Prometheus resources via ACK must have the arn:aws:iam::aws:policy/AmazonPrometheusConsoleFullAccess role.
Let’s now create a yaml file for provisioning the alert manager definition and rule groups. Save the below file as rulegroup.yaml. See RuleGroupsNamespaceData structure for the format of this file.
In the below spec file, you can see that we are creating an alert LinkLocalAllowanceExceeded for the metric collected using the PromQL expression node_net_ethtool. We are not specifying the evaluation period (for expression) as packet drops do not happen frequently and you would want to get notified the moment it happens to avoid CoreDNS performance issues.
Replace WORKSPACE-ID with the Amazon Managed Service for Prometheus workspace Id that was created as part of step 1 in the below provided yaml file.
Let’s now configure the alert manager definition. Save the below file as alertmanager.yaml.
See AlertManagerDefinitionData structure for the format of this file.
Replace WORKSPACE-ID with the Amazon Managed Service for Prometheus workspace Id that was created as part of step 1. Replace TOPIC-ARN with the ARN of an Amazon Simple Notification Service (Amazon SNS) topic where you want to send the alerts, and REGION with the current region of the workload. Make sure that your workspace has permissions to send messages to Amazon SNS.
Apply these changes by issuing the following commands:
It may take a few seconds for the recording rules and alert manager to be created in the Amazon Managed Service for Prometheus workspace.
Clean up
To delete the resources provisioned in the blog, please execute the following commands. Make sure the WORKSPACE variable has the workspace id of the “blog-workspace”
Conclusion
In this post, we demonstrated how to monitor and create alerts for CoreDNS throttling issue utilizing AWS Distro for OpenTelemetry (ADOT), Amazon Managed Service for Prometheus, and visualize metrics utilizing Amazon Managed Service for Grafana. By monitoring the “linklocal_allowance_exceeded” metric, customers will be able to pro-actively detect the packet drops and take preventive actions. Customers can capture additional metrics for CoreDNS following similar steps provided in the post to monitor the health of CoreDNS.
Further Reading
- Hands-on Observability workshop – https://catalog.workshops.aws/observability/en-US/intro
- AWS Observability Best Practices – https://aws-observability.github.io/observability-best-practices/
- AWS Observability Accelerator – https://aws-observability.github.io/terraform-aws-observability-accelerator/
About the authors: