AWS Cloud Operations Blog
Using Amazon S3 Server Access Logs with Amazon CloudWatch Logs
TL;DR
What if you could go from raw Amazon S3 server access logs to a complete security dashboard without building a custom pipeline? The dashboard below is deployed using the CloudFormation template provided in this post.
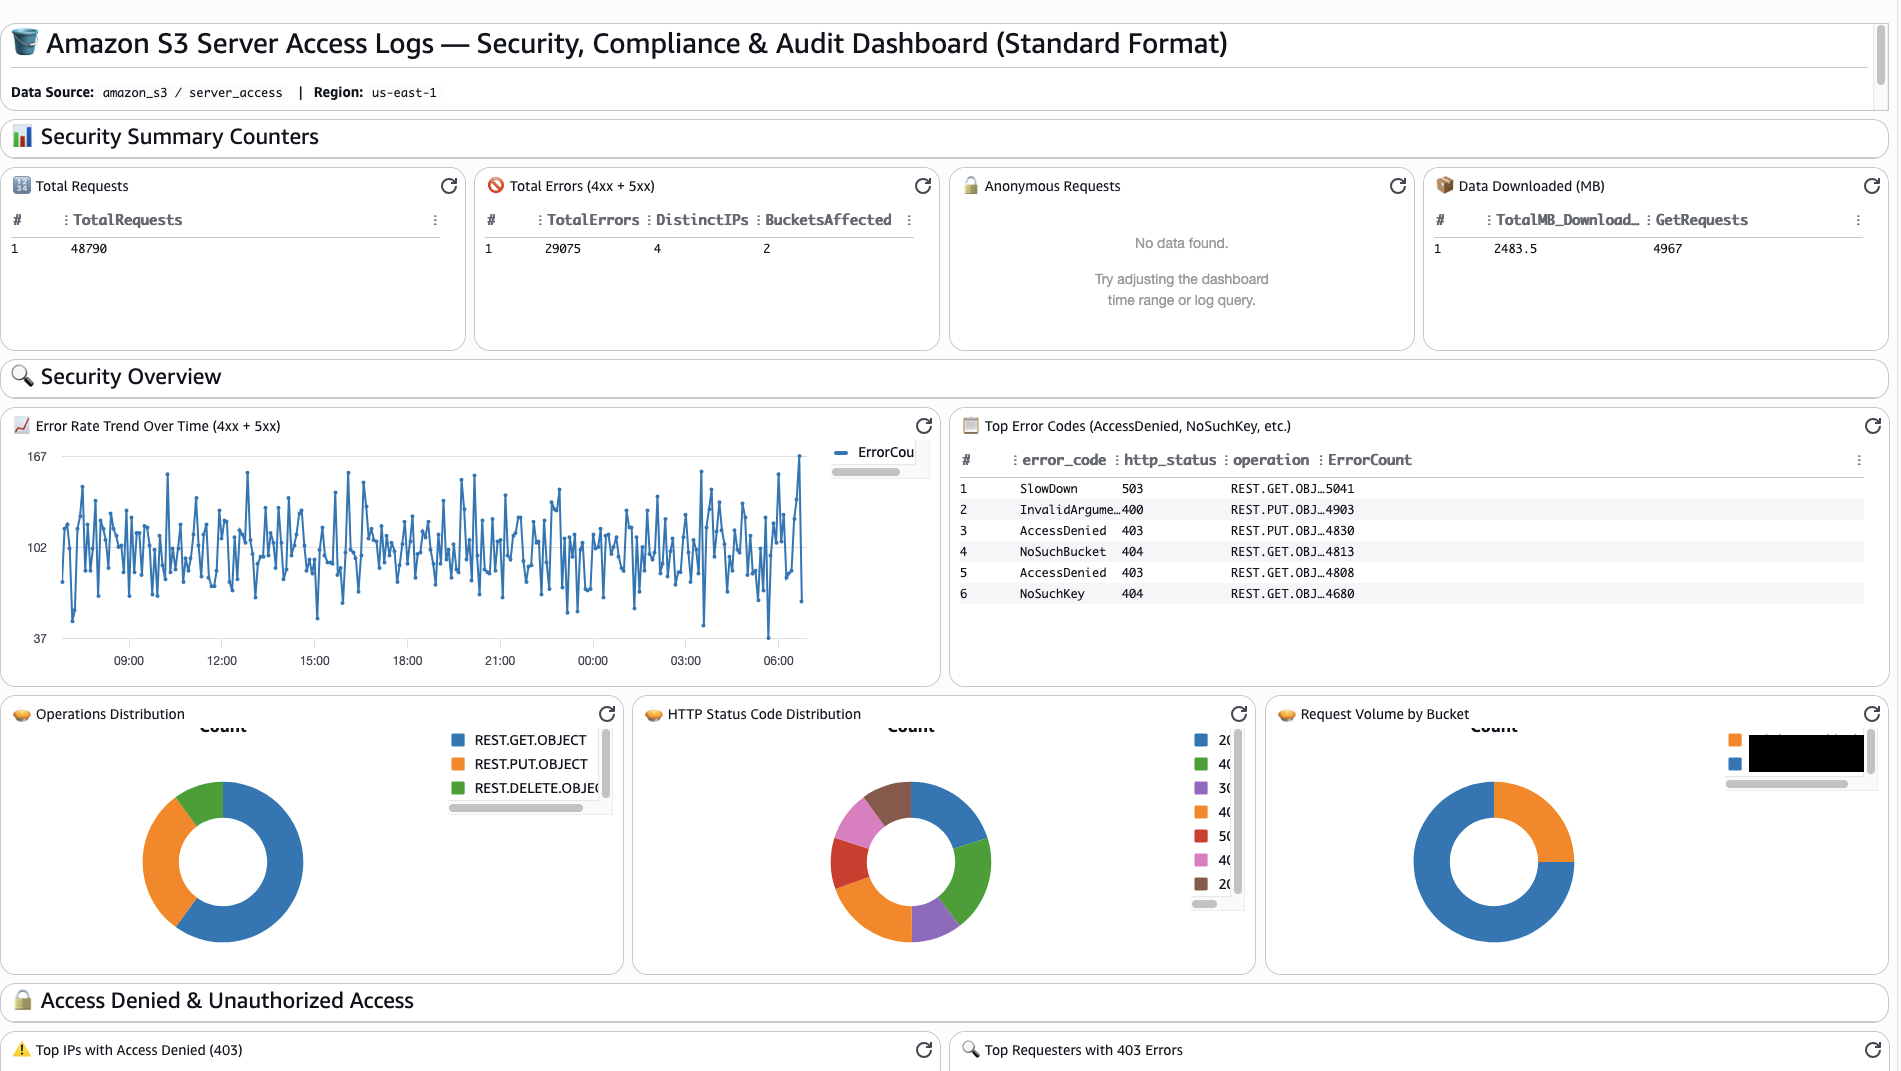
Figure 1: Amazon S3 Server Access Logs Security, Compliance & Audit Dashboard
Until now, getting security visibility from Amazon S3 server access logs meant managing destination buckets, building custom parsing pipelines, and stitching together disconnected tools for alerting. That operational burden is gone. Amazon S3 server access logs are now available as a native Amazon CloudWatch data source, with automatic transformation to structured JSON, no ETL to build or maintain, and your data ready to query, filter, and act on once delivered. Here’s what the end-to-end path looks like, from log ingestion to a fully operational security dashboard:
Enable. Use CloudWatch Telemetry Enablement Rules to start ingesting Amazon S3 server access logs across your organization into CloudWatch Logs in minutes.
Query. Use CloudWatch Logs Insights to investigate unauthorized access attempts and unusual data transfer patterns.
Alert. Create Metric Filters that emit CloudWatch metrics and trigger alarms when 403/404 spikes, 5xx errors, or anonymous access exceed your thresholds.
Rank. Configure Contributor Insights rules to identify the top IPs and requesters generating errors or downloading the most data as logs are delivered.
Core principle: You already have the data. CloudWatch makes it actionable without pipelines, parsing, or additional infrastructure.
Read on for the full walkthrough.
Introduction
Organizations running workloads on AWS often store their most critical data in Amazon S3, from application data and analytics datasets to backups, logs, and regulated content. With that responsibility comes a fundamental question: How do I know who is accessing my data, what they are doing with it, and whether those actions comply with my security policies? Amazon S3 server access logs answer that question by recording every request made to your buckets, whether successful or failed, authenticated or anonymous, with over 25 fields of HTTP-level detail covering requester identity, source IP, authentication type, operations performed, bytes transferred, TLS version, encryption settings, and S3 lifecycle activity.
Server access logs are one of two complementary sources of Amazon S3 data-plane visibility. The other is AWS CloudTrail data events for Amazon S3, which record object-level API activity such as GetObject, PutObject, and DeleteObject with full AWS Identity and Access Management (IAM) identity context and detailed request/response parameters. The two sources capture activity from different angles: CloudTrail data events capture the full identity of who performed each S3 operation (IAM principal, role, account, source IP) and provide reliable log delivery in near real time, while server access logs add HTTP-level fields such as TLS version and cipher suite, request latency, deprecated SigV2 detection, and S3 lifecycle operations. Using both together gives you a defense-in-depth approach that maximizes visibility across your Amazon S3 environment.
With Amazon S3 server access logs now available as a delivery source using Amazon CloudWatch Vended Logs for Amazon CloudWatch unified data store , the raw space-delimited log entries are automatically transformed into structured JSON and delivered directly into CloudWatch Logs, removing the need for destination bucket provisioning, custom ETL pipelines, and transformation workflows. Before this native integration, customers faced significant challenges: managing lifecycle policies for millions of small log files, building custom parsing infrastructure to make logs searchable, deploying additional components for alerting, and correlating S3 access patterns across disconnected systems. CloudWatch addresses these challenges by providing a single observability platform where S3 access logs are searchable via Logs Insights once delivered, can drive Metric Filters and Contributor Insights for continuous monitoring as logs arrive, and live alongside CloudTrail events, VPC Flow Logs, and application logs, with volume-tiered pricing that reduces costs as ingestion grows.
In this blog post, we show you how to go from raw Amazon S3 server access logs to a complete security monitoring dashboard using Amazon CloudWatch, including ingestion setup with Telemetry Enablement Rules, security analytics with Logs Insights queries, and proactive detection with Metric Filters and Contributor Insights rules.
Amazon S3 Security, Compliance & Audit Dashboard
CloudWatch Dashboards provide a unified visualization layer for your Amazon S3 server access log data. The sample dashboard uses CloudWatch Logs Insights queries to surface security patterns, compliance metrics, and operational trends across all your monitored buckets, giving your security and compliance teams a single destination to monitor access patterns, investigate anomalies, and validate compliance posture.
To help you get started quickly, we have provided a sample CloudFormation template that deploys a sample CloudWatch Dashboard for Amazon S3 server access logs. The template supports both Standard AWS log format and OCSF (Open Cybersecurity Schema Framework) format, and organizes visibility across the following security monitoring categories:
- Security Summary Counters: Total requests, total errors (4xx + 5xx), anonymous request counts, and total data downloaded.
- Access Denied and Unauthorized Access: Top IPs and requesters generating 403 errors, access denied trends over time, and anonymous/unauthenticated request details.
- Data Exfiltration Indicators: Top downloaders by volume, download volume trends over time, and external (non-RFC1918) IP download activity.
- Delete and Bulk Delete Monitoring: Bulk delete activity by requester and delete operation trends over time.
- TLS and Encryption Compliance: TLS version distribution, cipher suite distribution, signature version distribution, and identification of clients using outdated TLS (1.0/1.1) or deprecated SigV2.
- Lifecycle and Retention Compliance: S3 lifecycle operations by type, lifecycle operation trends, ACL-required requests (legacy access), and Access Point usage.
- Audit and Activity Patterns: Top requesters by activity volume, user agents per bucket, operations per bucket, and slowest requests by duration.
- Detailed Security Events: Recent access denied events and 5xx server errors with full request detail for investigation.
Figure 2: Amazon S3 Server Access Logs Security, Compliance & Audit Dashboard
Deploying the CloudFormation Template
To deploy the CloudFormation template:
- Download the CloudWatch_S3_ServerAccessLogs_Security_Dashboard.yaml template.
- Open the AWS CloudFormation console.
- On the Stacks page, choose Create stack | With new resources (standard).
- Under Specify template, choose Upload a template file.
- Then choose Choose file and select the downloaded template.
- Choose Next.
- On the Specify stack details page, enter a stack name and provide the required parameters, including your Dashboard Name and Log Format (Standard or OCSF).
- Choose Next, configure any stack options as needed, then choose Next again.
- Review your configuration and choose Submit.
Once the stack creation completes, the CloudWatch dashboard is available and ready to display your Amazon S3 server access log patterns as events are delivered.
Let’s see how to get started ingesting Amazon S3 server access logs and explore additional security analytics you can build with these events
Enabling Amazon S3 Server Access Log Ingestion via Telemetry Enablement Rules
Amazon CloudWatch telemetry enablement rules allow you to automatically configure telemetry collection for your AWS resources. Rules help you standardize telemetry collection across your organization or accounts and provide consistent monitoring coverage. Follow these steps to enable Amazon S3 server access log ingestion into CloudWatch using the AWS Console:
- Open the CloudWatch console.
- In the navigation pane, choose Ingestion.
- Choose the Enablement rules tab, then choose Add rule.
- Select Configure telemetry for Amazon S3.
- On the Specify Scope section, enter a descriptive name for the Rule name (e.g., S3-Access-Logs-Enablement).
- Optionally you can add Tag Key/Value to Select data source scope, which will enable telemetry for existing and new resources that match your tag criteria.
- For Target regions, leave this default if you want this enabled in the current region, or you can select all or specific regions for this rule. Then choose Next.
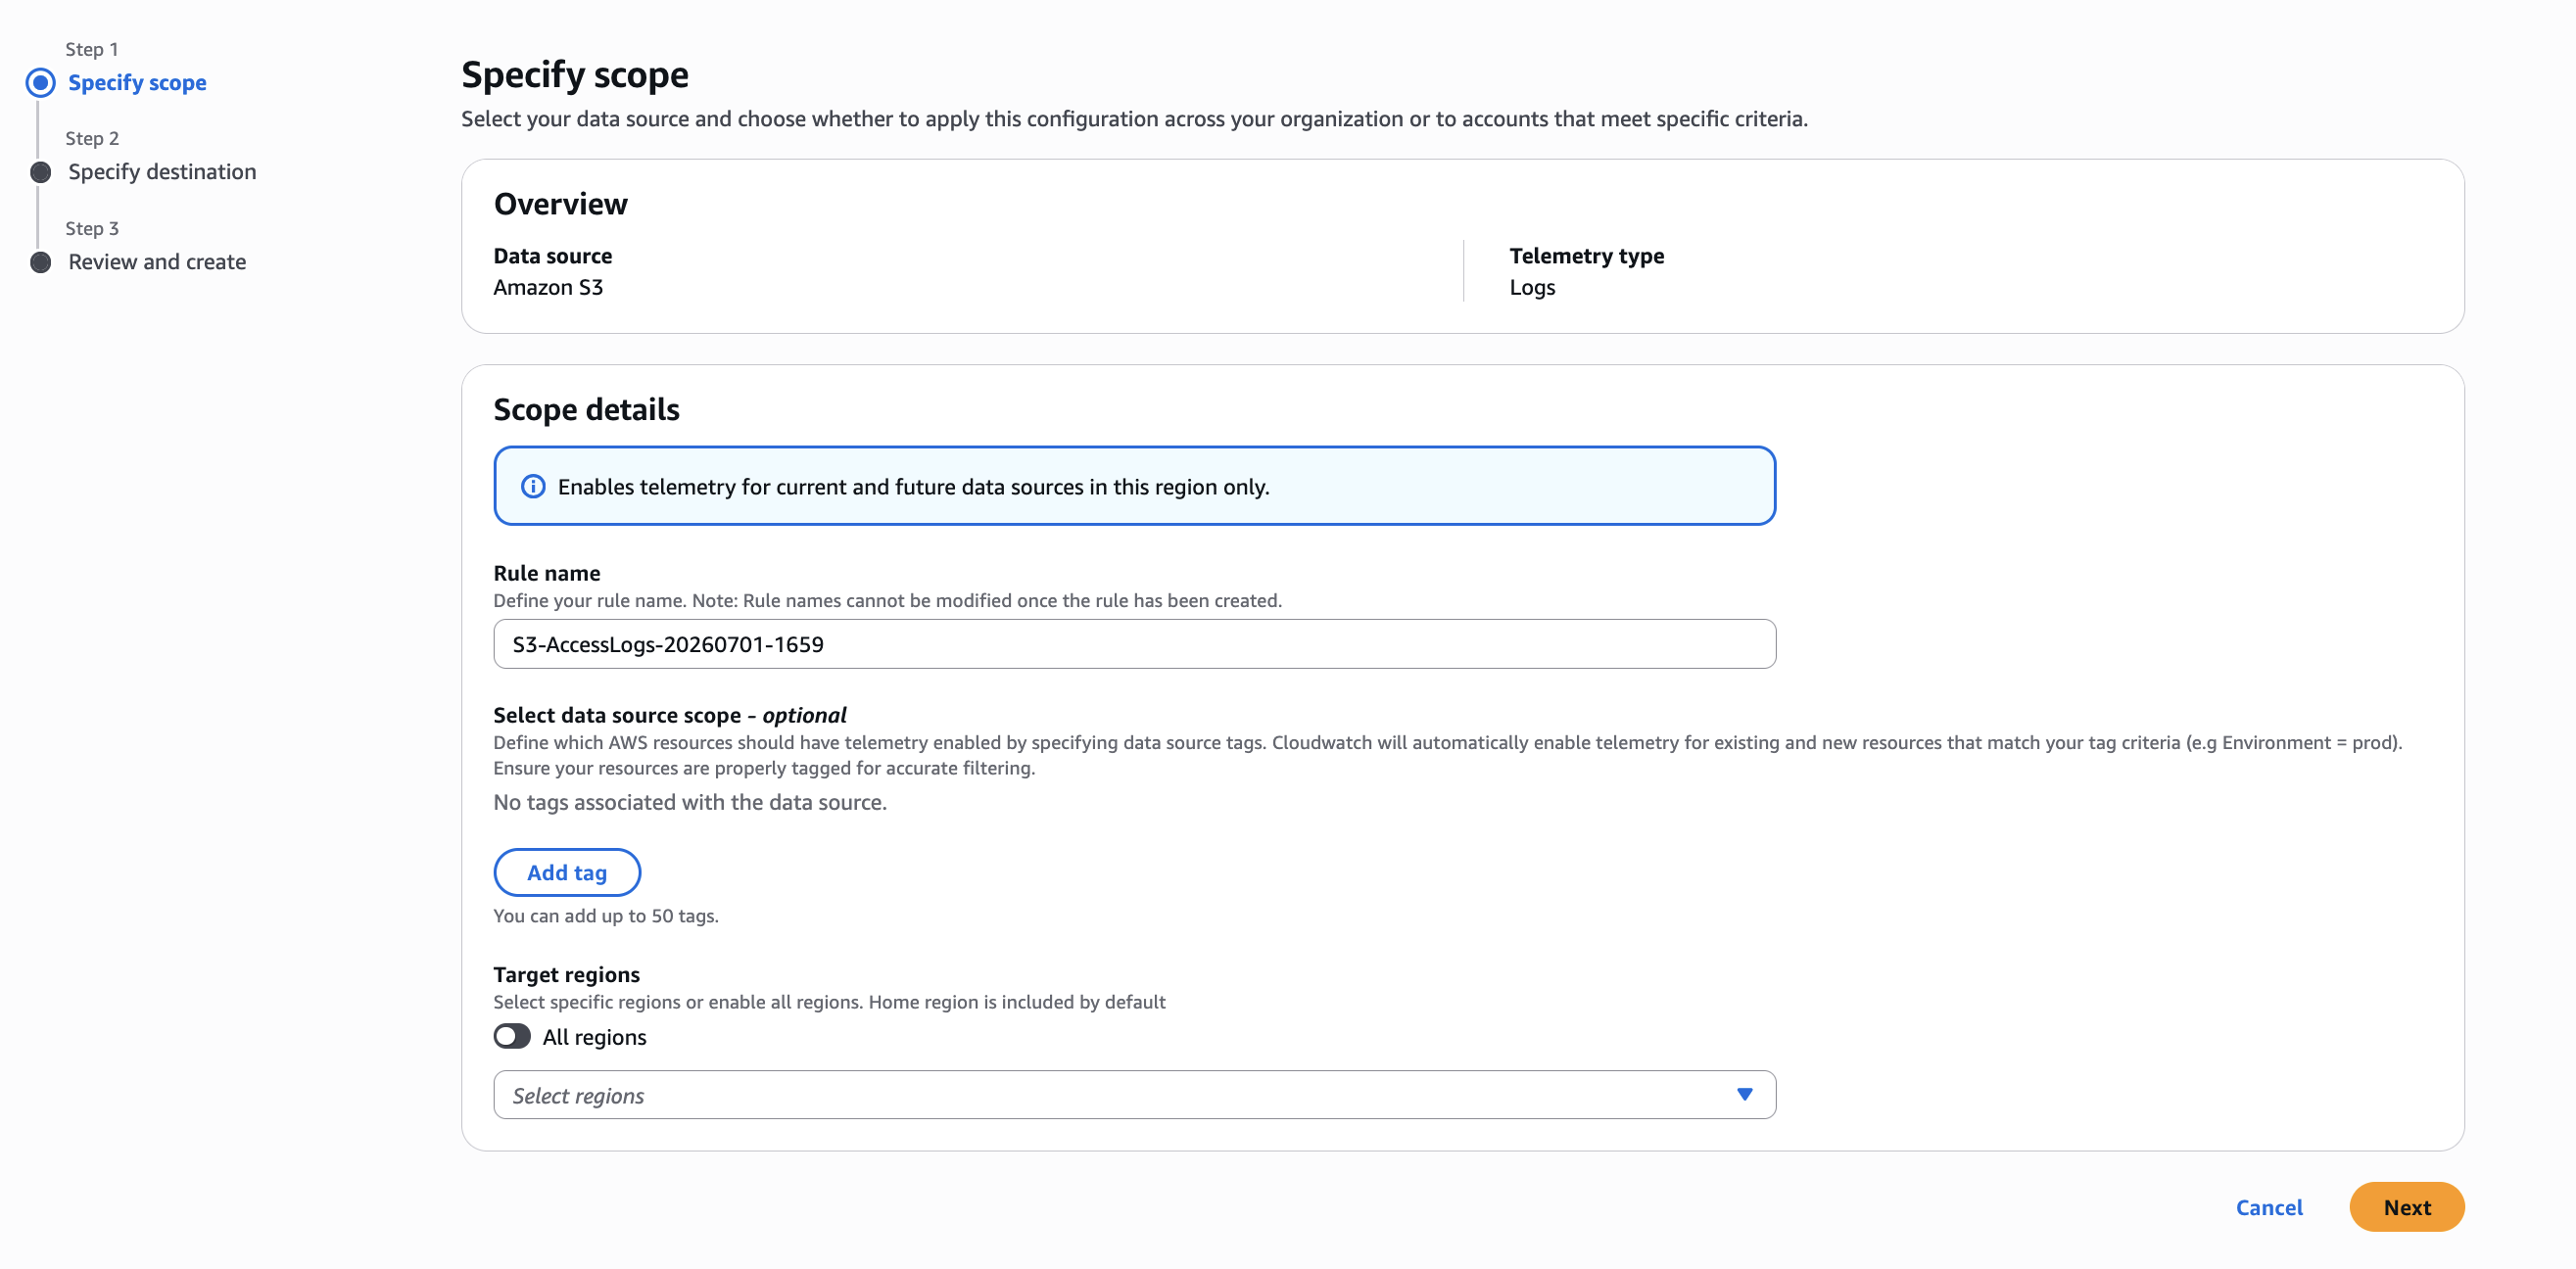
Figure 3: Specify scope configuration screen for Telemetry Enablement Rule
- On the Specify Destination page, configure the Log group name pattern and Retention setting. Then choose Next.
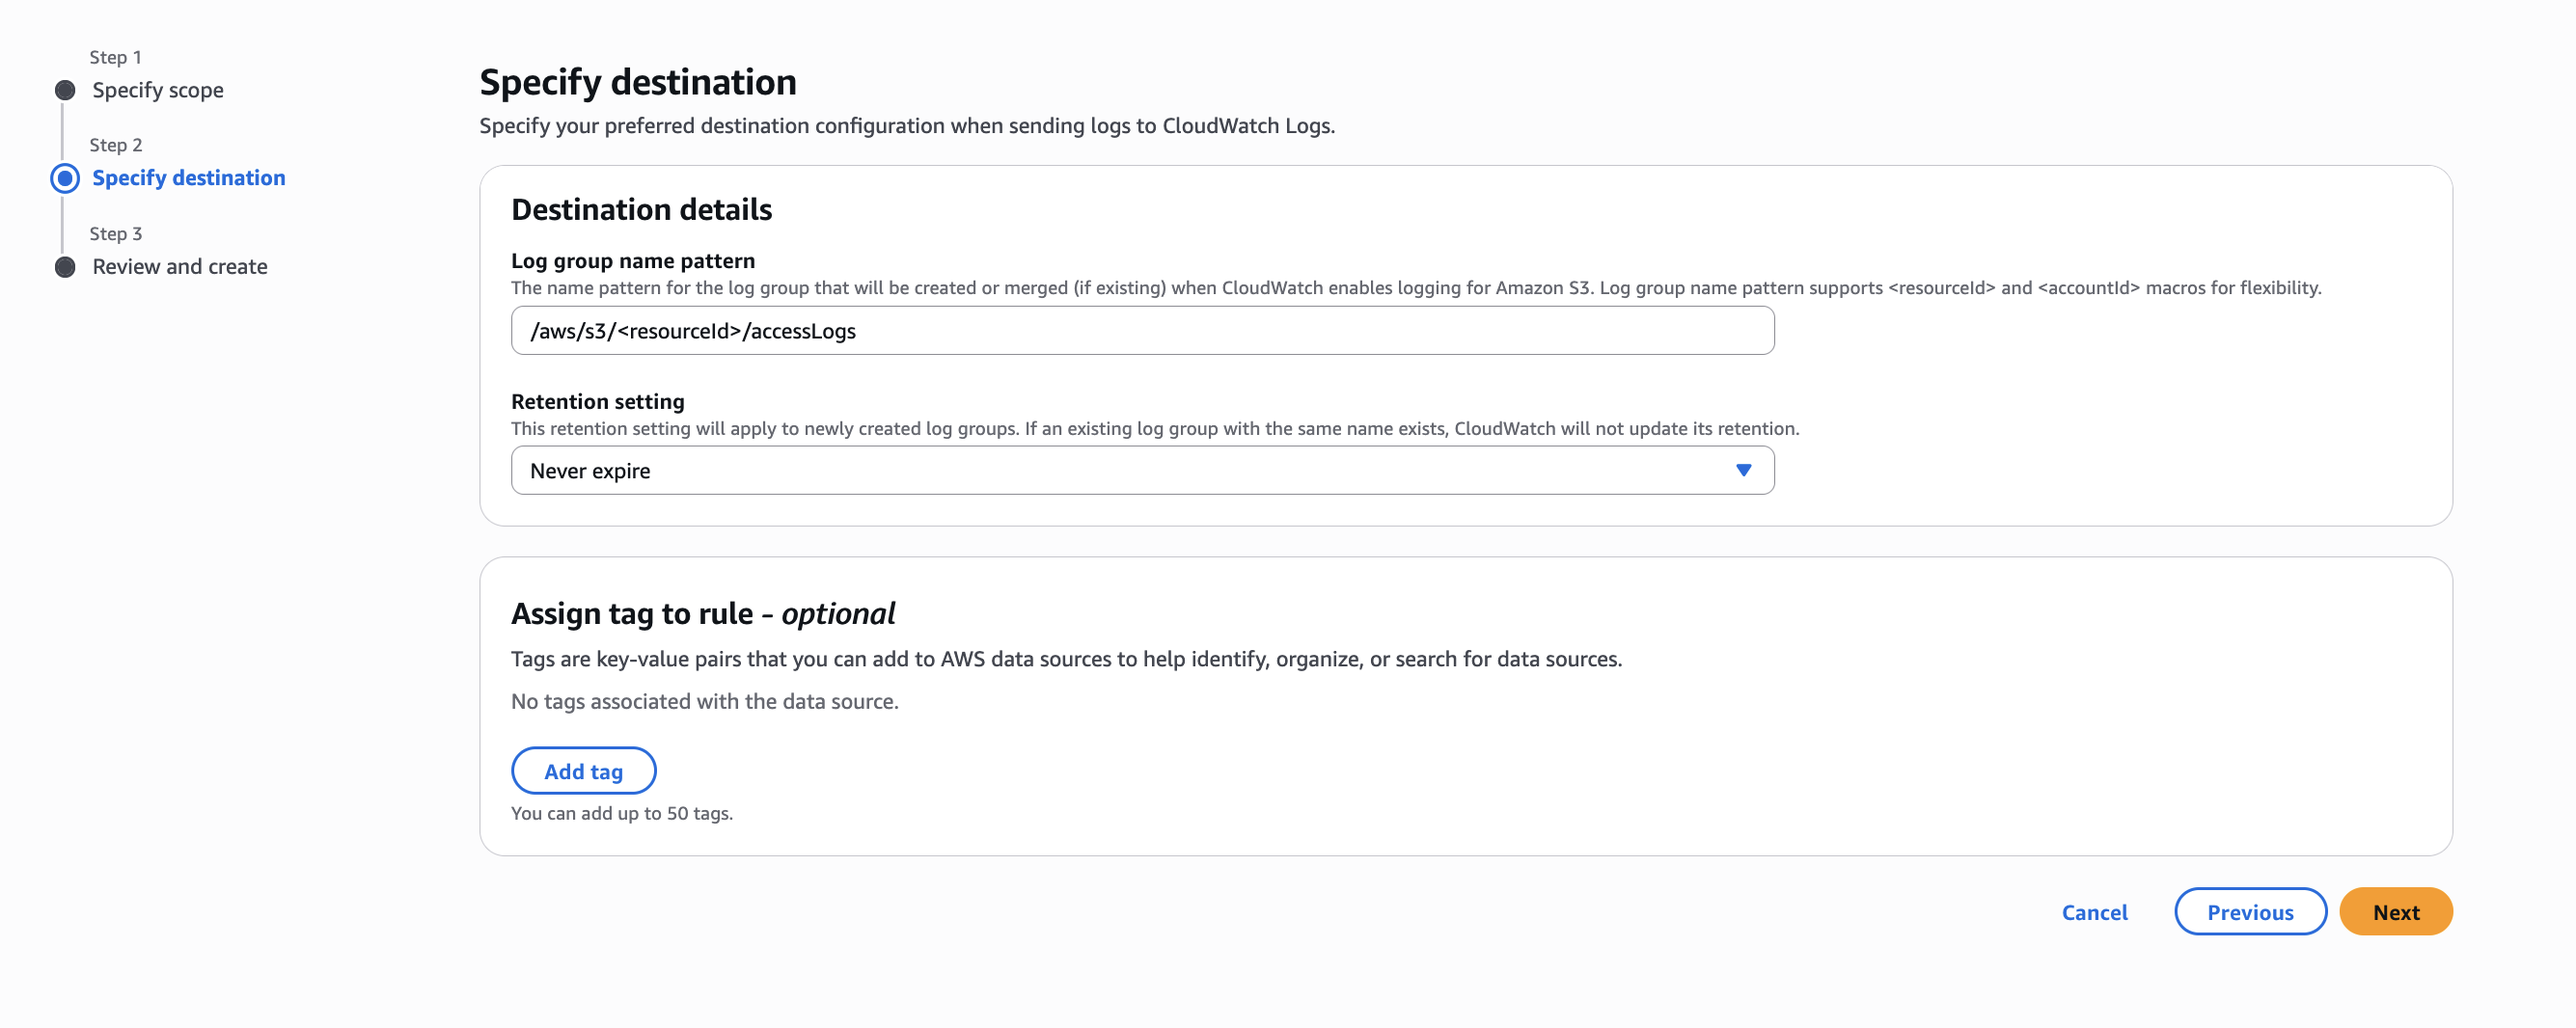
Figure 4: Specify destination configuration screen for Telemetry Enablement Rule
- On the Review and Create page, review the configuration settings and choose Configure Amazon S3 Logs.
Once the enablement rule is active, CloudWatch will begin ingesting Amazon S3 logs from resources within your account and region. The logs will be automatically transformed into structured JSON format and stored in a CloudWatch Logs log group.
Note that Amazon S3 server access logs are delivered on a best-effort basis, with most log records arriving within a few hours of the time they are recorded, but they can be delivered more frequently.
Important Considerations
- Enablement rules can be scoped at the organization, organizational unit, or account level, and can use tags to filter which resources the rule affects.
- The structured JSON transformation is performed automatically by CloudWatch with no additional Lambda functions or Glue jobs required.
- You can modify or delete enablement rules at any time. Note that updates only apply to Amazon S3 resources; existing telemetry settings remain unchanged for previously configured Amazon S3 resources.
- Amazon S3 server access logs ingested into CloudWatch are priced as CloudWatch Vended Logs. Vended logs benefit from volume-tiered pricing that reduces the per-GB cost as ingestion grows. For current rates, see Amazon CloudWatch pricing.
Centralizing Amazon S3 Server Access Logs Across Accounts
For organizations managing multiple AWS accounts, CloudWatch Logs centralization consolidates log data from multiple accounts and Regions into a central account. Rather than searching through multiple accounts during incidents, you can define centralization rules through AWS Organizations that automatically replicate Amazon S3 server access logs to a designated destination account. Once centralized, log groups are enriched with source account and Region identifiers (@aws.account and @aws.region), providing clear traceability while enabling your security team to query, create metric filters, and build dashboards across all accounts from a single location. To learn more, see Simplifying Log Management using Amazon CloudWatch Logs Centralization.
Transforming Amazon S3 Server Access Logs with CloudWatch Pipelines
CloudWatch Pipelines is a fully managed data collector that ingests, transforms, and routes log data without requiring you to manage infrastructure or third-party tools. For Amazon S3 server access logs, you can use CloudWatch Pipelines to transform your log data into the Open Cybersecurity Schema Framework (OCSF) format, enabling normalized security event data that is interoperable across security tools, data lakes, and compliance platforms. Built-in processors let you enrich, filter, and standardize logs as they flow through the pipeline, with output fully compatible with CloudWatch Logs features including Logs Insights queries and Anomaly Detection. CloudWatch Pipelines is included with CloudWatch Logs at no additional cost beyond standard ingestion and storage rates. To learn more, see CloudWatch Pipelines.
Querying Amazon S3 Access Logs with CloudWatch Logs Insights
Once your Amazon S3 server access logs are delivered into CloudWatch, you can begin querying them using CloudWatch Logs Insights with OpenSearch SQL syntax. Because CloudWatch Logs automatically transforms the raw log data into structured JSON, you can reference fields directly by name without any parsing logic.
- In CloudWatch console, click Logs in the left navigation.
- Choose Logs Insights.
- You’ll see the query editor interface.
- In the query editor, locate the Query language dropdown (bottom left).
- Select SQL from the dropdown.
- The query editor will switch to SQL mode.
- For Query scope, set Data source to be amazon_s3_server_access.
You can then paste the following SQL queries into the editor and choose Run query.
Use Case 1: Detecting Unauthorized Access Attempts
HTTP 403 and 404 spikes from a single IP address can indicate credential stuffing, object key enumeration, or brute-force access attempts. The following query identifies the top offending IPs:
This query surfaces IP addresses generating the highest number of failed requests, along with how many unique objects and buckets they targeted, a clear indicator of potential enumeration or brute-force activity.
Use Case 2: Detecting Unusual Data Transfer Patterns (Data Exfiltration)
Aggregating bytes downloaded per requester and IP reveals unusual download patterns that could indicate potentially exposed credentials or unauthorized data exfiltration:
This query helps identify requesters downloading unusually large volumes of data, which may warrant further investigation by your security team.
Continuous Monitoring with Metric Filters
While Logs Insights queries are powerful for ad-hoc investigation, CloudWatch Metric Filters enable continuous monitoring by emitting custom CloudWatch metrics from your log data. Each metric can drive a CloudWatch Alarm for automated alerting.
For security and compliance teams, metric filters bridge the gap between ad-hoc investigation and proactive detection. Instead of manually running queries to check for anomalies, you define the patterns once, and CloudWatch continuously monitors incoming S3 access log data for matches, emitting metrics and triggering alarms when thresholds are exceeded.
Creating a Metric Filter via Console
- Navigate to CloudWatch → Logs → Log Management.
- Choose the name of your Amazon S3 server access log group.
- Click the Metric filters tab.
- Click Create metric filter.
- Configure the filter pattern:
- Filter pattern: { $.http_status = 403 || $.http_status = 404 }
- Choose Next
- Configure the filter name and metric:
- Filter name: S3AccessLog403404Errors
- Metric namespace: S3ServerAccessLogs
- Metric name: S3AccessLog403404Errors
- Metric value: 1
- Choose Next.
- Review and choose Create metric filter.
Once created, you can configure a CloudWatch Alarm on the metric to receive notifications when thresholds are exceeded (e.g., more than 50 errors in a 5-minute window). Below are several examples of metric filters for common security and compliance use cases with Amazon S3 server access logs.
Metric Filter: S3 Server Errors (5xx)
This filter counts HTTP 5xx responses. A spike in 503 SlowDown errors may indicate request throttling, while other 5xx errors could indicate service issues.
Metric Filter: Anonymous/Unauthenticated S3 Requests
This filter detects anonymous requests where no credentials were presented. Any non-zero value warrants investigation as it typically indicates a bucket policy or ACL granting public access.
Identifying Top Contributors with Contributor Insights
CloudWatch Contributor Insights continuously analyzes your log data to rank the top-N contributors to a particular pattern. For Amazon S3 server access logs, this is invaluable for identifying which IPs, requesters, or buckets are generating the most activity as logs are delivered. The following steps walk through creating a Contributor Insights rule. You can modify these steps using the example rule configurations provided later in this section.
Creating a Contributor Insights Rule via Console
- Navigate to CloudWatch → Logs → Contributor Insights.
- Choose Create rule.
- For Select log group(s), select your Amazon S3 server access log group.
- For Rule type, choose Custom rule.
- For Log format, select JSON.
- Configure the Contribution key (e.g., remote_ip),
- Filters (e.g., http_status IN [403, 404]),
- Aggregation (e.g., COUNT(*)).
- Choose Next.
- Enter a Rule name and choose to enable the rule.
- Choose Create rule.
Contributor Insights rules process log data as it is delivered and can be added directly to CloudWatch Dashboards for ongoing visibility. Below are several examples of Contributor Insights rules that cover various use cases around security.
Rule 1: Top IPs Generating 403/404 Errors (example above)
This rule continuously tracks which IP addresses are generating the most access denied and not found errors, providing visibility into potential unauthorized users or misconfigured clients.
Rule 2: Top Requesters by Data Volume Downloaded
This rule identifies who is downloading the most data from your buckets helping you identify potential data exfiltration patterns.
Bringing It All Together with CloudWatch Dashboards
CloudWatch Dashboards provide a unified visualization layer that brings together all the monitoring components described above into a single pane of glass. By combining Metric Filter alarms, Contributor Insights widgets, and Logs Insights query visualizations, you can build a comprehensive Amazon S3 Security, Compliance & Audit Dashboard that gives your security and compliance teams a single destination to monitor Amazon S3 access patterns, investigate anomalies, and validate compliance posture across all monitored buckets.
Cleanup
If you created resources while following this blog post and no longer need them, make sure to clean up to avoid unnecessary charges:
- If you created a telemetry enablement rule, navigate to Telemetry config in the CloudWatch console, choose the Enablement rules tab, select the rule, and choose Delete.
- If you created metric filters, navigate to Log Management in the CloudWatch console, choose your log group and the Metric Filters tab, select the rule, and choose Delete.
- If you created metric filters, navigate to Contributor Insights in the CloudWatch console, select the rule, and choose Delete.
- Delete the CloudFormation stack for the Amazon S3 Security, Compliance & Audit Dashboard that was deployed.
Conclusion
In this blog post, we showed how Amazon S3 server access logs, delivered as CloudWatch Vended Logs into CloudWatch unified data store, provide a cost-effective, HTTP-level view of requests made to your Amazon S3 buckets without custom ETL pipelines or destination bucket management. We demonstrated a deployable Security, Compliance & Audit Dashboard, walked through enabling ingestion with Telemetry Enablement Rules, and explored security analytics with CloudWatch Logs Insights queries, Metric Filters for threshold-based alerting, and Contributor Insights rules for top-N contributor analysis.
With Amazon S3 server access logs now available as a native CloudWatch data source, CloudWatch serves as a unified observability platform where your S3 access data is ready to query, filter, and act on without additional infrastructure once logs are delivered. To get started, deploy the provided CloudFormation template and begin monitoring your Amazon S3 access patterns today.