Monitoring systems are essential for a resilient solution. A popular tool to monitor Linux-based physical or virtual machines is collectd – a daemon to collect system and application performance metrics periodically. However, collectd doesn’t provide long-term storage for metrics, rich querying, visualization, or an alerting solution. The Amazon Managed Service for Prometheus is a serverless monitoring service for metrics compatible with open-source Prometheus. Amazon Managed Grafana is a fully managed service with rich, interactive data visualizations to help customers analyze, monitor, and alarm on metrics, logs, and traces across multiple data sources.
This post describes how partners and customers can view metrics from a running instance of collectd on a Linux-based Amazon Elastic Compute Cloud (Amazon EC2) instance. The metrics can be stored and queried with Amazon Managed Service for Prometheus. The metrics can be visualized with Amazon Managed Service for Grafana. Further, customers and partners can build alerting mechanisms using either Amazon Managed Service for Prometheus or Amazon Managed Service for Grafana. This can help partners and customers move their existing or create new monitoring workloads in a cloud-native fashion.
Solution overview
The following figure demonstrates how this post utilizes the Prometheus official exporter – collectd_exporter – from Prometheus to collect metrics from the collectd daemon. Then, the Prometheus server scrapes metrics from collectd_exporter and writes to the Amazon Managed Service for Prometheus instance. The Amazon Managed Service for Grafana instance will connect to Amazon Managed Service for Prometheus and host the dashboards for visualization.
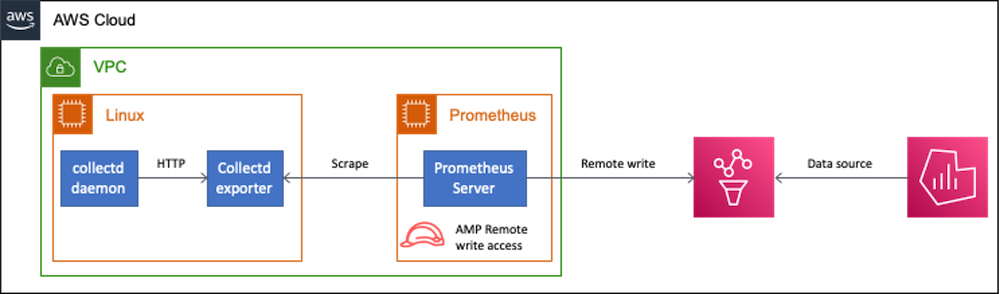
Install the collectd daemon, collectd_exporter, and Prometheus server on the same machine for this post. Configure the Prometheus server to write to an Amazon Managed Service for Prometheus workspace remotely. For this to happen, configure the Amazon EC2 instance with an AWS Identity and Access Management (IAM) Role that has the AmazonPrometheusRemoteWriteAccess policy. A YAML file with Prometheus recording rules is uploaded to the Amazon Managed Service for Prometheus workspace to generate the average values of metrics over a five-minute duration.
Configure the Amazon Managed Service for Grafana workspace to use the Amazon Managed Service for Prometheus workspace as the data source. The Amazon Managed Service for Grafana workspace will have dashboards to display the metrics.
Walkthrough
Implement this solution using the following overview. It uses a Ubuntu Linux-based Amazon EC2 instance for testing purposes, though any Linux-based device is acceptable.
- Install
collectd.
- Configure collectd to write metrics via HTTP to
collectd_exporter.
- Install
collectd_exporter.
- Launch the Amazon Managed Service for Prometheus instance.
- Install Prometheus server.
- Configure the Prometheus server to write to the Amazon Managed Service for Prometheus instance.
- Add Prometheus recording rules in Amazon Managed Service for Prometheus.
- Launch Amazon Managed Service for Grafana instance.
- Import JSON to view metrics.
Prerequisites
Complete the following perquisites before starting this walkthrough:
- Create an AWS account
- Create a Linux-based Amazon EC2 instance using Ubuntu or another on any third-party software or hardware.
Install collectd
The preferred way to install collectd is to use a package manager. Installation through compilation is also an option. However, this is out of the scope of this post.
- Connect to your Linux instance using Session Manager.
- Run the following commands:
sudo apt-get update
sudo apt-get install -y collectd
Configure collectd
- Back-up the configuration file with the following command:
sudo cp /etc/collectd/collectd.conf /etc/collectd/collectd.conf.old
- Copy the following configuration into /etc/collectd/collectd.conf
FQDNLookup true
Interval 10
LoadPlugin syslog
<Plugin syslog>
    LogLevel info
</Plugin>
LoadPlugin df
LoadPlugin cpu
LoadPlugin memory
LoadPlugin csv
LoadPlugin write_http
<Plugin "cpu">
    ValuesPercentage true
</Plugin>
<Plugin "df">
    IgnoreSelected false
    MountPoint "/"
</Plugin>
<Plugin "csv">
  DataDir "/var/lib/collectd/csv"
  StoreRates true
</Plugin>
<Plugin write_http>
  <Node "collectd_exporter">
    URL "http://localhost:9103/collectd-post"
    Format "JSON"
    StoreRates false
  </Node>
</Plugin>
The above configuration file does the following:
- Loads the input plugins df, cpu, and memory. These plugins do the following:
a. df – Collects file system usage information.
b. cpu – Collects CPU usage.
c. memory – Collects memory usage.
- Loads the logging plugin syslog that writes debug and status information to syslog. This plugin helps monitor collectd.
- Load the output plugins csv and http_write. The csv plugin is optional, as it helps confirm the metrics gathered on the host system. The http_write plugin will write to the collectd_exporter.
- Configure the http_write plugin to write to collectd_exporter at http://localhost:9103/collectd-post
The collectd wiki maintains a list of available collectd plugins.
Restart collectd
- Restart collectd with the following command:
sudo /etc/init.d/collectd restart
- Verify by looking at the logs at
/var/log/syslog. Here is a sample output:
Mar  3 05:31:27 ip-172-xxx-xxx-xxx systemd[1]: Stopped Statistics collection and monitoring daemon.
Mar  3 05:31:27 ip-172-xxx-xxx-xxx systemd[1]: Starting Statistics collection and monitoring daemon...
Mar  3 05:31:27 ip-172-xxx-xxx-xxx collectd[23257]: plugin_load: plugin "df" successfully loaded.
Mar  3 05:31:27 ip-172-xxx-xxx-xxx collectd[23257]: plugin_load: plugin "cpu" successfully loaded.
Mar  3 05:31:27 ip-172-xxx-xxx-xxx collectd[23257]: plugin_load: plugin "memory" successfully loaded.
Mar  3 05:31:27 ip-172-xxx-xxx-xxx collectd[23257]: plugin_load: plugin "csv" successfully loaded.
Mar  3 05:31:27 ip-172-xxx-xxx-xxx collectd[23257]: plugin_load: plugin "http_write" successfully loaded.
Mar  3 05:31:27 ip-172-xxx-xxx-xxx collectd[23257]: Systemd detected, trying to signal readiness.
Mar  3 05:31:27 ip-172-xxx-xxx-xxx collectd[23257]: Initialization complete, entering read-loop.
Mar  3 05:31:27 ip-172-xxx-xxx-xxx systemd[1]: Started Statistics collection and monitoring daemon.
- Collected metrics can be viewed in the
/var/lib/collectd/csv folder.
Install collectd_exporter
On the GitHub page for collectd_exporter, the installation instruction refers to running a Docker image. However, this isn’t mandatory. This section describes building and running the collectd_exporter binary for the Linux instance.
- Open a new terminal window.
- Connect to your Linux instance using Session Manager.
- Install Go with the following commands:
export GO_VERSION=17.7
curl -OL https://go.dev/dl/go1.${GO_VERSION}.linux-amd64.tar.gz
sudo tar -C /usr/local -xvf go1.${GO_VERSION}.linux-amd64.tar.gz
export PATH=$PATH:/usr/local/go/bin
- Build collectd_exporter with the following commands:
git clone https://github.com/prometheus/collectd_exporter
cd collectd_exporter
export DOCKER_ARCHS=amd64
make
export PATH=$PATH:$HOME/collectd_exporter
Launch collectd_exporter
- Launch collectd_exporter with the following command:
collectd_exporter
- These are the logs:
level=info ts=2022-03-04T01:34:03.304Z caller=main.go:323 msg="Starting collectd_exporter" version="(version=0.5.0, branch=master, revision=f81b12fc801d98bb3dcfa11aec4e03f9bbb31e29)"
level=info ts=2022-03-04T01:34:03.304Z caller=main.go:324 msg="Build context" context="(go=go1.17.7, user=ubuntu@ip-172-31-22-27, date=20220303-05:21:09)"
level=info ts=2022-03-04T01:34:03.304Z caller=main.go:346 msg="Listening on address" address=:9103
level=info ts=2022-03-04T01:34:03.304Z caller=tls_config.go:191 msg="TLS is disabled." http2=false
Note the port number that the exporter is listening on – it is 9103. This is configured when launching collectd earlier.
Launch Amazon Managed Service for Prometheus workspace
- Create the Amazon Managed Service for Prometheus workspace.
- Copy the workspace ID from Step 1. The section for configuring the Prometheus server will use the workspace ID.
- Create an IAM role with the AmazonPrometheusRemoteWriteAccess policy and attach the role to the Amazon EC2 instance.
- Add the following into YAML file named collectd-prometheus.yaml, and upload it to the workspace created.
groups:
  - name: collectd
    rules:
    - record: metric:collectd_df_GB
      expr: collectd_df_df_complex/1000000000
    - record: metric:collectd_avg_df_GB
      expr: sum(rate(metric:collect_df_GB[5m])) by (type)
    - record: metric:collectd_memory_GB
      expr: collectd_memory/1000000000
    - record: metric:collectd_avg_memory_GB
      expr: sum(rate(collectd_memory_GB[5m])) by (memory)
    - record: metric:collectd_cpu_percent
      expr: sum(rate(collectd_cpu_percent[5m])) by (cpu, type)
Install Prometheus server
- Open a new terminal window.
- Connect to your Linux instance using Session Manager.
- Run the following commands to install the Prometheus server:
export PROMETHEUS_VERSION=2.34.0
curl -OL https://github.com/prometheus/prometheus/releases/download/v${PROMETHEUS_VERSION}-rc.0/prometheus-${PROMETHEUS_VERSION}-rc.0.linux-amd64.tar.gz
tar xvzf prometheus-${PROMETHEUS_VERSION}-rc.0.linux-amd64.tar.gz
export PATH=$PATH:$HOME/prometheus-${PROMETHEUS_VERSION}-rc.0.linux-amd64
Configure Prometheus server
- On the Amazon EC2 instance, create a configuration file named prometheus.yaml using the following content. Change regionId as applicable. Change workspaceId with the workspace ID from the section on launching the Amazon Managed Service for Prometheus workspace.
global:
  scrape_interval: 15s
  external_labels:
    monitor: 'collectd_exporter'

scrape_configs:
  - job_name: 'collectd_exporter'
    static_configs:
      - targets: ['localhost:9103']

remote_write:
  -
    url: https://aps-workspaces.<regionId>.amazonaws.com/workspaces/<workspace Id>/api/v1/remote_write
    queue_config:
        max_samples_per_send: 1000
        max_shards: 200
        capacity: 2500
    sigv4:
        region: <regionId>
This configuration file has a scraping target set as localhost:9103 because the collectd_exporter exposes a metrics end-point here.
Launch Prometheus server
- Return to the terminal for launching where Prometheus.
- Launch the Prometheus server with the
prometheus.yaml configuration file created previously using the following commands:
export PROMETHEUS_VERSION=2.34.0
export PATH=$PATH:$HOME/prometheus-${PROMETHEUS_VERSION}-rc.0.linux-amd64
prometheus --config.file=prometheus.yaml
The console should show output similar to this to indicate that the Prometheus server successfully connects to Amazon Managed Service for Prometheus
ts=2022-03-04T01:12:25.394Z caller=dedupe.go:112 component=remote level=info remote_name=4b1ae2 url=https://aps-workspaces.regionId.amazonaws.com/workspaces/workspaceId/api/v1/remote_write msg="Starting WAL watcher" queue=4b1ae2
ts=2022-03-04T01:12:25.394Z caller=dedupe.go:112 component=remote level=info remote_name=4b1ae2 url=https://aps-workspaces.regionId.amazonaws.com/workspaces/workspaceId/api/v1/remote_write msg="Starting scraped metadata watcher"
ts=2022-03-04T01:12:25.394Z caller=dedupe.go:112 component=remote level=info remote_name=4b1ae2 url=https://aps-workspaces.regionId.amazonaws.com/workspaces/workspaceId/api/v1/remote_write msg="Replaying WAL" queue=4b1ae2
Launch Grafana workspace
- Create a workspace.
- Define user access.
Add Prometheus data source
- Add the Amazon Managed Service for Prometheus data source.
Create dashboard
- Create a new dashboard with the Import option.
- Upload the following JSON document:
{"__inputs":[],"__requires":[{"type":"grafana","id":"grafana","name":"Grafana","version":"8.2.5"},{"type":"panel","id":"timeseries","name":"Time series","version":""}],"annotations":{"list":[{"builtIn":1,"datasource":"-- Grafana --","enable":true,"hide":true,"iconColor":"rgba(0, 211, 255, 1)","name":"Annotations & Alerts","target":{"limit":100,"matchAny":false,"tags":[],"type":"dashboard"},"type":"dashboard"}]},"editable":true,"fiscalYearStartMonth":0,"gnetId":null,"graphTooltip":0,"id":null,"links":[],"liveNow":true,"panels":[{"datasource":null,"fieldConfig":{"defaults":{"color":{"mode":"palette-classic"},"custom":{"axisLabel":"","axisPlacement":"auto","barAlignment":0,"drawStyle":"line","fillOpacity":0,"gradientMode":"none","hideFrom":{"legend":false,"tooltip":false,"viz":false},"lineInterpolation":"linear","lineWidth":1,"pointSize":5,"scaleDistribution":{"type":"linear"},"showPoints":"auto","spanNulls":false,"stacking":{"group":"A","mode":"none"},"thresholdsStyle":{"mode":"off"}},"mappings":[],"thresholds":{"mode":"absolute","steps":[{"color":"green","value":null},{"color":"red","value":80}]}},"overrides":[]},"gridPos":{"h":7,"w":24,"x":0,"y":0},"id":6,"options":{"legend":{"calcs":[],"displayMode":"list","placement":"bottom"},"tooltip":{"mode":"single"}},"targets":[{"exemplar":true,"expr":"metric:collectd_cpu_percent","interval":"","legendFormat":"CPU-{{cpu}} {{type}}","refId":"A"}],"title":"CPU (%)","type":"timeseries"},{"datasource":null,"fieldConfig":{"defaults":{"color":{"mode":"palette-classic"},"custom":{"axisLabel":"","axisPlacement":"auto","barAlignment":0,"drawStyle":"line","fillOpacity":0,"gradientMode":"none","hideFrom":{"legend":false,"tooltip":false,"viz":false},"lineInterpolation":"linear","lineWidth":1,"pointSize":5,"scaleDistribution":{"type":"linear"},"showPoints":"auto","spanNulls":false,"stacking":{"group":"A","mode":"none"},"thresholdsStyle":{"mode":"off"}},"mappings":[],"thresholds":{"mode":"absolute","steps":[{"color":"green","value":null},{"color":"red","value":80}]}},"overrides":[]},"gridPos":{"h":7,"w":24,"x":0,"y":7},"id":4,"options":{"legend":{"calcs":[],"displayMode":"list","placement":"bottom"},"tooltip":{"mode":"single"}},"targets":[{"exemplar":true,"expr":"metric:collectd_memory_GB","interval":"","legendFormat":"{{memory}}","refId":"A"}],"title":"RAM (GB)","type":"timeseries"},{"datasource":null,"fieldConfig":{"defaults":{"color":{"mode":"palette-
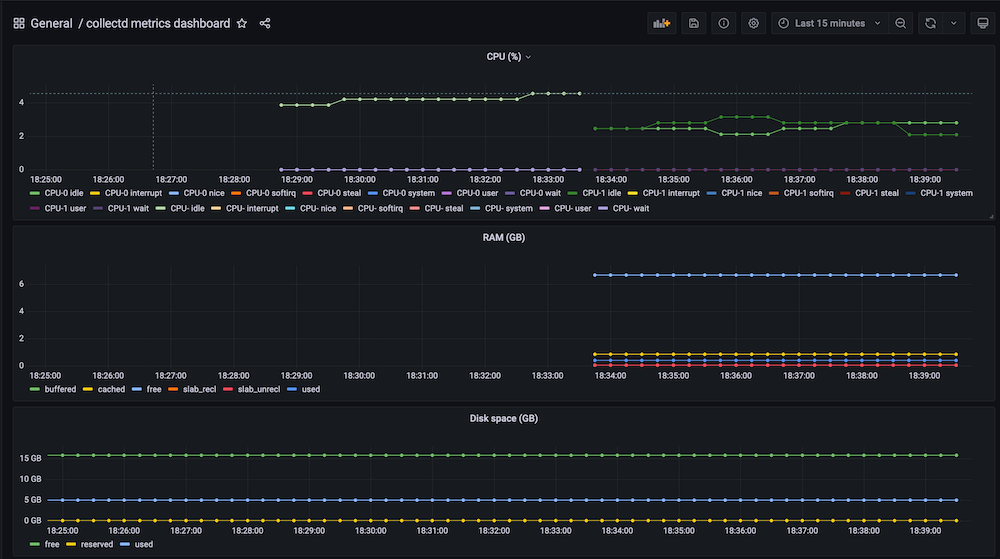
Launch the following dashboard to visualize:
- CPU utilization is based on CPU number and utilization type.
- RAM utilization is based on utilization type.
- Disk space utilization is based on utilization type.
Cleaning up
To avoid incurring future charges, delete the following resources:
- Delete Grafana workspace.
- Delete Prometheus workspace.
- Terminate the Amazon EC2 instance.
- Remove the IAM policy.
Conclusion
This post describes a means to launch collectd daemon on an Amazon EC2 Linux instance to gather system metrics. These metrics are ingested into Amazon Managed Service for Prometheus for long-term storage and querying. Finally, the ingested metrics are used in Amazon Managed Service for Grafana to visualize metrics. Depending on the requirements, different plugins of collectd may be installed and configured. Furthermore, configure Amazon Managed Service for Prometheus and Amazon Managed Service for Grafana to raise required alerts.
Author: