AWS Cloud Operations Blog
Tag: grafana

Viewing collectd statistics with Amazon Managed Service for Prometheus and Amazon Managed Service for Grafana
Monitoring systems are essential for a resilient solution. A popular tool to monitor Linux-based physical or virtual machines is collectd – a daemon to collect system and application performance metrics periodically. However, collectd doesn’t provide long-term storage for metrics, rich querying, visualization, or an alerting solution. The Amazon Managed Service for Prometheus is a serverless […]
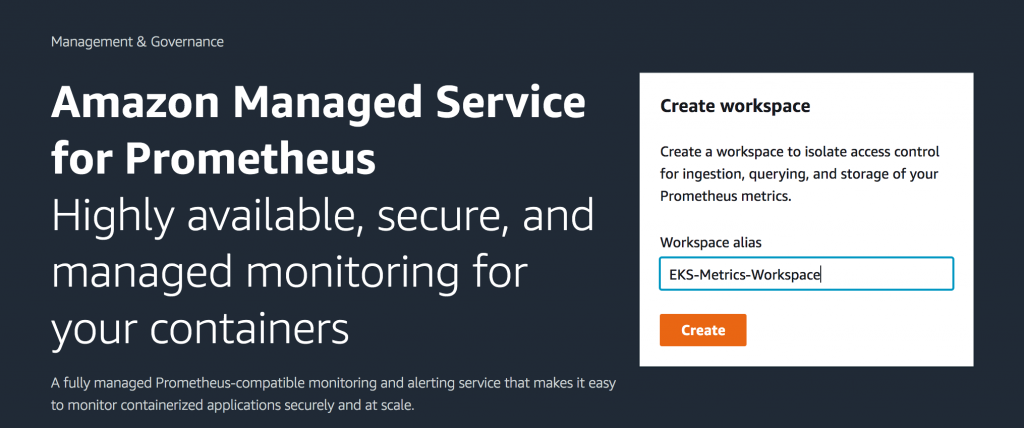
Getting Started with Amazon Managed Service for Prometheus
4/9/2021 – Updated the Prometheus server deployment setup part by removing the AWS SigV4 side-car proxy container. This is no longer needed as the Prometheus server now directly signs requests made to the AMP remote write API. Amazon Managed Service for Prometheus (AMP) is a Prometheus-compatible monitoring service for container infrastructure and application metrics for […]

Amazon Managed Grafana – Getting Started
September 8, 2021: Amazon Elasticsearch Service has been renamed to Amazon OpenSearch Service. See details. Amazon Managed Grafana is a fully managed and secure data visualization service that enables customers to instantly query, correlate, and visualize operational metrics, logs, and traces for their applications from multiple data sources. Amazon Managed Grafana is based on the […]

Analyze and debug applications using AWS X-Ray trace data with Grafana
Today, AWS and Grafana Labs are making available a free and open-source AWS X-Ray data source plugin. You can use the latest release of Grafana (version 7.2.0 or later) to visualize AWS X-Ray traces directly in your Grafana dashboards in order to triage performance issues in applications instrumented with X-Ray. This enables you to build a single […]