April 16, 2021: This article has been updated to reflect changes introduced by AWS Signature Version 4 support on Prometheus server.
We recently announced Amazon Managed Service for Prometheus (AMP) that allows you to create a fully managed, secure, Prometheus-compatible environment to ingest, query, and store Prometheus metrics. In a previous blog post from the AWS Management & Governance Blog, we explained how you could set up the service to monitor containerized environments. For some critical use-cases, containerization is too far ahead or sometimes not even possible.
In this article, we’ll demonstrate how you can use AMP for those systems running on Amazon Elastic Compute Cloud (Amazon EC2) or on-premises environments.
Setup
In this example, we walk through the following steps:
- Set up an Amazon EC2 instance running Amazon Linux.
- Run a demo application written in Go that exposes a Prometheus endpoint under
/metrics using the Prometheus client library.
- Create an Amazon Prometheus Service (AMP) workspace.
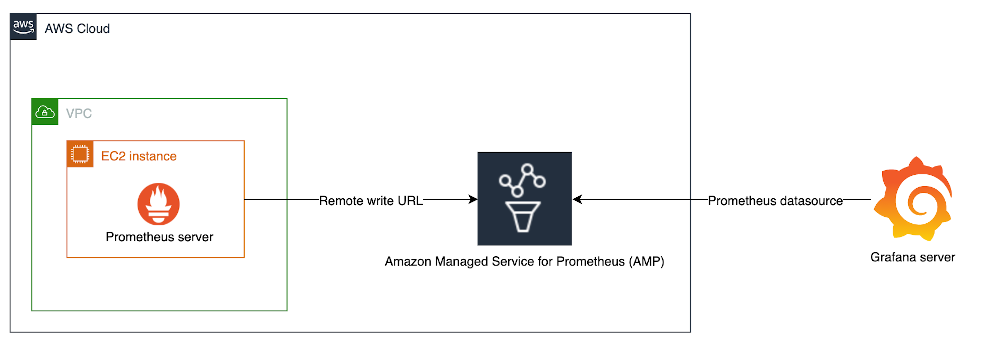
- Run a Prometheus server to export the application metrics to AMP through the proxy.
- Configure a Grafana server on a remote desktop to query our AMP workspace. You can also use our recently announced Amazon Managed Service for Grafana to query AMP.
The corresponding architecture can be visualized as follows:
In this example, we’ve select the Ireland (eu-west-1) region. Please visit the AWS Regional Service List to see AWS Regions supported by the service.
Amazon EC2 setup
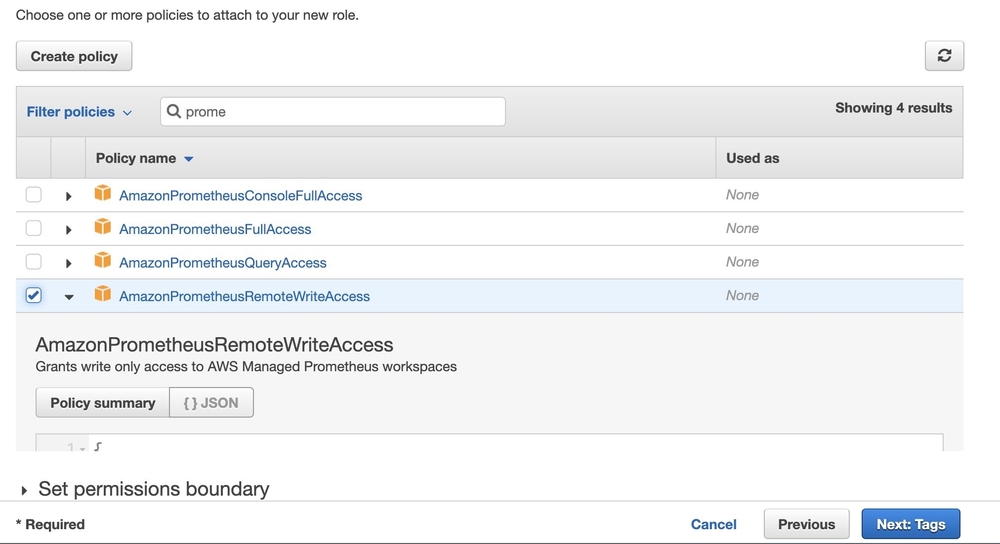
The first step in this walkthrough is to set up an EC2 instance, which will host our application and forward its metrics to the AMP workspace that we’ll create later on. We recommend using IAM roles attached to the instance, to which we can attach the policy AmazonPrometheusRemoteWriteAccess to provide the instance with the bare minimum permissions.
Demo application
Once the instance is configured, we can log in to our instance and run a sample application. Create a file named main.go and add the content shown below. Use the Prometheus http handler to auto-expose few system metrics via HTTP. You can implement your own metrics using the Prometheus client library.
package main

import (
    "github.com/prometheus/client_golang/prometheus/promhttp"
    "net/http"
)

func main() {
    http.Handle("/metrics", promhttp.Handler())

    http.ListenAndServe(":8000", nil)
}
Before running our sample application, let’s make sure we have all the dependencies installed.
sudo yum update -y
sudo yum install -y golang
go get github.com/prometheus/client_golang/prometheus/promhttp
go run main.go
The application should be up and running on port 8000. At this stage, we should be able to see all Prometheus metrics exposed by the application:
curl -s http://localhost:8000/metrics

...
process_max_fds 4096
# HELP process_open_fds Number of open file descriptors.
# TYPE process_open_fds gauge
process_open_fds 10
# HELP process_resident_memory_bytes Resident memory size in bytes.
# TYPE process_resident_memory_bytes gauge
process_resident_memory_bytes 1.0657792e+07
# HELP process_start_time_seconds Start time of the process since unix epoch in seconds.
# TYPE process_start_time_seconds gauge
process_start_time_seconds 1.61131955899e+09
# HELP process_virtual_memory_bytes Virtual memory size in bytes.
# TYPE process_virtual_memory_bytes gauge
process_virtual_memory_bytes 7.77281536e+08
# HELP process_virtual_memory_max_bytes Maximum amount of virtual memory available in bytes.
# TYPE process_virtual_memory_max_bytes gauge
process_virtual_memory_max_bytes -1
# HELP promhttp_metric_handler_requests_in_flight Current number of scrapes being served.
# TYPE promhttp_metric_handler_requests_in_flight gauge
promhttp_metric_handler_requests_in_flight 1
# HELP promhttp_metric_handler_requests_total Total number of scrapes by HTTP status code.
# TYPE promhttp_metric_handler_requests_total counter
promhttp_metric_handler_requests_total{code="200"} 1
promhttp_metric_handler_requests_total{code="500"} 0
promhttp_metric_handler_requests_total{code="503"} 0
Create an AMP workspace
To create a workspace, simply open AMP on the AWS Console and enter the name of the workspace.
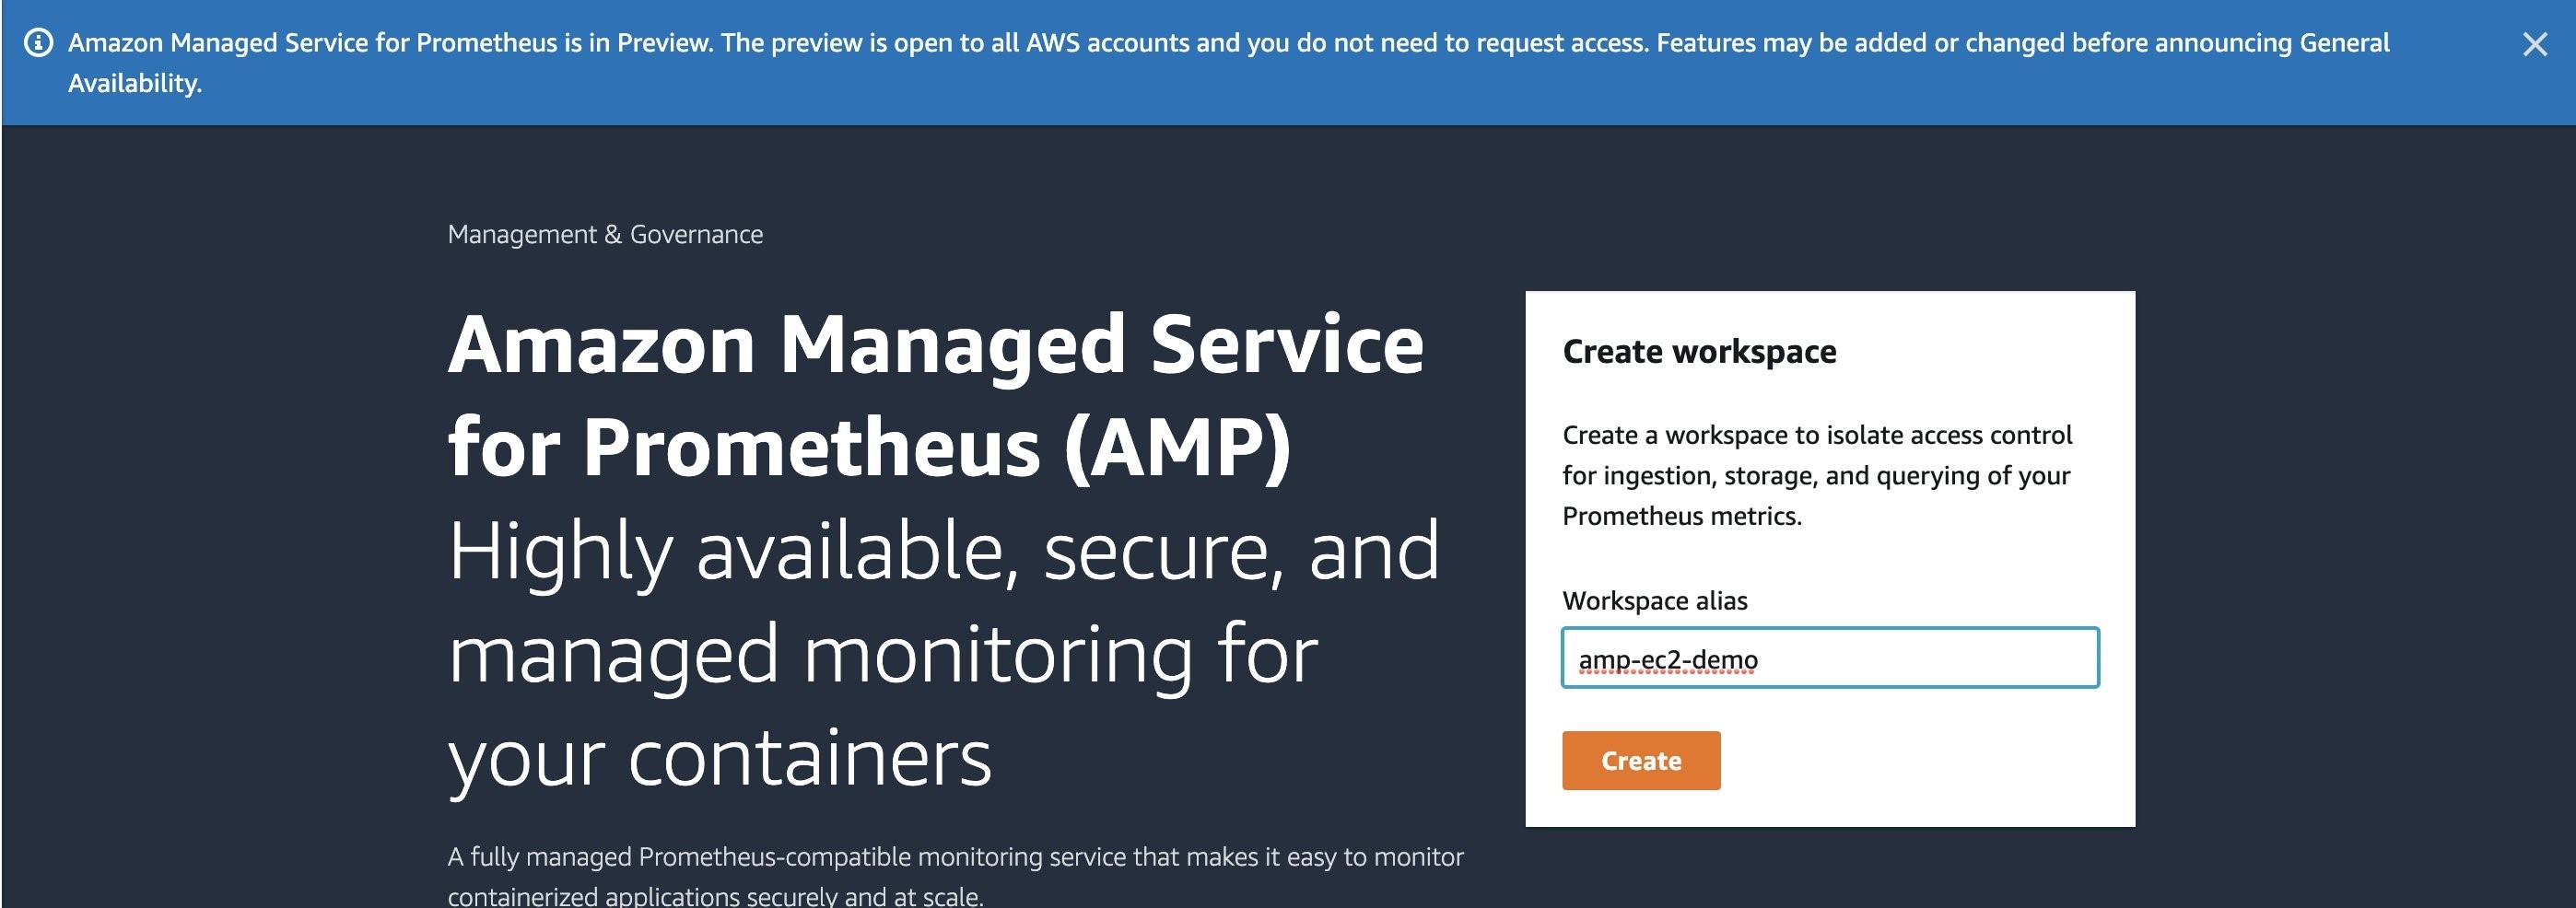
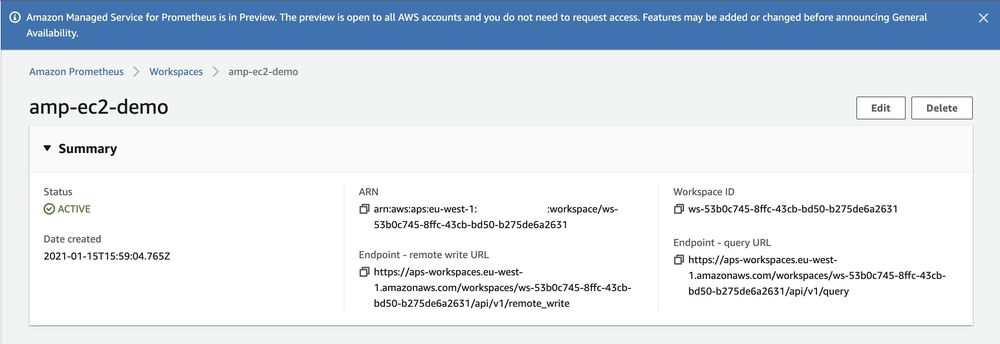
Once created, the service should provide us with a remote write URL and a query URL.
Running Prometheus server
To install the latest stable version of Prometheus, including the expression browser, please refer to the Prometheus guide. In this example we are going to install Prometheus v2.26.0 on Amazon Linux as following:
wget https://github.com/prometheus/prometheus/releases/download/v2.26.0/prometheus-2.26.0.linux-amd64.tar.gz
tar -xvf prometheus-2.26.0.linux-amd64.tar.gz
sudo cp prometheus-2.26.0.linux-amd64/prometheus /usr/local/bin/
Create a new file named prometheus.yaml, and edit the remote_write configuration with your workspace ID from the AMP workspace on the AWS console.
global:
  scrape_interval: 15s
  external_labels:
    monitor: 'prometheus'

scrape_configs:
  - job_name: 'prometheus'
    static_configs:
      - targets: ['localhost:8000']

remote_write:
  -
    url: https://aps-workspaces.eu-west-1.amazonaws.com/workspaces/<YOUR-WORKSPACE-ID>/api/v1/remote_write
    queue_config:
        max_samples_per_send: 1000
        max_shards: 200
        capacity: 2500
    sigv4:
        region: eu-west-1
We are finally ready to run Prometheus and send our application metrics to AMP.
prometheus --config.file=prometheus.yaml
Our metrics are now being sent to AMP ! You should see outputs in the Prometheus server console.
Visualize metrics with Grafana
Grafana is a commonly used platform for visualizing Prometheus metrics. On a local machine, let’s install Grafana and configure our AMP workspace as a data source.
Make sure the local environment has the following permissions, or more, to query the workspace.
{
    "Version": "2012-10-17",
    "Statement": [
        {
            "Action": [
                "aps:GetLabels",
                "aps:GetMetricMetadata",
                "aps:GetSeries",
                "aps:QueryMetrics"
                "aps:DescribeWorkspace"
            ],
            "Effect": "Allow",
            "Resource": "*"
        }
    ]
}
We will enable AWS SIGv4 authentication before running Grafana in order to sign queries to AMP with IAM permissions.
export AWS_SDK_LOAD_CONFIG=true
export GF_AUTH_SIGV4_AUTH_ENABLED=true
grafana-server --config=/usr/local/etc/grafana/grafana.ini \
  --homepath /usr/local/share/grafana \
  cfg:default.paths.logs=/usr/local/var/log/grafana \
  cfg:default.paths.data=/usr/local/var/lib/grafana \
  cfg:default.paths.plugins=/usr/local/var/lib/grafana/plugin
Log in to Grafana and go on the data sources configuration page /datasources to add your AMP workspace as a data source. The URL should be without the /api/v1/query at the end.
Enable SigV4 auth, then select the appropriate region and save.
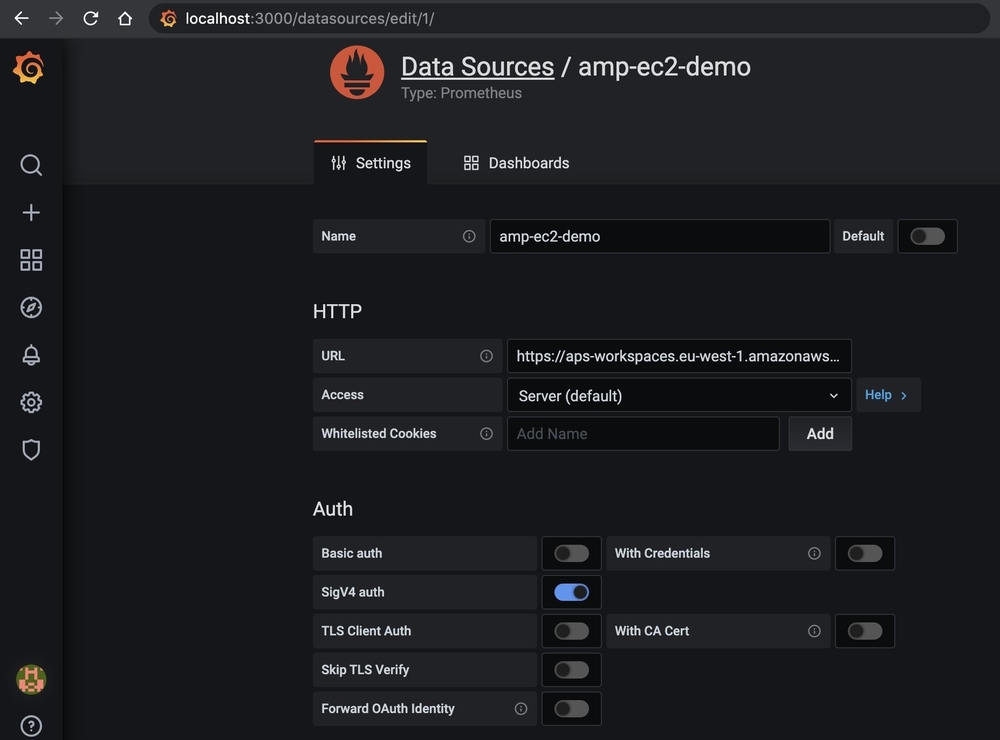
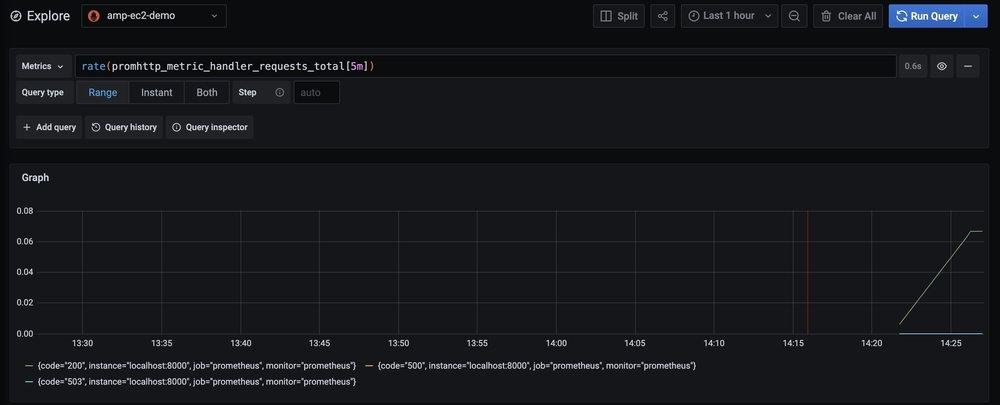
Our application metrics should now be available and ready to be used.
Conclusion
In this post, we’ve detailed the setup metrics collection architecture using the recently announced Amazon Managed Service for Prometheus in a non-containerized environment, using Amazon EC2 instances. To automate metrics collections on your EC2 instances, you can preconfigure AMIs with all involved dependencies or use AWS Systems Manager. Learn more about Amazon Managed Service for Prometheus, Amazon Managed Service for Grafana, and OpenTelemetry from the links provided.