AWS Cloud Operations Blog
Analyzing AWS CloudTrail in Amazon CloudWatch
In this blog post, we learn how to ingest AWS CloudTrail log data into Amazon CloudWatch to monitor and identify your AWS account activity against security threats, and create a governance framework for security best practices. We will analyze log trail event data in CloudWatch using features such as Logs Insight, Contributor Insights, Metric filters and CloudWatch Alarms.
When you enable CloudTrail logs in your AWS account or enable CloudTrail for your Organization, the number of events recorded in a single day can amount to thousands of API activities and terabytes of data. The challenge here is to define an effective monitoring and reporting mechanism to filter through the API calls, achieve meaningful insights, find anomalies, identify security risks, and plug those to mitigate breach of account/data security.
CloudTrail integrates with the CloudWatch service to publish the API calls being made to resources or services in AWS account. The published event has invaluable information that can be used for compliance, auditing, and governance of your AWS accounts. Below we introduce several features available in CloudWatch to monitor API activity, analyze the logs at scale, and take actions when malicious activity is discovered, without provisioning your own infrastructure.
Here is a brief introduction of the CloudWatch features we will use to analyze CloudTrail logs:
- CloudWatch Logs Insights – A fully integrated, interactive, and pay-as-you-go log analytics service for CloudWatch. You can explore, analyze, and visualize your logs instantly, allowing you to troubleshoot operational problems with ease.
- Contributor Insights – Analyzes time-series data to help you understand who or what is impacting your system and application performance by pinpointing outliers, finding the heaviest traffic patterns, and ranking the top system processes. This helps developers and operators more quickly isolate, diagnose, and remediate issues during an operational event.
- Metric Filters – For the logs available in CloudWatch Logs, you can begin searching and filtering the log data by creating one or more metric filters. Use these metric filters to turn log data into numerical CloudWatch metrics that you can graph or set a CloudWatch Alarm on.
Before we delve into specific use cases, let’s see how to enable CloudTrail logs and publish them to CloudWatch. If you haven’t already, follow the below steps to create a trail in CloudTrail.
Create a trail in the CloudTrail console
As a first step, create a trail by following the steps outlined below. For detailed explanation on the trail attributes refer to the Creating a Trail documentation.
- Open the CloudTrail console at https://console.aws.amazon.com/cloudtrail.
- Click on Trails from the left navigation pane.
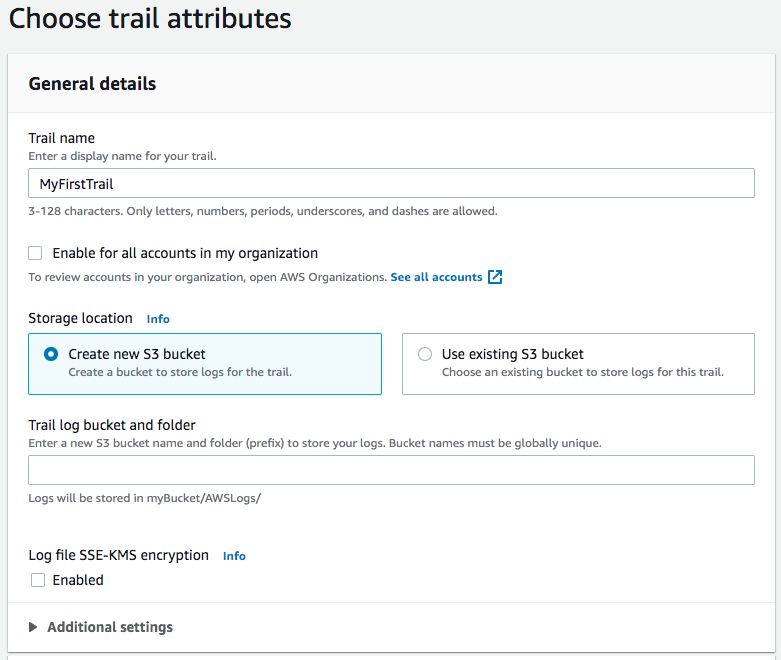
- Click on Create trail to open Choose trail attributes (shown below).
- Enter a
Trail name. (Example:MyFirstTrail). - Under Storage location, for Create a new S3 bucket enter an
S3 bucket name.
Note: The bucket name you choose must be unique across all existing bucket names in Amazon S3. One way to do that is to prefix your bucket names with random characters, or IAM User, or IAM Role name.
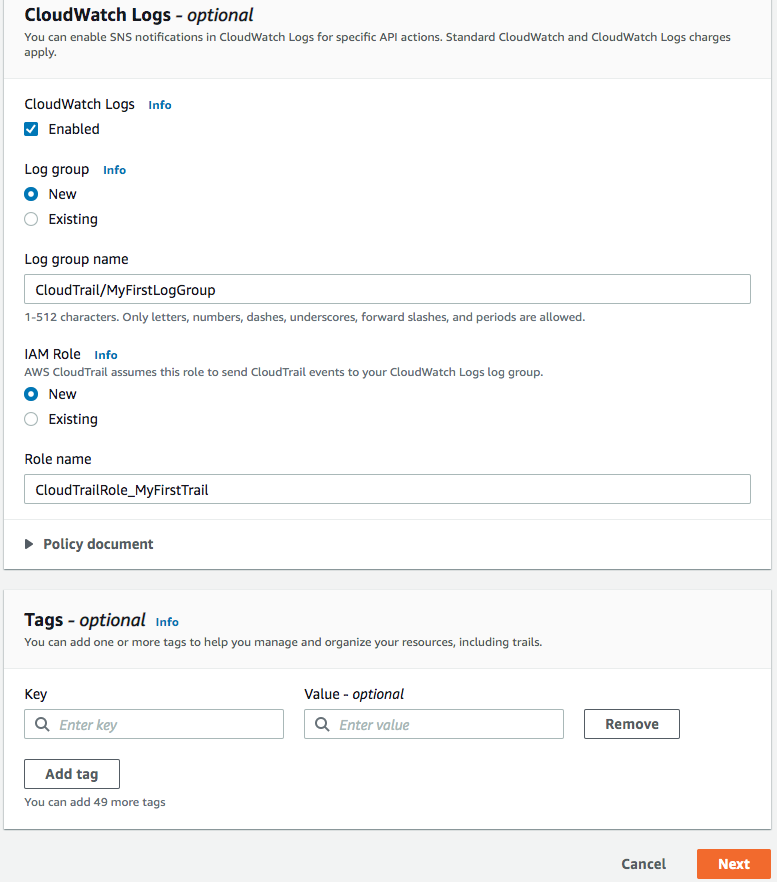
- Under the CloudWatch Logs section in Additional settings, select Enabled.
- Select New for the Log group and provide a Log group name. (Example:
CloudTrail/MyFirstLogGroupor use the defaultCloudTrail/DefaultLogGroup) - For IAM Role, select New and provide a Role name. (Example:
CloudTrailRole_MyFirstTrail) - Select Next.
- Select Next on the Events page (keep the defaults).
- On the Review and create page, review your configuration and select Create Trail.
Some best practices to note
- There is a limit on how many trails can be created in an AWS account. Creating a single trail for capturing events from all Regions help to stay within these limits. To create a single trail, select Yes for Apply trail to all regions when creating a trail.
- Enabling Data events (for Amazon S3 and AWS Lambda) in a trail can result to higher monthly charges. To manage costs, select only the S3 buckets or Lambda functions that you need to monitor.
By default, the retention duration for CloudWatch Log groups is set to “Never expire,” which means the log data is stored forever. Consider your organization’s data retention policies when setting the log data retention period. Consider setting up lifecycle policies on the CloudTrail trail S3 bucket to manage storage costs. Reference the Transitioning objects using S3 Lifecycle documentation for additional considerations.
Analyzing CloudTrail logs in CloudWatch
Now that the CloudTrail logs are enabled for delivery to Amazon CloudWatch Logs, it may take a few minutes before they appear in the CloudWatch console. In the following sections, we will focus on the security aspect of your account activity to analyze, monitor, and report using CloudWatch features.
CloudWatch Logs Insights
CloudWatch Logs Insights is an interactive log analytics capability for CloudWatch Logs. You can query the logs and analyze the trend of API activities. Analyzing this trend over a period of time provides insight into normal baseline activity, as well as abnormal activity.
A typical use case is to monitor AWS Management Console Sign-In failures. The baseline for this API activity should be less than a few events over a short period of time, let’s say 24-hours. A spike in sign-in failures could indicate a malicious user trying to gain access to your AWS account. This trend analysis in near-real time will help identify security breaches while the attack is happening, and gives you time to strategize on mitigating the attack.
Logs Insights in action
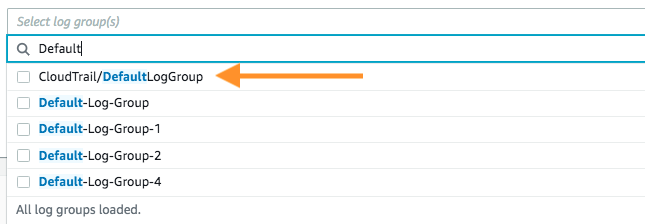
Open your browser and navigate to CloudWatch Logs Insights.
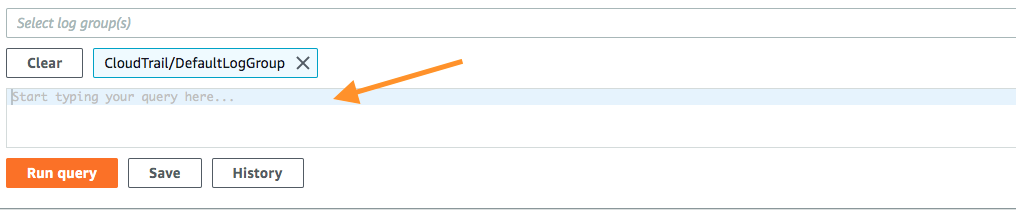
To get you started, there is a rich set of sample queries under Sample queries. Let’s select the Log Group created earlier (example: CloudTrail/DefaultLogGroup) in the Trail and get started with some queries. For each of the following queries, copy-paste into the text area and click on Run query.
Logs Insights can be used for the following CloudTrail sample use-cases
Monitor SignIn failures to AWS console
CloudTrail records AWS Management Console login attempts with the eventSource “signin.amazonaws.com”. The following query filters failed SignIn attempts to your AWS account, visualizing access patterns to identify brute force attacks or bot attacks. The query also captures whether MFA was used, a metric which can help you identify and enforce MFA usage in your account or across your organization.
Monitor new keys generated in AWS KMS
The creation of AWS KMS keys is another important security activity that can be monitored using CloudTrail logs. If you manage cryptographic keys and control their use across a wide range of AWS services in your applications, it’s beneficial to audit certain AWS KMS events for security and quality compliance.
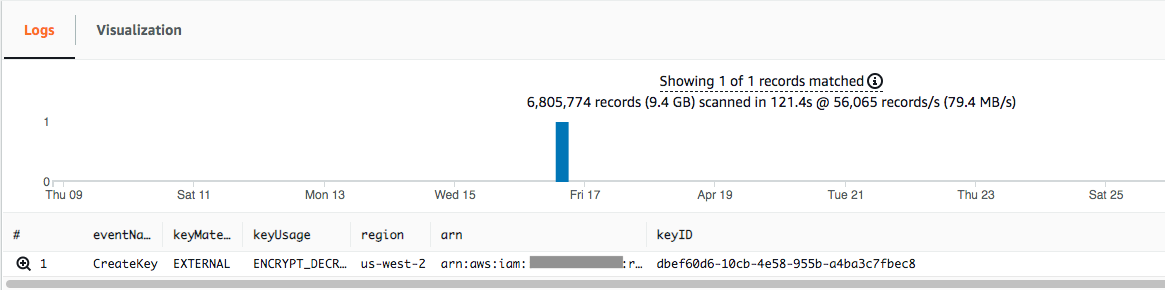
The following query monitors new KMS key creation by filtering CreateKey API call and looks for Key Material Origin with non-AWS value in the API request. The Key Material Origin attribute defines the source of the key material. When you use imported key material, you need to secure and manage that key material outside of AWS KMS, including replacing the key material if it expires. In this case, keeping track of keys created with external key material will help you maintain oversight of the key management process. Additional information on AWS KMS can be found in the AWS Key Management Service concepts documentation.
fields eventName, requestParameters.origin as keyMaterial, responseElements.keyMetadata.keyUsage as keyUsage, awsRegion as region, userIdentity.arn as arn, responseElements.keyMetadata.keyId as keyID | filter eventName="CreateKey" and keyMaterial!="AWS_*"
This is how the visualization looks when you run the query. You can click on the grey magnifying glass below column # to view the event details without navigating away from Insights console.
Monitor Amazon RDS database events
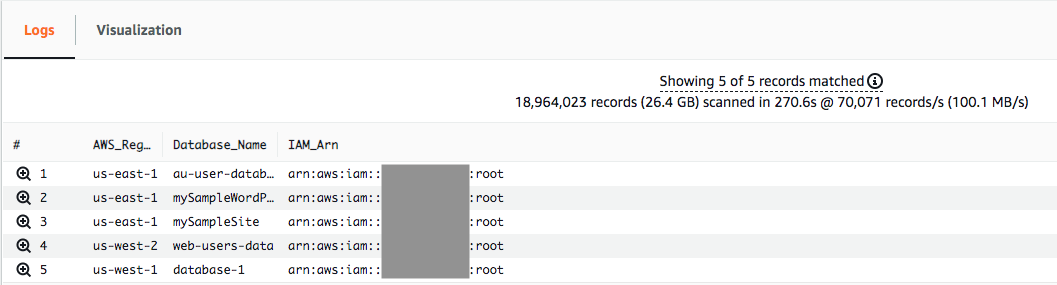
Most applications tend to have a data tier and many use Amazon RDS as a managed database service. As a database owner or administrator you may want to monitor who changed and what changed in your database configuration. The following queries focus on CreateDBInstance and ModifyDBInstance API calls, which keep track of new Amazon RDS instance creations or modifications.
The first query filters the CreateDBInstance event. It displays the AWS Region, Database Name, IAM Role/User of who created it.
filter eventSource="rds.amazonaws.com" and eventName="CreateDBInstance"
| fields awsRegion as AWS_Region, requestParameters.dBInstanceIdentifier as Database_Name, userIdentity.arn as IAM_Arn
The following is a sample visualization.
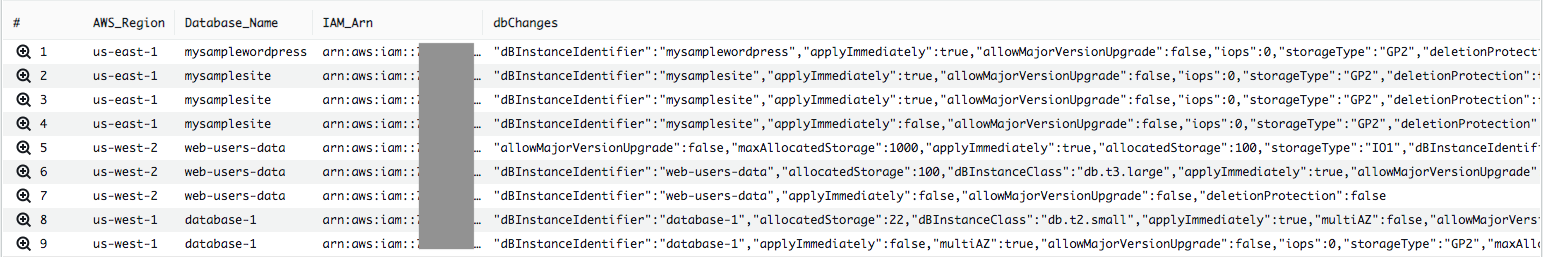
The second query filters ModifyDBInstance events. Note the parse keyword usage in the query. CloudWatch Logs Insights can extract fields from log event data automatically. In cases where certain fields are not extracted, you can use the parse keyword to extract ephemeral fields dynamically and operate on them.
fields eventSource, eventName, awsRegion as AWS_Region, requestParameters.dBInstanceIdentifier as Database_Name, userIdentity.arn as IAM_Arn
| filter eventSource="rds.amazonaws.com" and eventName="ModifyDBInstance"
| parse @message "requestParameters\":{*}" as dbChanges
| display AWS_Region, Database_Name, IAM_Arn, dbChanges
Expand the event to view details on each database modification request. The following is a sample visualization:
For details on the Logs Insights query language, visit the CloudWatch Logs Insights Query Syntax documentation.
You can add a Logs Insights query visualization to the CloudWatch Dashboard as a widget for continuous monitoring. You can save your favorite queries and run them again, or share across teams in an organization. Referz Saving and Re-running CloudWatch Logs Insights Queries for additional information.
Contributor Insights
Contributor Insights analyzes time-series data to provide a view of the top contributors influencing system performance. You can create Contributor Insights rules to evaluate patterns in CloudTrail logs in real-time and display reports that show the top contributors and number of unique contributors in a dataset. Analyzing the top contributors helps to identify the source of an operational issue due to API throttling, identifying bad actors or an anomalous incident in the account.
Let’s look at a few rules that filter the CloudTrail logs and helps you find top talkers.
Contributor Insights in action
Open your browser and navigate to CloudWatch Contributor Insights. For quick reference on Contributor Insights rules, you can view all the configurable parameters in the Wizard tab. For this example, I will use the Syntax tab. Click Create rule and select Syntax. Provide a Rule name, and copy-paste the JSON Rule body from the examples below.
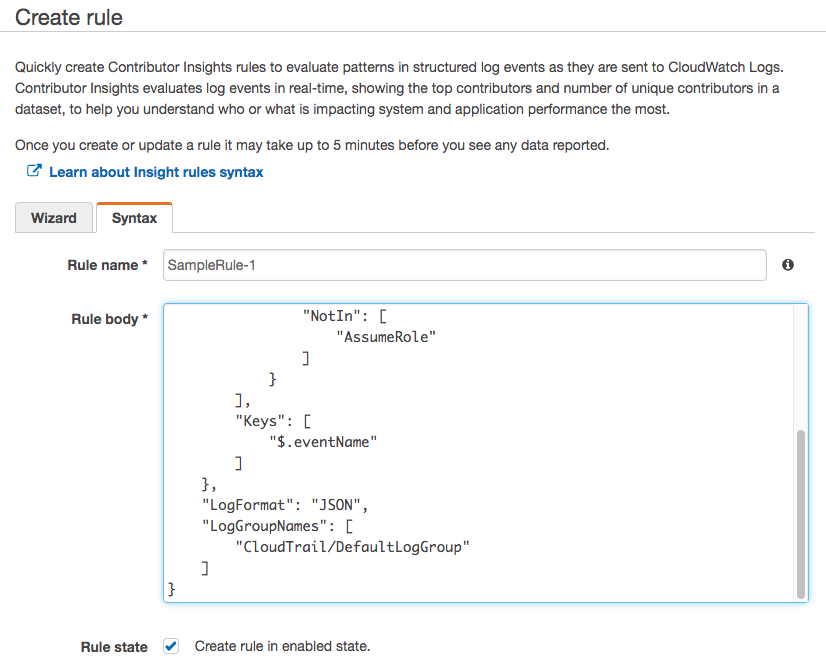
After you copy-paste the rule body, you can switch the view to the Wizard tab to see what the configurable parameters look like.
Monitoring the top 10 API calls excluding “AssumeRole” in an account across all AWS Regions
In most AWS accounts, the event AssumeRole is the top contributor because your applications, IAM users, and AWS Managed Services all assume IAM roles for specific tasks. In this rule, let’s look at the top API calls in your account while excluding AssumeRole API from the contributor. Copy and paste this JSON rule body to create the rule:
{
    "Schema": {
        "Name": "CloudWatchLogRule",
        "Version": 1
    },
    "AggregateOn": "Count",
    "Contribution": {
        "Filters": [
            {
                "Match": "$.eventName",
                "NotIn": [
                    "AssumeRole"
                ]
            }
        ],
        "Keys": [
            "$.eventName"
        ]
    },
    "LogFormat": "JSON",
    "LogGroupNames": [
        "CloudTrail/DefaultLogGroup"
    ]
}
The preceding rule aggregates the results on Count – the number of occurrences of each unique contributor. You can also aggregate on SUM to add the values of the field that you specify from the log event. The Contribution section defines how the rule filters the log events. In the LogGroupNames section, you specify which CloudWatch Log Group this rule applies to.
The following is a sample visualization of the top 10 API calls in an account:
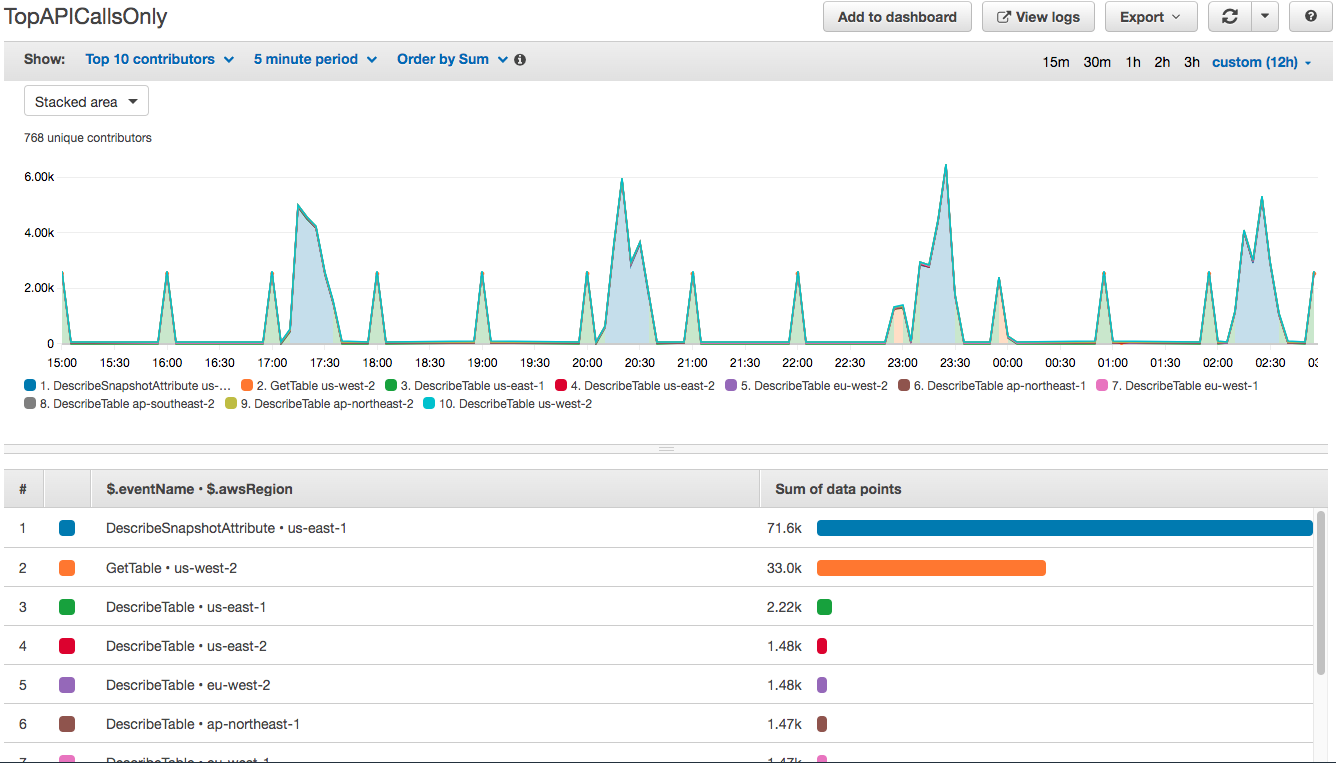
The rule creates a time series of how the API calls are distributed over a 12-hour period. It shows metrics about the unique contributors and their usage. The console has built-in features to add this as a widget to CloudWatch Dashboard, or to view the detailed logs in CloudWatch Logs Insights, or to export the result to a CSV file.
Monitoring API throttling
The following rule monitors the API operations that were throttled by filtering on the errorCode field from the CloudTrail logs. This is useful to detect the frequency of unique API throttles and who is making those API calls. You can click on View logs to further analyze the API and take remedial action.
{
    "Schema": {
        "Name": "CloudWatchLogRule",
        "Version": 1
    },
    "AggregateOn": "Count",
    "Contribution": {
        "Filters": [
            {
                "In": [
                    "Client.RequestLimitExceeded"
                ],
                "Match": "$.errorCode"
            }
        ],
        "Keys": [
            "$.eventName",
            "$.userIdentity.arn"
        ]
    },
    "LogFormat": "JSON",
    "LogGroupNames": [
        "CloudTrail/DefaultLogGroup"
    ]
}
The following is a visualization of the API call that is being throttled:
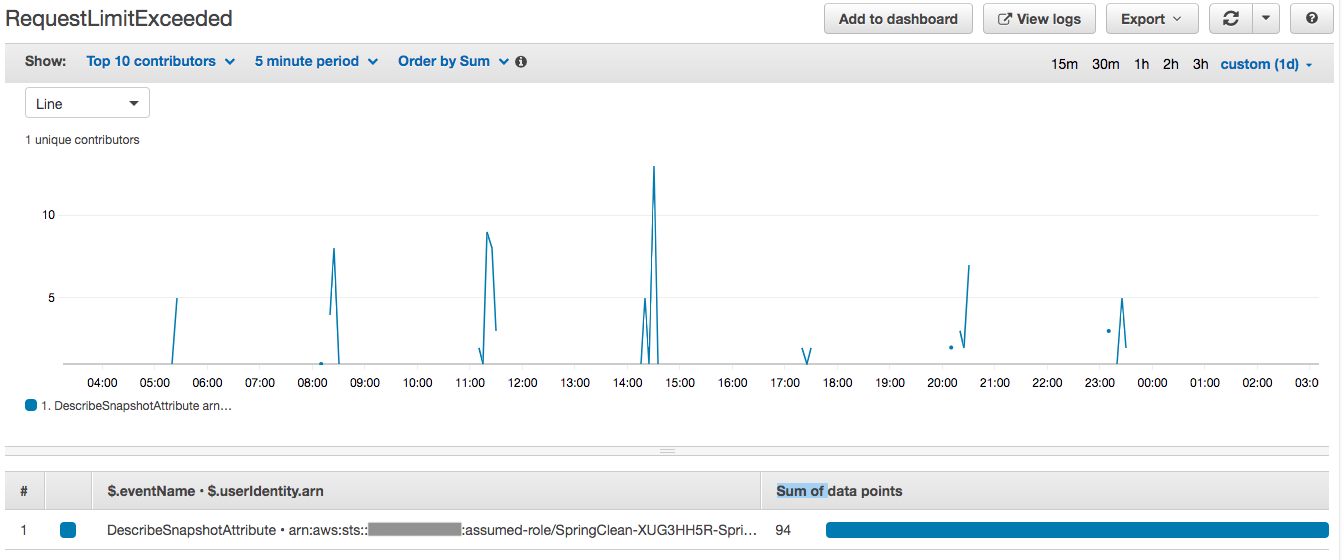
Often you find a throttled API call as one of the top talkers in the first rule we created to monitor the top 10 API calls. The preceding two rules together provide clear insight into API calls activity in your account, and which ones can impact your applications.
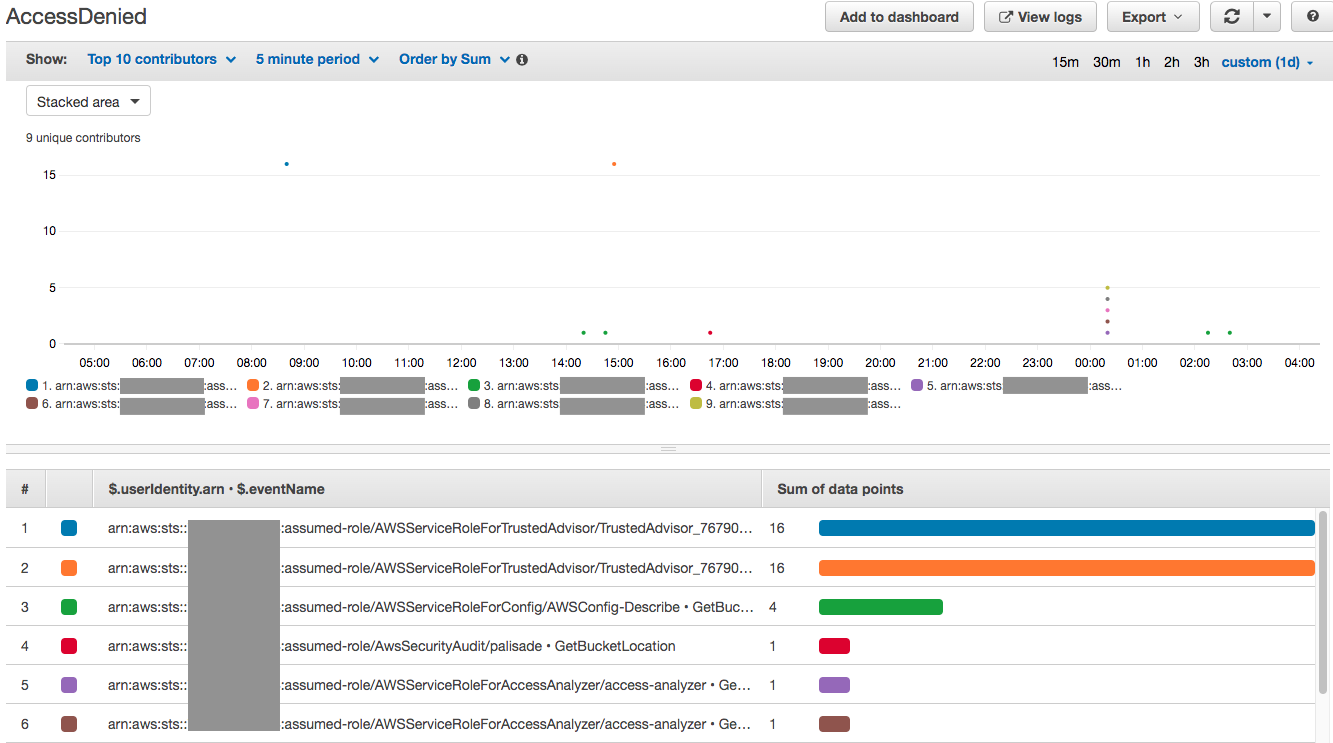
Monitoring for IAM User/Roles AccessDenied events
In addition to identifying the top talkers, you can create Contributor Insights rule to monitor IAM users and IAM roles activity, which can be used to identify anomalous activity, often indicative of compromised credentials. The following rule monitors the IAM user access patterns across your account and services. It provides a time series data of which IAM activity resulted in access deny events, or were blocked due to an unauthorized API call.
{
    "Schema": {
        "Name": "CloudWatchLogRule",
        "Version": 1
    },
    "AggregateOn": "Count",
    "Contribution": {
        "Filters": [
            {
                "In": [
                    "AccessDenied",
                    "UnauthorizedOperation"
                ],
                "Match": "$.errorCode"
            }
        ],
        "Keys": [
            "$.userIdentity.arn",
            "$.eventName"
        ]
    },
    "LogFormat": "JSON",
    "LogGroupNames": [
        "CloudTrail/DefaultLogGroup"
    ]
}
The following is a sample visualization for the rule:
Metric Filters
Up to now, we have visualized time series graphs by extracting log fields from CloudTrail logs. Using Metric Filters, you can search and match terms, phrases, or values in CloudTrail log events to create custom metrics. This helps to quickly narrow down operational issues and create CloudWatch Alarms for notification or remediation action.
A sample use case is to monitor the AssumeRole API, which is used by IAM roles and applications to access AWS services. The AssumeRole API grants temporary security credentials for a certain period of time; monitoring that period can actively prevent inadvertent security breaches. Let’s see how to monitor the API call AssumeRole to find and alert when the session duration is longer than that defined in your organization’s security best practices. Using this approach, you can automate the detection and response to potential security breaches affecting your application or account, signalled by the excess duration of temporary security credentials.
In the following example, I extract the value durationSeconds attribute from the AssumeRole log event.
Metric Filters in action
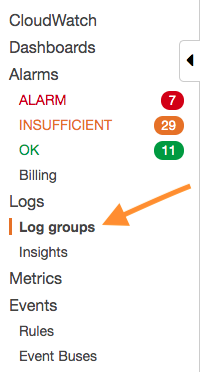
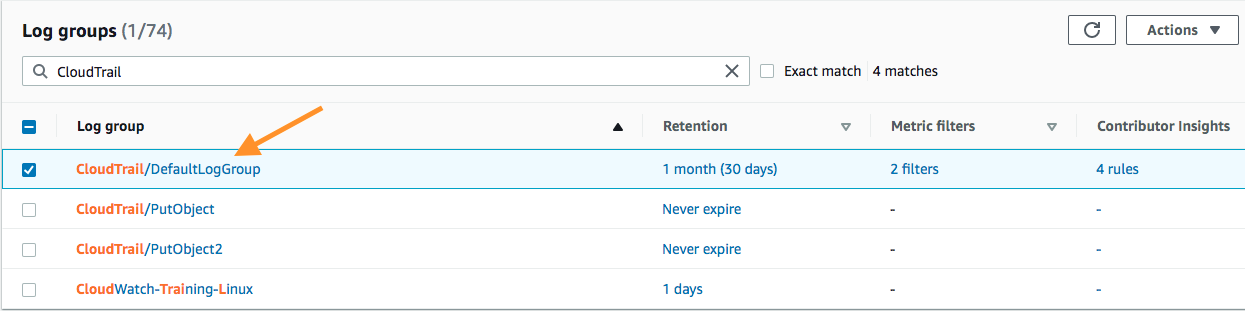
- Open CloudWatch console and click Log groups under Logs.
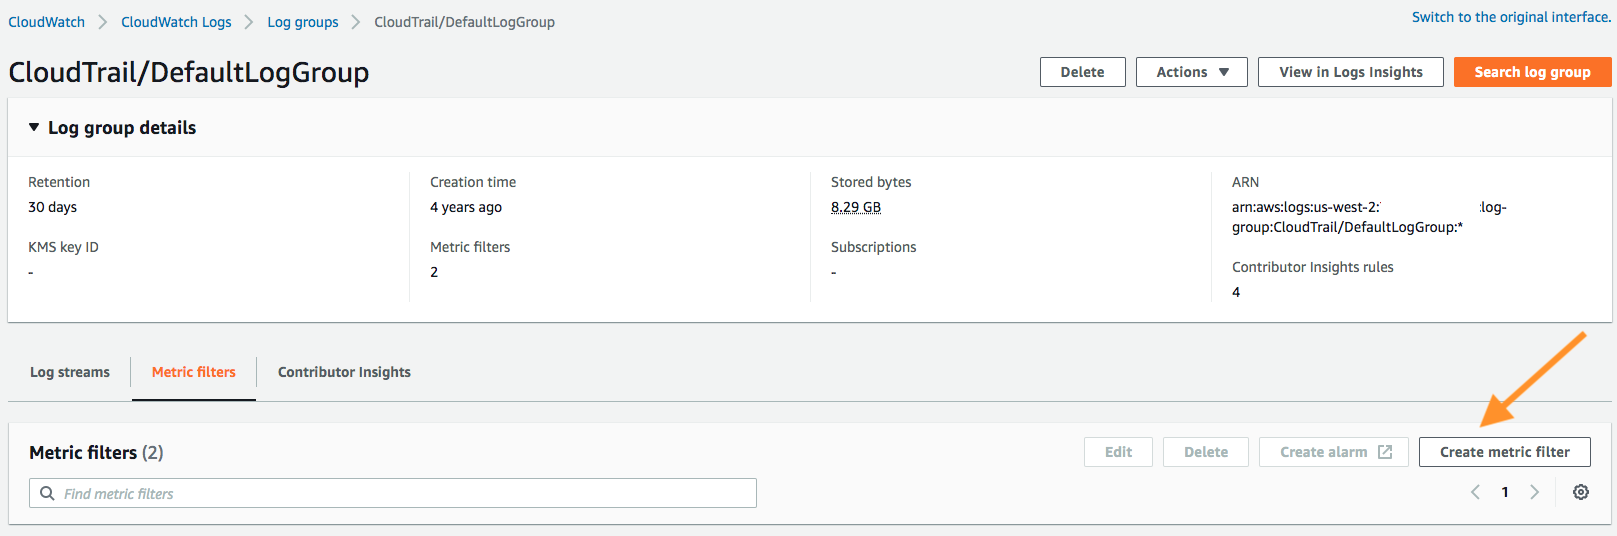
- Select the CloudWatch Log Group. Select the Metric filters page and select Create metric filter.
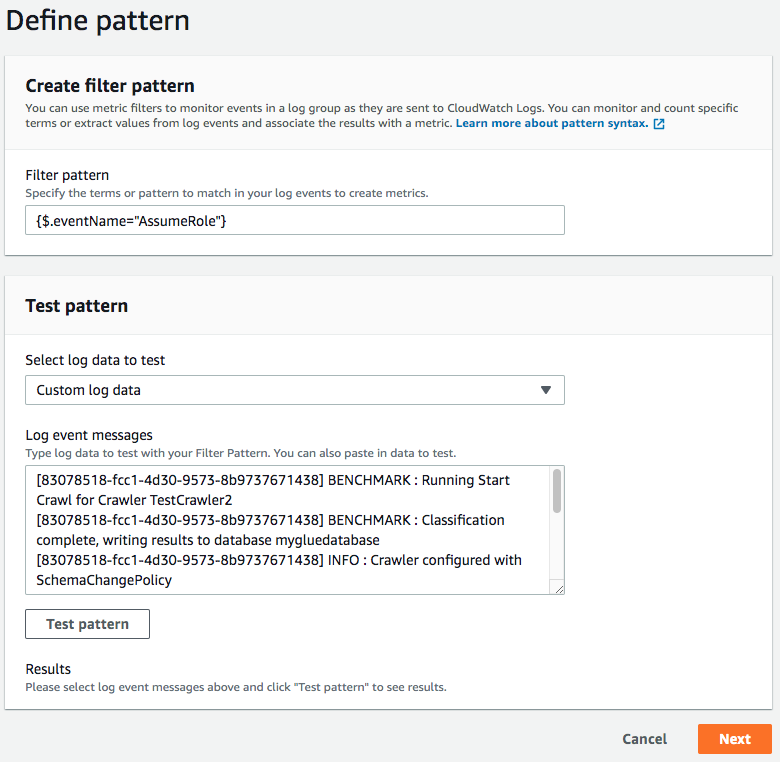
- Define pattern – provide the Filter Pattern
{$.eventName="AssumeRole"}. Click Next.
- Assign metric
- Under Create filter name, provide a name.
- Under Metric details provide the following:
- Metric namespace:
SecurityMetrics - Metric name:
AssumeRoleDuration - Metric value:
$.requestParameters.durationSeconds - Default value – optional:
0
- Metric namespace:
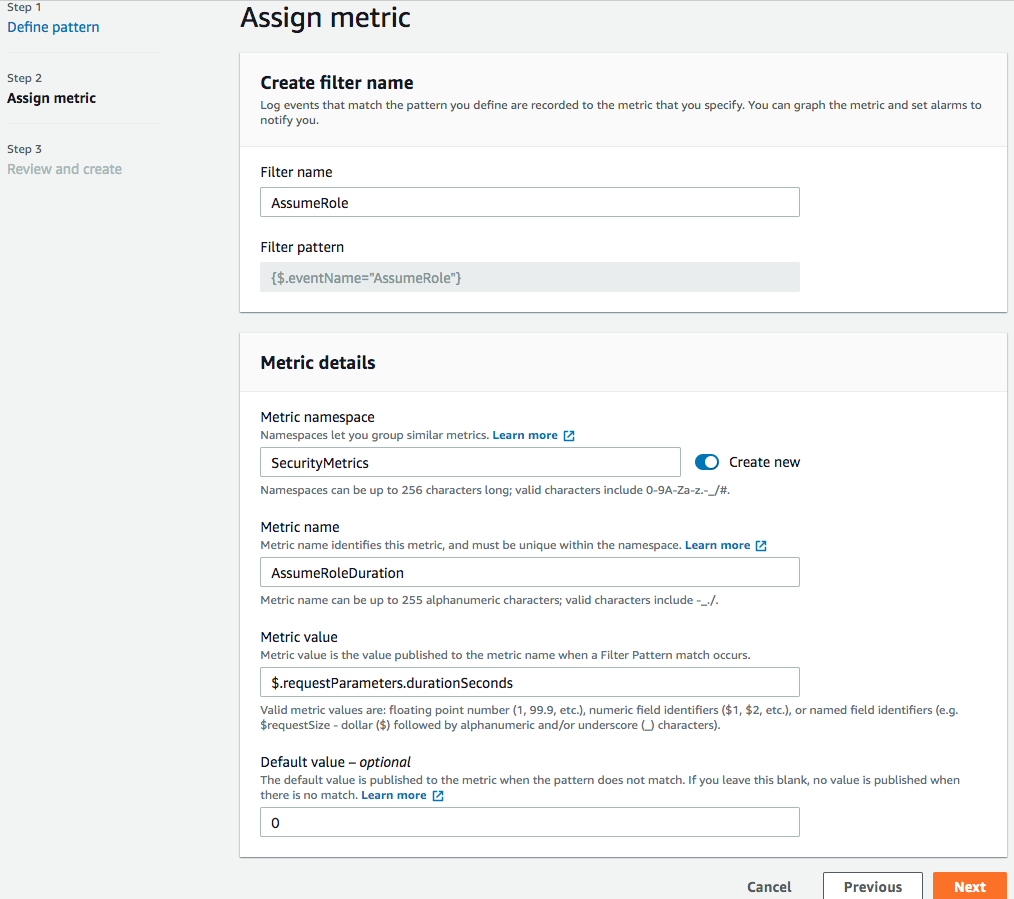
- Click Next.
- Review the details and click Create metric filter.
The preceding metric filter parses the CloudTrail log events as and when available in the CloudWatch Logs group, and creates custom metrics on the duration of an AssumeRole session within seconds. To receive notifications, create a CloudWatch Alarm by clicking Create alarm on the Metric filters page.

If an anomaly is detected and the CloudWatch Alarm sends a notification, you can perform further analyses by jumping directly to the event log which caused the alarm. Use the following steps to perform this analysis:
- Navigate to the CloudWatch console and click Metrics in the left navigation pane.
- Under Custom Namespaces, click on the SecurityMetrics namespace.
- Click on Metrics with no dimensions.
- Check the check box for AssumeRoleDuration metric.
- Under Graphed metrics tab, select the Statistic as Maximum.
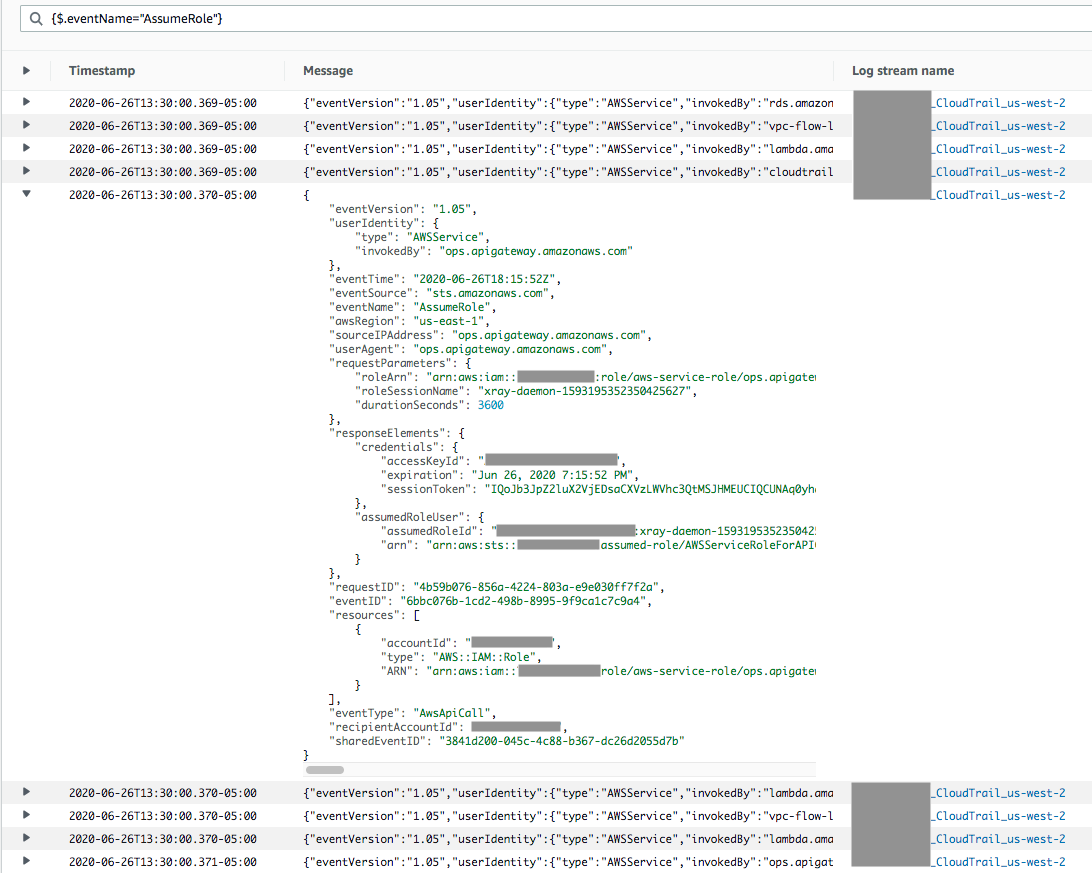
- From the top right corner just above the graph area, click on “Actions → View logs → AssumeRoleDuration – CloudTrail/MyFirstLogGroup.” This opens a new tab for CloudWatch Logs, with the events filtered to the selected time period. You can look at individual events for a deeper inspection and understanding of the API call.
The following is a visualization of the events filtered in CloudWatch Logs for AssumeRoleDuration metric.
Next steps
Now that you have seen how to ingest CloudTrail in CloudWatch, you can explore creating a notification or feedback mechanism using CloudWatch Alarms. CloudWatch Alarms are integrated with Dashboards (when you save a Logs Insight query to it), Contributor Insights, and Metric Filters.
For more information on creating CloudWatch Alarms, refer to the Using Alarms documentation. You can create an alarm to receive notifications via Amazon SNS or create a subscription with Amazon SNS to other supported AWS Services such as AWS Lambda and Amazon SQS to automate remediation steps.
Conclusion
In this post we have looked at various CloudWatch features that offer powerful search, analytics, monitoring, and reporting functionality to track various security-related events, helping to improve your account’s security posture. We walked through some examples of how you can identify trends without provisioning additional infrastructure and perform in-place analysis using CloudWatch Logs Insights.
This post should help you set up basic monitoring and reporting of key events like Sign-In attempts, access to KMS service, top API calls, and to track changes to your applications and resources. You can build upon these examples to tailor your organization’s specific security practices for compliance and audit purposes. To get started, we recommend getting familiar with the CloudTrail log events, by reviewing the CloudTrail Log Event Reference documentation.
About the author

Avinash Gogineni is a Technical Account Manager with Amazon Web Services. With more than nine years of experience in software development and on cloud technology, he is passionate about solving technology and business problems.

Imaya Kumar Jagannathan is a Senior Solution Architect focused on Amazon CloudWatch and AWS X-Ray. He is passionate about Monitoring and Observability and has a strong application development and architecture background. He likes working on distributed systems and is excited to talk about microservice architecture design. He loves programming on C#, working with Containers and Serverless technologies.