AWS Big Data Blog
Run log analytics for a fraction of the cost with the new engine for Amazon OpenSearch Service
Amazon OpenSearch Service is a real-time retrieval engine for AI, search, and analytics at any scale. As log volumes grow 30–40 percent year over year, organizations face rising infrastructure costs and slower analytical queries across their observability data. Teams are forced to choose between retaining the data they need and staying within budget.
We’re introducing a purpose-built log analytics engine for Amazon OpenSearch Service. This new engine delivers up to 4x price performance, 2x faster data ingestion, up to 2x faster analytical queries, and up to 70 percent lower storage costs. You get all of this without sacrificing search capabilities on the same data.
In this post, you learn how to take advantage of these benefits, see how to get started, and review benchmark results at billion-document scale.
How the optimized engine works
The optimized engine is a new engine mode within the same Amazon OpenSearch Service domain. You use the same console, APIs, security model, and networking configuration that you already use with the general-purpose engine.
OpenSearch Service stores all data in Apache Parquet format. For fields configured as searchable, OpenSearch Service also writes the data to the inverted index. Apache Calcite parses and optimizes each query, then routes operations to the engine best suited to execute them: Apache DataFusion for analytical operations on columnar data, or Lucene for search predicates. The two hand off mid-query, so a single query can search log content and aggregate the results without additional roundtrips.
You ingest data through the same REST APIs and client libraries you use today and you don’t need to change your agents or pipelines. The optimized engine supports two query languages: Piped Processing Language (PPL) and SQL. Both execute natively through the vectorized engine. The Domain Specific Language (DSL) query API is not supported on the optimized engine at launch.
Getting started
At launch, the optimized engine is a domain-level setting selected at creation time. You can’t add the optimized engine to an existing domain or enable it on individual indices or fields within a general-purpose domain. To adopt the optimized engine, create a new domain and migrate your ingestion pipelines to it.
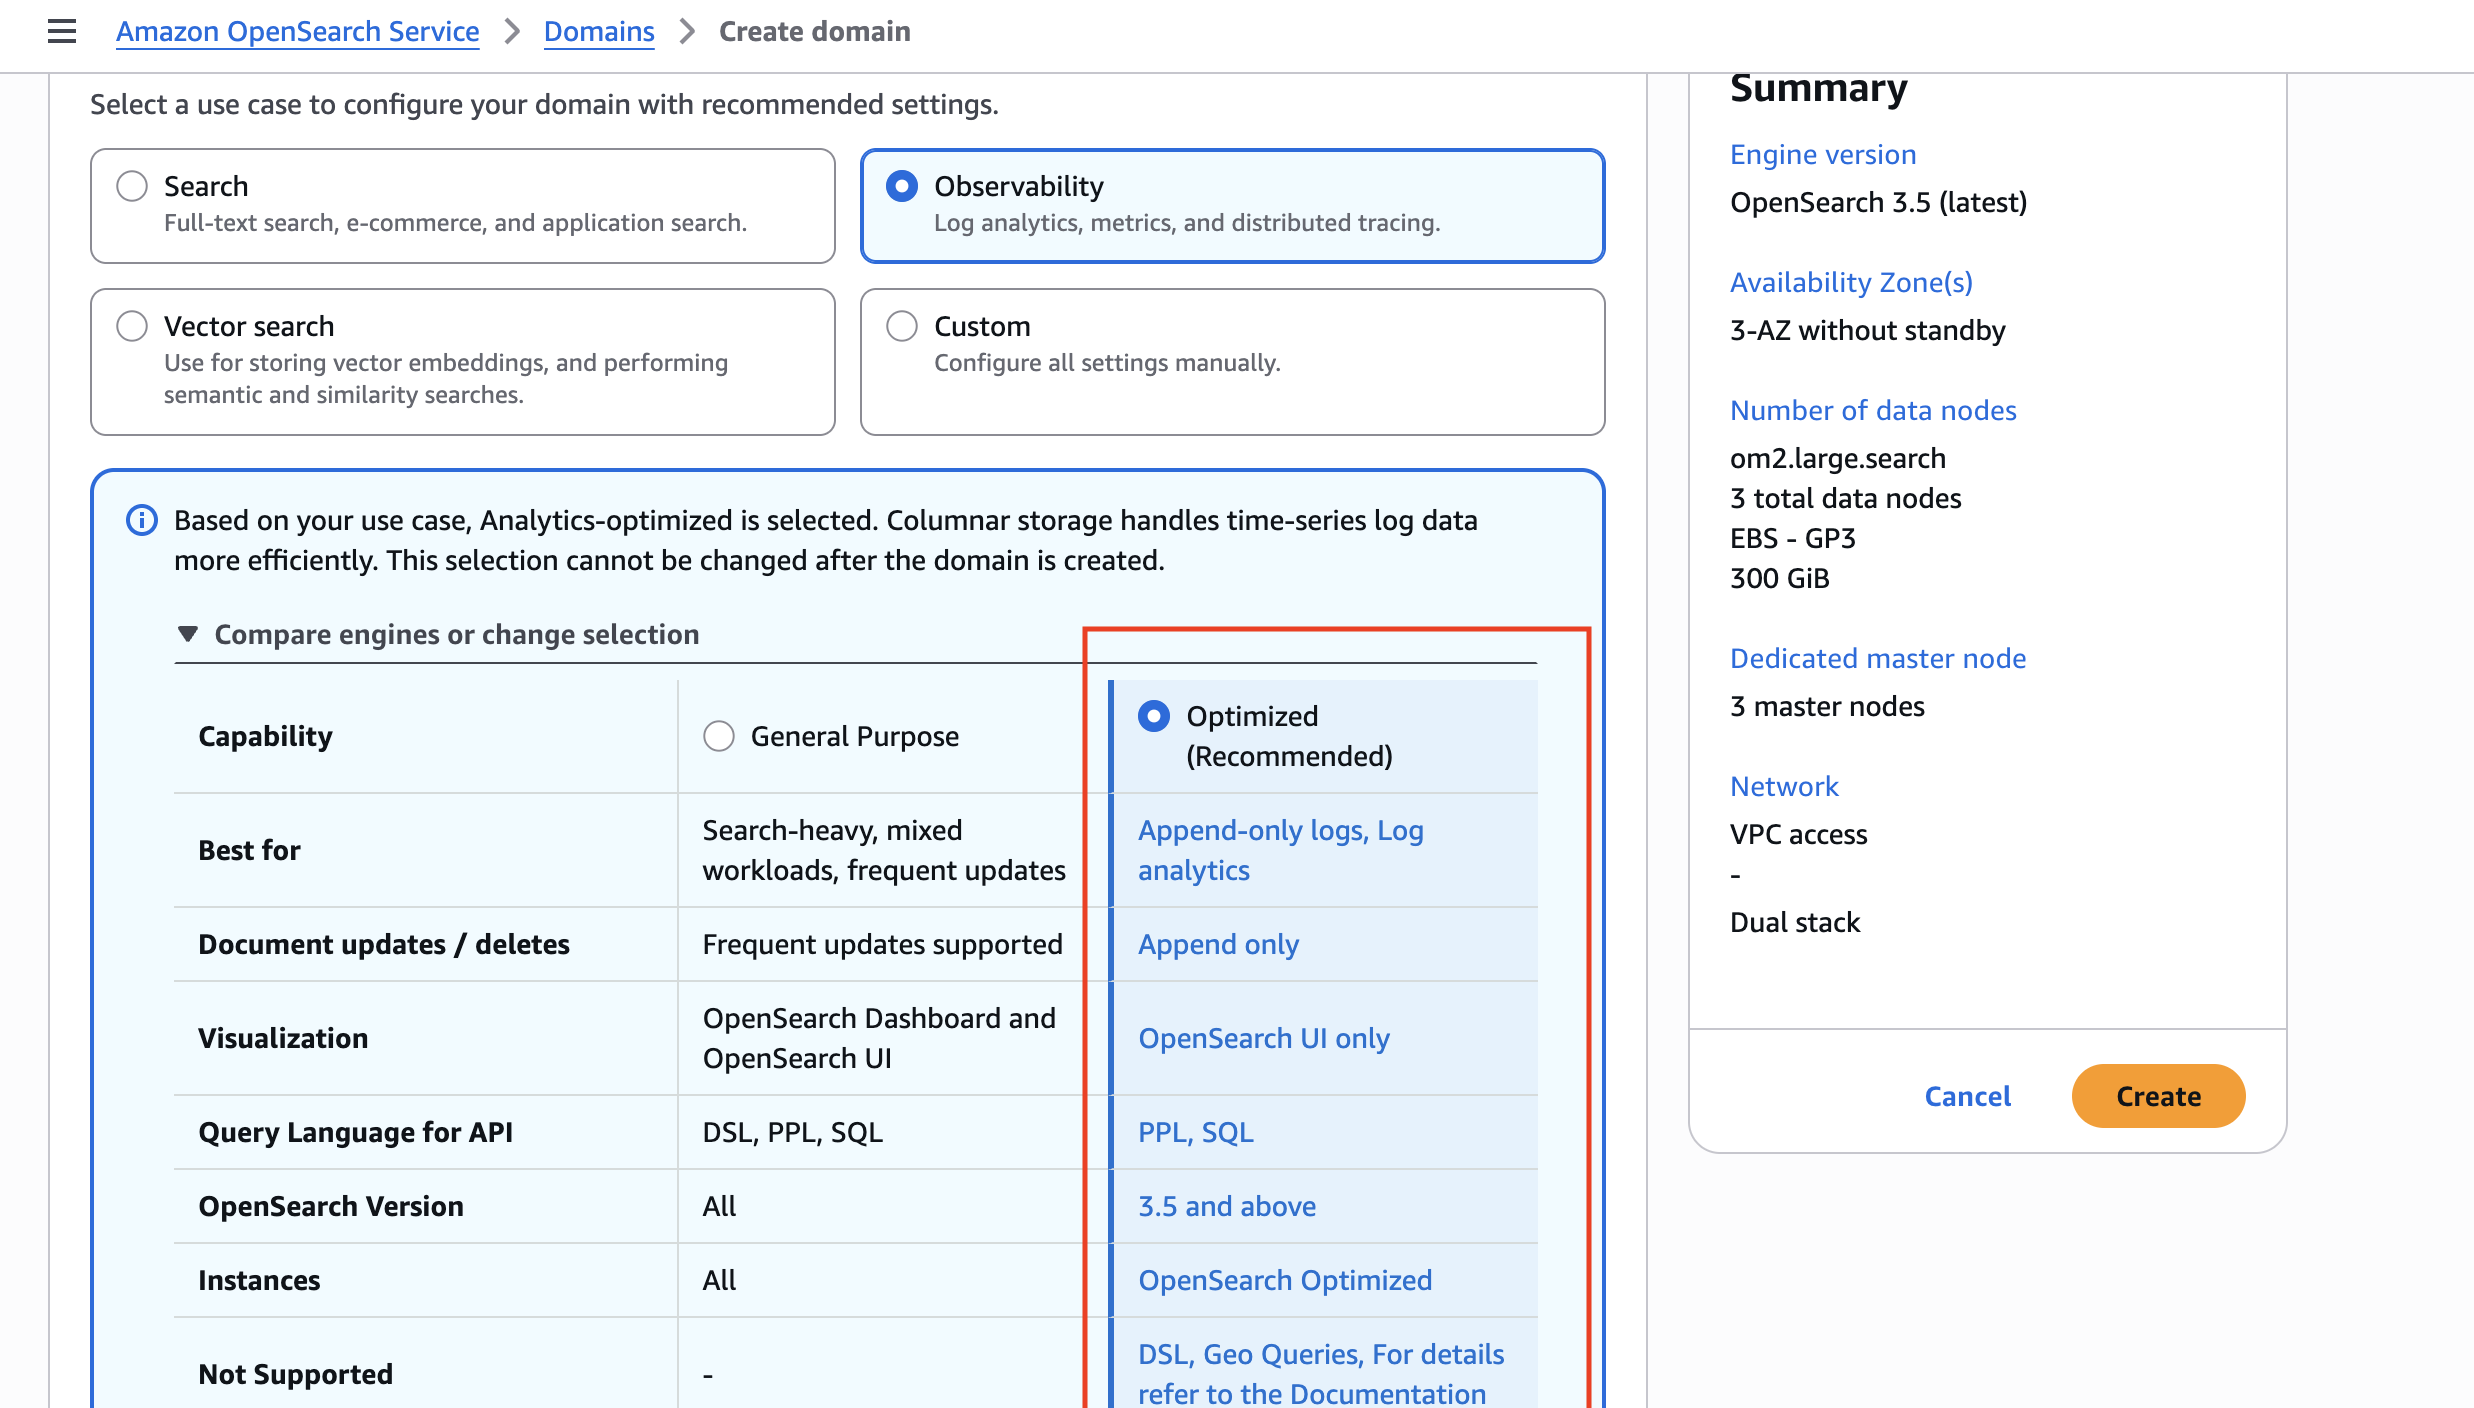
Create a new domain in the Amazon OpenSearch Service console and select Observability as your use case. The optimized engine is enabled by default. The console provides a side-by-side comparison of capabilities to help you choose.
After your domain is ready, ingest JSON documents through the same Bulk API and client libraries you use today. No changes to your ingestion pipelines or application code are required.
Benefits of the optimized engine for log analytics
The optimized engine for log analytics introduces the following performance and cost improvements:
- Up to 4x better price-performance compared to the existing general-purpose engine on internal benchmarks, while retaining full-text search for incident investigation.
- Up to 2x faster analytical queries. The engine uses a vectorized query execution path that processes data in columnar batches for fast results across large datasets.
- Up to 2x higher ingestion throughput. The append-only columnar write path increases sustained ingestion rates.
- Up to 70 percent lower storage with columnar storage for aggregation workloads. You can retain up to 3x more data at the same cost.
To demonstrate these improvements, we benchmarked observability workloads at billion-document scale. In the following sections, we explore the benchmark methodology, test environment, and results. We recommend testing the optimized engine with your own workload to validate the gains for your use case.
Benchmark methodology
We used the Telemetry Generator for OpenTelemetry to generate synthetic traces and logs at scale, producing three observability datasets: OTEL traces, OTEL logs, and web server access logs. We stored the generated data as bulk-format NDJSON in Amazon Simple Storage Service (Amazon S3). We then ingested it through a pipeline on Amazon Elastic Container Service (Amazon ECS) with AWS Fargate. The pipeline reads chunks from Amazon S3, transforms timestamps, and writes to the OpenSearch Bulk API, simulating a production observability flow.
We benchmarked on two OpenSearch Service domains running OpenSearch 3.5, each with 9 data nodes in a 3-Availability Zone configuration:
| Configuration | Optimized Engine | Standard Lucene |
| Instance type | 9x or2.4xlarge.search | 9x r8g.4xlarge.search |
| Leader nodes | 3x m7g.large.search | 3x m7g.large.search |
| EBS | 2,500 GB gp3, 7,500 IOPS, 500 MB/s per node | 2,500 GB gp3, 7,500 IOPS, 500 MB/s per node |
| Engine mode | OPTIMIZED | General Purpose |
We ingested three data sets totaling 24.4 billion documents and 9.5 TB of raw JSON. All indices used 9 primary shards, 1 replica, and Index State Management (ISM)-managed rollover at 50 GB per primary shard. The Lucene baseline had _source enabled, representing the default customer configuration.
The ingestion pipeline ran on 90 Fargate tasks (16 vCPU, 120 GB RAM each, 48 writer threads per task, bulk size of 3,000 documents) in the same virtual private cloud (VPC) as the OpenSearch Service domains.
Results
Ingestion throughput
The optimized engine’s append-only columnar storage writes segments in bulk-optimized batches without per-document stored field overhead.
| Metric | Optimized Engine | Lucene Baseline |
| Peak throughput | 1.78M docs/sec | ~647K docs/sec |
| Cluster CPU at peak | 62% | 72% |
| Write rejections | 0 | 0 |
| Total documents ingested | 24.4 billion | 15.7 billion |
The optimized engine sustained 1.78 million documents per second at matched concurrency, approximately 2x the throughput of the Lucene baseline, while consuming less CPU. Both domains ran with zero write rejections. For teams ingesting terabytes per day, the throughput advantage translates to fewer nodes for the same volume, or longer retention on the same infrastructure.
Storage compression
The columnar Parquet format compresses observability data through dictionary encoding of repeated fields, tight packing of numeric columns, and elimination of per-document JSON overhead.
Measured across 24.4 billion documents:
| Dataset | Documents | Source(GB) | Optimized Engine (GB) | Lucene zlib/best_compression (GB) | Lucene LZ4/default (GB) | Savings vs Source | Savings vs zlib | Savings vs LZ4 (default) |
| Web logs | 8.76B | 2,360 | 254 | 614 | 955 | 89% | 59% | 73% |
| OTEL logs | 8.20B | 3,720 | 815 | 1,549 | 1,964 | 78% | 47% | 59% |
| OTEL traces | 7.43B | 4,131 | 841 | 1,790 | 2,301 | 80% | 53% | 63% |
The optimized engine stores the same data at 5x compression versus raw JSON (80 percent savings). Against the default Lucene configuration (_source enabled, what most domains run), the optimized engine uses roughly half the storage. The optimized engine derives _source from Parquet columns on read, eliminating the need to store the raw JSON blob while still allowing document retrieval.
Analytical query performance
We measured query latency on a typical observability dashboard pattern: analytical aggregations scoped to a 15-minute time window over billions of log events. The optimized engine uses row-group pruning on the @timestamp column to skip data outside the query window, reading only the relevant subset.
| Query pattern | Dataset | Optimized Engine | Lucene baseline | Speedup |
| Error count by service | OTEL logs | 717 ms | 2.8 s | 3.9x |
| Log volume by host | OTEL logs | 252 ms | 17.6 s | 70x |
| 5xx errors by service and method | OTEL logs | 171 ms | 885 ms | 5.2x |
| Top services by error | OTEL traces | 635 ms | 569 ms | ~1x |
| Point lookup (single traceId) | OTEL traces | 394 ms | 783 ms | 2x |
All queries scoped to a 15-minute window. Index sizes: 8.2 billion OTEL log events, 7.4 billion OTEL trace spans.
The optimized engine completes time-filtered analytical queries in 171 ms to 717 ms over billions of documents. The advantage is most pronounced on unfiltered aggregations (log volume by host: 70x) where the columnar engine reads only the columns needed. On queries where the Lucene inverted index provides strong predicate selectivity (top services by error on traces), performance is comparable between the two engines.
Search and point lookups
The optimized engine retains the Lucene inverted index alongside columnar storage. When the query planner recognizes a selective lookup (such as retrieving a single trace by ID), the planner routes the query to the inverted index rather than scanning columnar data. In our benchmark, a single traceId lookup across 7.4 billion spans returned in 165 ms.
This means a real investigation can use both engines in sequence: broad aggregations to localize the problem, then a point lookup to pull the offending trace, all from the same domain.
Now available
The optimized engine for Amazon OpenSearch Service is generally available today across 12 regions globally: US East (N. Virginia, Ohio), US West (Oregon), Canada (Central), Asia Pacific (Mumbai, Singapore, Sydney, Tokyo), and Europe (Frankfurt, Ireland, London, Spain). There are no additional charges for the new engine.
Pricing follows standard Amazon OpenSearch Service rates for instances and storage, with no additional premium for the optimized engine. For more information, see Amazon OpenSearch Service Pricing.
To learn more about configuring and using the optimized engine, see Optimized for Log Analytics in the Amazon OpenSearch Service documentation. For an overview of the service, visit Amazon OpenSearch Service Log Analytics.
Give it a try and send feedback to AWS re:Post for Amazon OpenSearch Service or through your usual AWS Support contacts.