AWS Security Blog
Visualizing Amazon GuardDuty findings
September 9, 2021: Amazon Elasticsearch Service has been renamed to Amazon OpenSearch Service. See details.
Amazon GuardDuty is a managed threat detection service that continuously monitors for malicious or unauthorized behavior to help protect your AWS accounts and workloads. Enable GuardDuty and it begins monitoring for:
- Anomalous API activity
- Potentially unauthorized deployments and compromised instances
- Reconnaissance by attackers.
GuardDuty analyzes and processes VPC flow log, AWS CloudTrail event log, and DNS log data sources. You don’t need to manually manage these data sources because the data is automatically leveraged and analyzed when you activate GuardDuty. For example, GuardDuty consumes VPC Flow Log events directly from the VPC Flow Logs feature through an independent and duplicative stream of flow logs. As a result, you don’t incur any operational burden on existing workloads.
GuardDuty helps find potential threats in your AWS environment by producing security findings that you can view in the GuardDuty console or consume through Amazon CloudWatch Events, which is a service that makes alerts actionable and easier to integrate into existing event management and workflow systems. One common question we hear from customers is “how do I visualize these findings to generate meaningful insights?” In this post, we’re going to show you how to create a dashboard that includes visualizations like this:
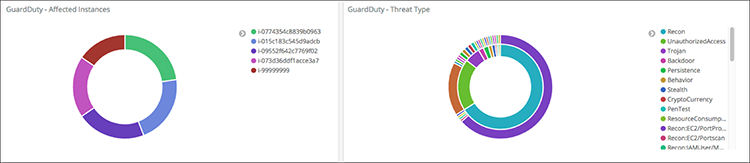
Figure 1: Example visualization
You’ll learn how you can use AWS services to create a pipeline for your GuardDuty findings so you can log and visualize them. The services include:
- Amazon Kinesis Data Firehose. This service provides a way to load streaming data into data stores and analytics tools at any scale.
- Amazon CloudWatch Events. This delivers a near-real-time stream of system events that describe changes in AWS resources.
- Amazon Simple Notification Service. This is a web service that coordinates and manages the publishing of messages to subscribing endpoints or clients.
- Amazon Simple Storage Service (Amazon S3). This service delivers a highly available object store.
- Amazon Elasticsearch Service. This service makes it easy to create a domain and deploy, operate, and scale Elasticsearch clusters in the AWS Cloud.
- Elasticsearch is a popular open-source search and analytics engine for use cases such as log analytics, real-time application monitoring, and clickstream analytics.
- Kibana is a popular open source visualization tool designed to work with Elasticsearch.
- Amazon Cognito provides authentication services to offer user name and password protection for Kibana.
Architecture
The architectural diagram below illustrates the pipeline we’ll create.
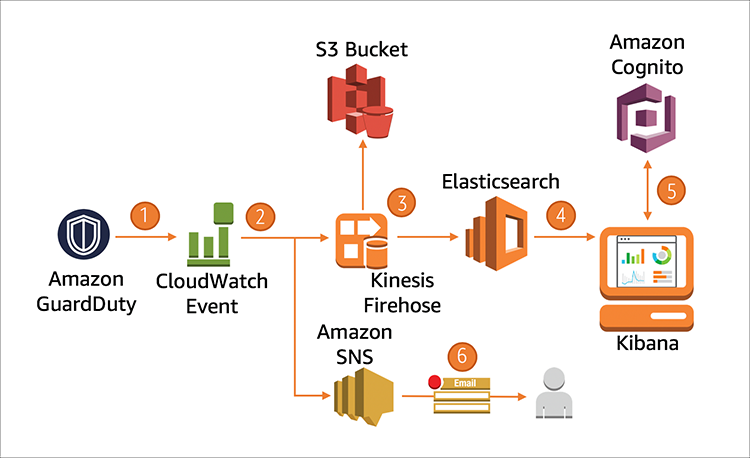
Figure 2: Architectural diagram
We’ll walk through the data flow to explain the architecture and highlight the additional customizations available to you.
- Amazon GuardDuty is enabled in an account and begins monitoring CloudTrail logs, VPC flow logs, and DNS query logs. If a threat is detected, GuardDuty forwards a finding to CloudWatch Events. For a newly generated finding, GuardDuty sends a notification based on its CloudWatch event within 5 minutes of the finding. CloudWatch Events allows you to send upstream notifications to various services filtered on your configured event patterns. We’ll configure an event pattern that only forwards events coming from the GuardDuty service.
- We define two targets in our CloudWatch Event Rule. The first target is a Kinesis Firehose stream for delivery into an Elasticsearch domain and an S3 bucket. The second target is an SNS Topic for Email/SMS notification of findings. We’ll send all findings to our targets; however, you can filter and format the findings you send by using a Lambda function (or by event pattern matching with a CloudWatch Event Rule). For example, you could send only high-severity alarms (that is, findings with detail.severity > 7).
- The Firehose stream delivers findings to Amazon Elasticsearch, which provides visualization and analysis for our event findings. The stream also delivers findings to an S3 bucket. The S3 bucket is used for long term archiving. This data can augment your data lake and you can use services such as Amazon Athena to perform advanced analytics.
- We’ll search, explore, and visualize the GuardDuty findings using Kibana and the Elasticsearch query Domain Specific Language (DSL) to gain valuable insights. Amazon Elasticsearch has a built-in Kibana plugin to visualize the data and perform operational analyses.
- To provide a simplified and secure authentication method, we provide user authentication to Kibana with Amazon Cognito User Pools. This method provides improved security from traditional IP whitelists or proxy infrastructure.
- Our second CloudWatch Event target is SNS, which has subscribed email endpoint(s) that allow your operations teams to receive email (or SMS messages) when a new GuardDuty Event is received.
If you would like to centralize your findings from multiple regions into a single S3 bucket, you can adapt this pipeline. You would deploy the frontend of the pipeline by configuring Kinesis Firehose in the remote regions to point to the S3 bucket in the centralized region. You can leverage prefixes in the Kinesis Firehose configuration to identify the source region. For example, you would configure a prefix of us-west-1 for events originating from the us-west-1 region. Analytic queries from tools such as Athena can then selectively target the desired region.
Deployment Steps
This CloudFormation template will install the pipeline and components required for GuardDuty visualization:
![]()
When you start the stack creation process you will be prompted for the following information:
- Stack name — This is the name of the stack you will create
- EmailAddress — This email address is used to create a username in Cognito and a subscriber to the SNS topic.
- ESDomainName — This will be the name given to the Elasticsearch Domain.
- IndexName — This will be the Index created by Firehose to load data into Elasticsearch.
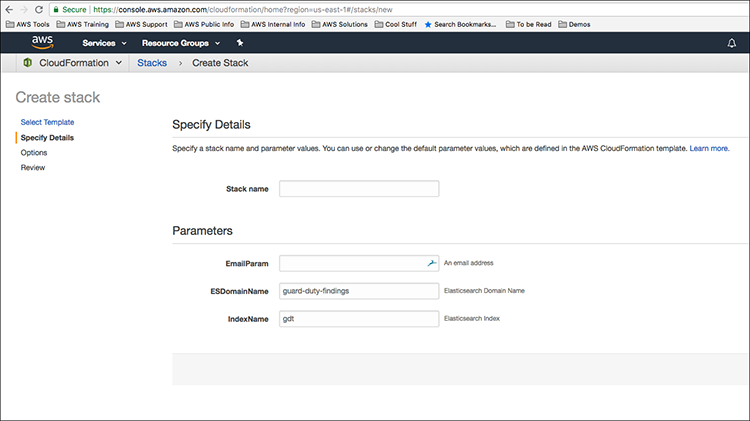
Figure 3: The “Create stack” interface
Once the infrastructure is installed, you’ll follow two main steps, each of which is described in detail later:
- Add Cognito authentication to Kibana, which is hosted on the Elasticsearch domain. At the time of writing, this can’t be done natively in CloudFormation. We’ll also confirm the SNS subscription so we can start to receive GuardDuty Findings via email.
- Configure Kibana with the index, the appropriate scripted fields, and the dashboard to provide the visualizations. We’ll also enable GuardDuty to start monitoring your account and send sample findings to test the pipeline.
Step 1: Enable Cognito authentication in Kibana
To enable user authentication to your dashboards hosted in Kibana, you need to enable the integration from the Elasticsearch domain that was created within the Cloudformation template.
- Open the AWS Console and select the Cognito service. Select Manage User Pools to access the User Pool that was created in Cloudformation. Select the user pool beginning with the name VisualizeGuardDutyUserPool and, under the App Integration menu item, select Domain name.

Figure 4: The “Domain name” interface
- You need to create a unique domain prefix to allow Kibana to authenticate using Cognito. Enter a unique domain prefix (it can only contain lowercase letters, numbers, and hyphens). After entering the prefix, select the Check Availability button to ensure it’s available in the region. If it’s available, select Save Changes button.
- From the AWS Console, select the Cloudformation service.
- Select the template you created for your pipeline, select the Outputs tab, and then, under Value, copy the value of ESCognitoRole. You’ll use this role when you enable Cognito authentication of Elasticsearch.

Figure 5: The “Outputs” tab and the “ESCognitoRole” key
- Next, browse to the Elasticsearch Service, select the domain you created from the CloudFormation template, and select the Configure cluster button:

Figure 6: The “Configure cluster” button
- Under the Kibana authentication section, select the Enable Amazon Cognito for authentication checkbox. You’ll be presented with several fields you need to configure, including: Cognito User Pool (the name of the user pool should start with VisualizeGuardDutyUserPool), Cognito Identity Pool (the name of the identity pool should start with VisualizeGuardDutyIDPool), and IAM Role Name (this was copied in step 4 earlier). A Cognito User Pool is a user directory in Amazon Cognito, we use this to create a user account to provide authentication to Kibana. Amazon Cognito Identity Pools (federated identities) enable you to create unique identities for your users and federate them with identity providers. The Cognito Identity Pool in our case is used to provide federated access to Kibana. After you provided values for these fields, select the Submit button.

Figure 7: The “Kibana authentication” interface
- The cluster reconfiguration will take several minutes to complete processing. When you see Domain status as Active, you can proceed.
- Finally, confirm the subscription email you received from SNS. Look for an email from: AWS Notifications <no-reply@sns.amazonaws.com>, open the message and select Confirm subscription to allow SNS to send you email when the SNS Topic receives a notification for new GuardDuty findings.
Step 2: Set up the Kibana dashboard and enable GuardDuty
Now, you can set up the Kibana dashboard with custom visualizations.
- Open the CloudFormation service page and select the stack you created earlier.
- Under the Outputs section, copy the Kibana URL.

Figure 8: Copy the Kibana URL
- Paste the Kibana URL in a new browser window.
- Check your email client. You should have an email containing the temporary password from Cognito. Copy the temporary password and use it to log in to Cognito. If you haven’t received the email, check your email junk folder. You can also create additional users in the Cognito User Pool that was created from the CloudFormation Stack to provide additional users Kibana access.

Figure 9: Example email with temporary password
- At the login prompt, enter the email address and password for the Cognito user the CloudFormation template created. A prompt to change your password will appear. Change your password to proceed. The Cognito User Pool requires: upper case letters, lower case letters, special characters, and numbers with a minimum length of 8 characters.
- It’s time to add mapping information to your index to instruct Kibana that some of the fields are delivered as geopoints. This allows these fields to be properly visualized with a Coordinate Map. Select Dev Tools in the menu on the left side:
- Paste the following API call in the text box to provide the appropriate mappings for the networkConnectionAction & portProbeAction geolocation field. This calls the Elasticsearch API and updates the geolocation mapping for the above fields:
- After you paste the API call be sure to remove whitespace after the ending brace. This allows you to select the green arrow to execute it. You should receive a message that the call was successful.

Figure 11: Paste the API call
- Next, enable GuardDuty and send sample findings so you can create the Kibana Dashboard with data present. Find the GuardDuty service in the AWS Console and select the Get started button.
- From the Welcome to GuardDuty page, select the Enable GuardDuty button.
- Next, send some sample events. From the GuardDuty service, select the Settings menu on the left-hand menu, and then select Generate sample findings as shown here:

Figure 12: The “Generate sample findings” button
- Optionally, if you want to test with real GuardDuty findings, you can leverage the Amazon GuardDuty Tester. This AWS CloudFormation template creates an isolated environment with a bastion host, a tester EC2 instance, and two target EC2 instances to simulate five types of common attacks that GuardDuty is built to detect and notify you with generated findings. Once deployed, you would use the tester EC2 instance to execute a shell script to generate GuardDuty findings. Additional detail about this option can be found in the GuardDuty documentation.
- On the Kibana landing page, in the menu on the left side, create the Index by selecting Management.
- On the Management page, select Index Patterns.
- On the Create index pattern page, under Index patterns, enter gdt-* (if you used a different IndexName in the Cloudformation template, use that here), and then select Next Step.
Note: It takes several minutes for the GuardDuty findings to generate a CloudWatch Event, work through the pipeline, and create the index in Elasticsearch. If the index doesn’t appear initially, please wait a few minutes and try again.

Figure 13: The “Create index pattern” page
- Under Time Filter field name, select time from the drop-down list, and then select Create index pattern.

Figure 14: The “Time Filter field name” list
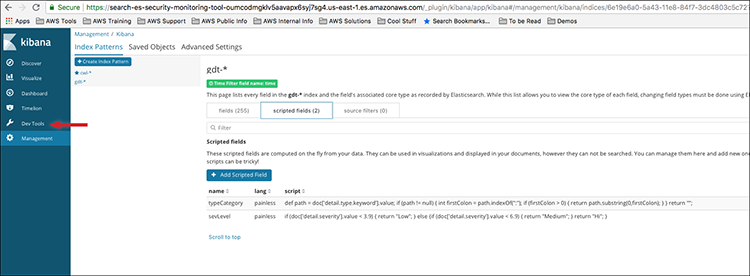
Figure 10: Select “Dev tools”
Create scripted fields
With the Index defined, we will now create two scripted fields that your dashboard visualizations will use.
Define the severity level
- Select the Index you just created, and then select scripted fields.
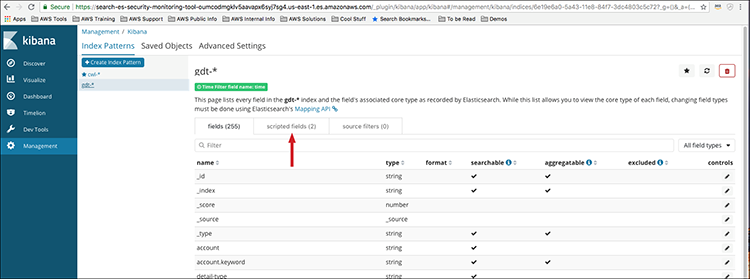
Figure 15: The “scripted fields” tab
- Select Add Scripted Field, and enter the following information:
- Name — sevLevel
- Language — painless
- Type — String
- Format (Default: String) — -default-
- Popularity — (leave at default of 0)
- Script — copy and paste this script into the text-entry field:
- After entering the information, select Create Field.
The sevLevel field provides a value-to-level mapping as defined by GuardDuty Severity Levels. This allows you to visualize the severity levels in a more user-friendly format (High, Medium, and Low) instead of a cryptic numerical value. To generate sevLevel, we used Kibana painless scripting, which allows custom field creation.
Define the attack type
- Now create a second scripted field for typeCategory. The typeCategory field extracts the finding attack type. Enter the following information:
- Name — typeCategory
- Language — painless
- Type — String
- Format (Default: String) — -default-
- Popularity — (leave at default of 0)
- Script — Copy and paste this script into the text-entry field:
- After entering the information, select Create Field.
The typeCategory field is used to define the broad category “attack type.” The source field (detail.type.keyword) provides a lot of detailed information (for example: Recon:EC2/PortProbeUnprotectedPort), but we want to visualize the category of “attack type” in the high-level dashboard (that is, only Recon). We can still visualize on a more granular level, if necessary.
Create the Kibana Dashboard
- Create the Kibana dashboard by importing a JSON file containing its definition. To do this, download the Kibana dashboard and visualizations definition JSON file from here.
- Select Management in the menu on the left, and then select Saved Objects. On the right, select Import.
- Select the JSON file you downloaded and select Open. This imports the GuardDuty dashboard and visualizations. Select Yes, overwrite all objects.
- In the Index Pattern Conflicts section, under New index pattern, select gdt-*, and then select Confirm all changes.
Dashboard in action
- Select Dashboard in the menu on the left.
- Select the Guard Duty Summary link.
Your GuardDuty Dashboard will look like this:
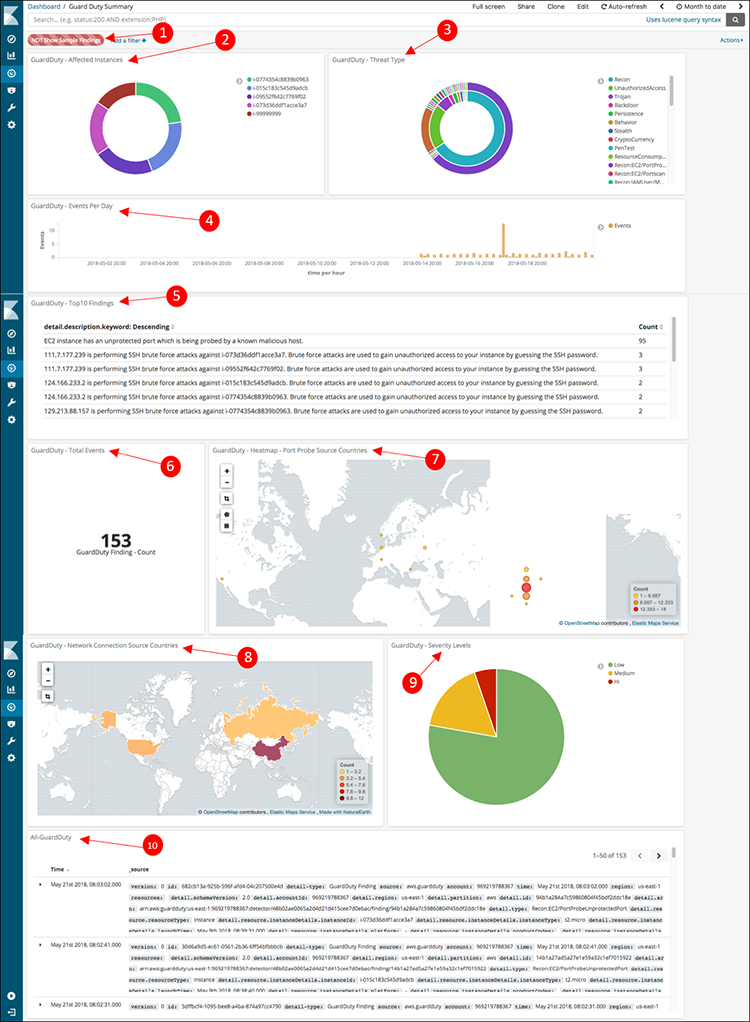
Figure 16: The GuardDuty dashboard
The dashboard provides the following visualizations:
- This filter allows you to filter sample findings from real findings. If you generate sample findings from the GuardDuty AWS console, this filter allows you to remove the sample findings from the dashboard.
- The GuardDuty — Affected Instances chart shows which EC2 instances have associated findings. This visualization allows you to filter specific instances from display by selecting them in the graphic.
- The Guard Duty — Threat Type chart allows you to filter on the general attack type (inner circle) as well as the specific attack type (outer circle).
- The Guard Duty — Events Per Day graph allows you to visualize and filter on a specific time or date to show findings for that specific time, as well as search for temporal patterns in findings.
- GuardDuty — Top10 Findings provides a list of the top 10 findings by count.
- GuardDuty — Total Events provides the total number of events based on the criteria chosen. This value will change based on the filters defined.
- The GuardDuty — Heatmap — Port Probe Source Countries visualizes the countries where port probes are issued from. This is a Coordinate Map visualization that allows you to see the source and volume of the port probes targeting your instances.
- The GuardDuty — Network Connection Source Countries visualizes where brute force attacks are coming from. This is a Region Map visualization that allows you to highlight the country the brute force attacks are sourced from.
- GuardDuty — Severity Levels is a pie chart that show findings by severity levels (High, Med, Low), and you can filter by a specific level (that is, only show high-severity findings). This visualization uses the scripted field we created earlier for simplified visualization.
- The All-GuardDuty table includes the raw findings for all events. This provides complete raw event detail and the ability to filter at very granular levels.
In a previous blog, we saw how you can create a Kibana dashboard to visualize your network security posture by visualizing your VPC flow logs. This GuardDuty dashboard augments that dashboard. You can use a single Elasticsearch cluster to host both of these dashboards, in addition to other data sources you want to analyze and report on.
Conclusion
We’ve outlined an approach to rapidly build a pipeline to help you archive, analyze, and visualize your GuardDuty findings for rapid insight and actionable intelligence. You can extend this solution in a number of ways, including:
- Modifying the alert email sent with a structured message (instead of raw JSON)
- Adding additional visualizations, such as a heatmaps or timeseries charts
- Extending the solution across AWS accounts or regions.
If you have feedback about this blog post, submit comments in the Comments section below. If you have questions about this blog post, start a new thread on the Amazon GuardDuty forum.
Want more AWS Security news? Follow us on Twitter.