AWS News Blog
Announcing Amazon SageMaker Canvas – a Visual, No Code Machine Learning Capability for Business Analysts

|
As an organization facing business problems and dealing with data on a daily basis, the ability to build systems that can predict business outcomes becomes very important. This ability lets you solve problems and move faster by automating slow processes and embedding intelligence in your IT systems.
But how do you make sure that all teams and individual decision makers in the organization are empowered to create these machine learning (ML) systems at scale, and without depending on other data science and data engineering teams? As a business user or data analyst, you’d like to build and use prediction systems based on the data that you analyze and process every day, without having to learn about hundreds of algorithms, training parameters, evaluation metrics, and deployment best practices.
Today, I’m excited to announce the general availability of Amazon SageMaker Canvas, a new visual, no code capability that allows business analysts to build ML models and generate accurate predictions without writing code or requiring ML expertise. Its intuitive user interface lets you browse and access disparate data sources in the cloud or on-premises, combine datasets with the click of a button, train accurate models, and then generate new predictions once new data is available.
SageMaker Canvas leverages the same technology as Amazon SageMaker to automatically clean and combine your data, create hundreds of models under the hood, select the best performing one, and generate new individual or batch predictions. It supports multiple problem types such as binary classification, multi-class classification, numerical regression, and time series forecasting. These problem types let you address business-critical use cases, such as fraud detection, churn reduction, and inventory optimization, without writing a single line of code.
SageMaker Canvas in Action
Imagine that I’m an e-commerce manager who needs to predict whether or not a product will be shipped on time. The datasets at my disposal consist of a product catalog and the historical shipping dataset, both in CSV format.
First, I enter the SageMaker Canvas application where all of my models and datasets are created and inspected.
![]()
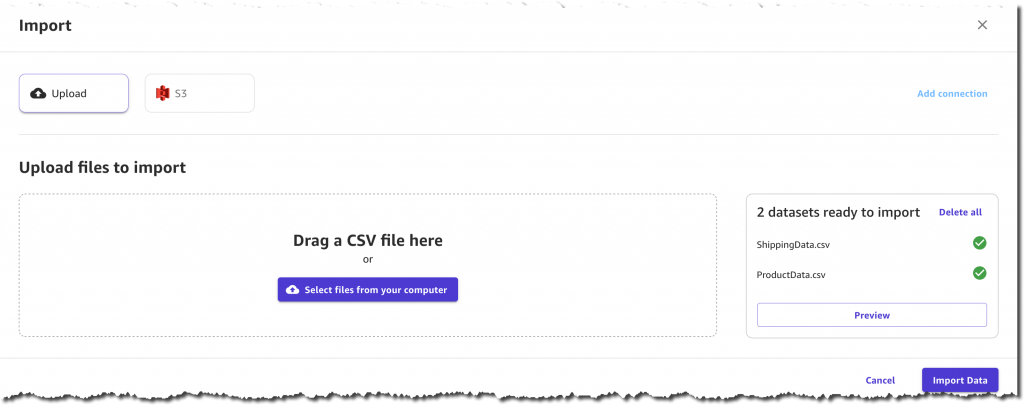
I select Import, and upload two CSV files: ProductData.csv and ShippingData.csv. I have 120 products and 10,000 shipping records.


I could also fetch data from Amazon Simple Storage Service (Amazon S3) or connect to other cloud or on-premises data sources, such as Amazon Redshift or Snowflake. For this use case, I prefer to upload 1.6 MB of data directly from my computer.
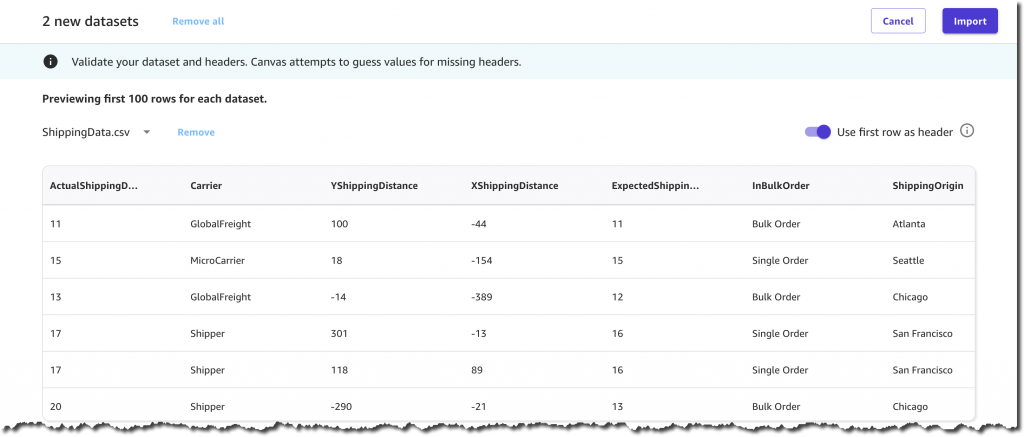
Before confirming the import, I have a chance to preview the two datasets, their columns, and their respective values. For example, each product has a ComputerBrand, ScreenSize, and PackageWeight. In addition to useful columns such as ShippingOrigin, OrderDate, and ShippingPriority, each record in the shipping dataset also contains OnTimeDelivery, which is either On Time or Late. This column will be used by SageMaker Canvas to generate a prediction model based on historical data.
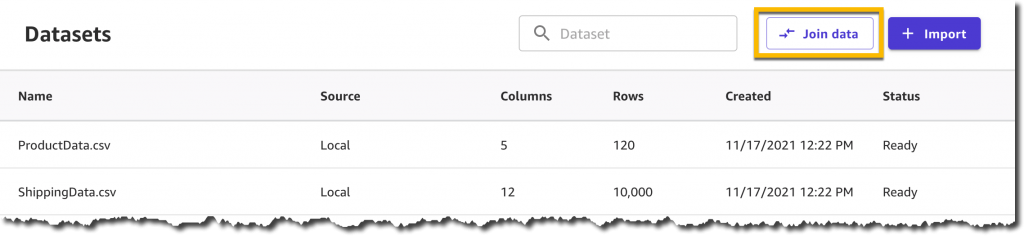
After a few seconds of processing, the datasets are ready, and I decide to join them to create a single dataset containing both product and shipping information. This is an optional step that often lets you increase the precision of a prediction model.
Now I can simply drag and drop the two datasets: SageMaker Canvas will automatically identify the shared ProductId column and apply an Inner Join transformation.
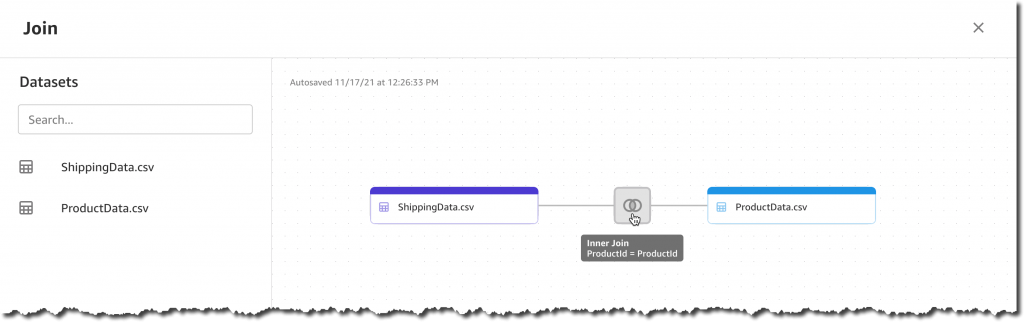
The join preview lets me visualize the resulting columns, identify missing or invalid values, and optionally deselect unwanted columns.

I select Save joined data and provide a new name for this joined dataset, which now includes 16 columns and 10,000 records.
Next, I want to create a model and start by selecting New model in the Models section on the left menu. I call it On Time Prediction Model.
The first step is selecting a dataset.
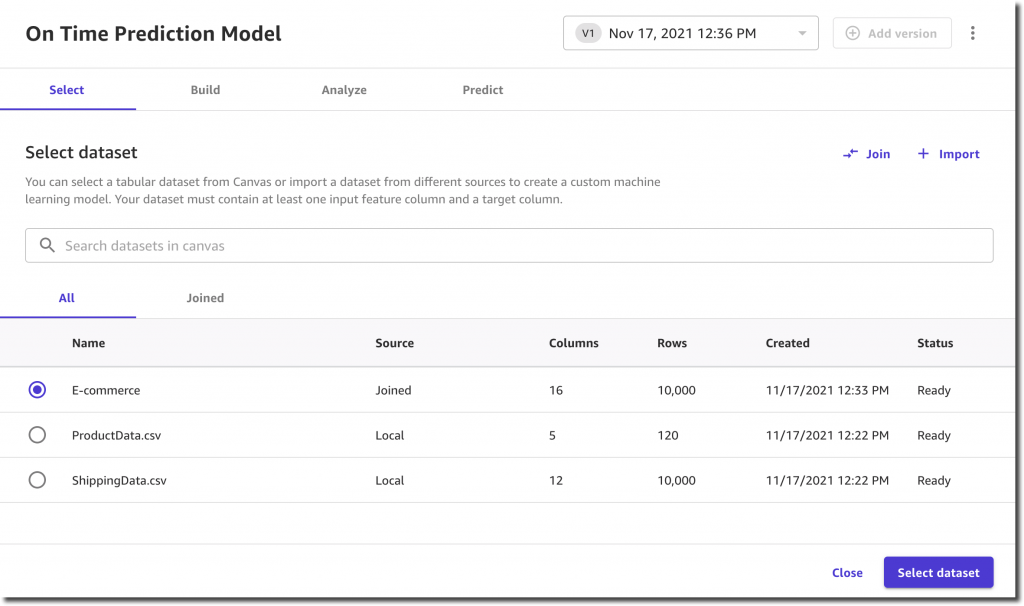
I select a target column that my model will predict: OnTimeDelivery.
SageMaker Canvas shows me the value distribution and already recommends the most appropriate model type: two categories classification.

Before proceeding with the model training, I have the option to generate an analysis report. This analysis gives me two very important pieces of information: the estimated accuracy and the impact of each column.

The estimated accuracy of 99.9% gives me confidence, but then I notice that the highest impact is provided by the ActualShippingDays column. Unfortunately, this column is not available in advance and I can’t use it for my predictions. So I deselect it and run the analysis again.

The new estimated accuracy is 94.2%, which is still pretty high. The most impactful columns are ShippingPriority, YShippingDistance, XShippingDistance, and Carrier. This is great because all of this information is available in advance and can be used for a prediction. On the other hand, product-related columns, such PackageWeight and ScreenSize, have very small impacts on the prediction. This means that in the future I could simplify the overall process by feeding only shipping information into the training and prediction phases.
I’m happy with the analysis insights. Therefore, I decide to proceed and build a prediction model by selecting the Standard build option.
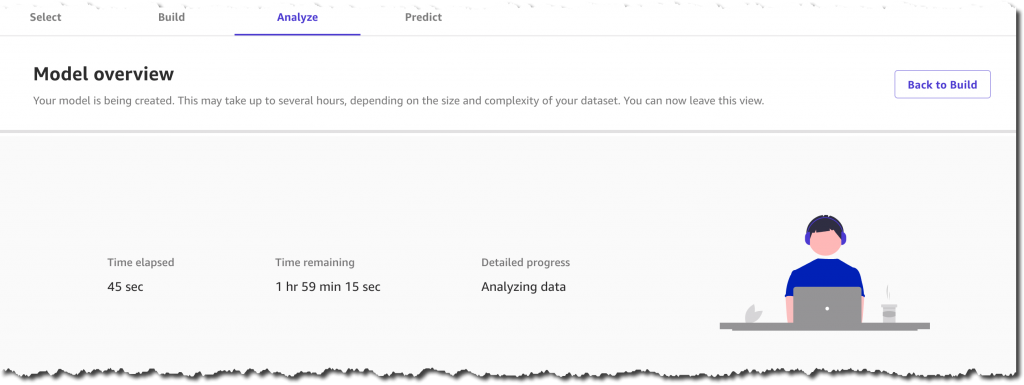
Now I can go for a walk, attend a few productive meetings, or simply spend some time with family. SageMaker Canvas is doing all of the work for me, training hundreds of models behind the scenes. It will select the best performing one, so that I can start generating accurate predictions in a couple of hours. Of course, the training duration will vary depending on the dataset size and problem type.
After about an hour and a half, the model is ready and the console lets me analyze its accuracy and the column impacts visually. I’m also happy to see that the model predicts the correct value 94.2% of the time, which corresponds to the estimated accuracy.
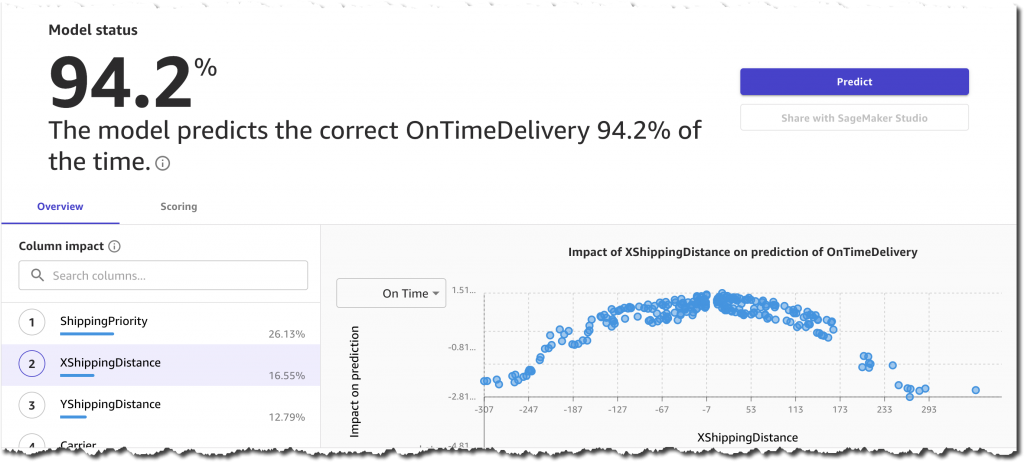
Optionally, I could also inspect advanced metrics such as Precision, Recall, F1 Score, and so on. These metrics help me understand how the model is performing and what kind of false positives and false negatives I can expect from this model.

From here, I could share the model into Amazon SageMaker Studio or continue using the Canvas UI to generate new predictions.
I decide to continue with the intuitive UI and select Predict. Now I can work with individual records or with a dataset for batch predictions.
When selecting Single prediction, SageMaker Canvas simplifies my life and lets me start from an existing record. I modify the column values and get immediate feedback on the prediction and the corresponding feature importance.

This quick feedback loop and intuitive UI allows me to use the ML model without having to write custom code. In case I decide to integrate the model into an automated production system, the Amazon SageMaker Studio integration lets me share the model easily with other data scientists in my team.
Generally Available Today
SageMaker Canvas is generally available in US East (Ohio), US East (N. Virginia), US West (Oregon), Europe (Frankfurt), and Europe (Ireland). You can start using it with your local datasets, as well as data already stored on Amazon S3, Amazon Redshift, or Snowflake. With just a few clicks, you’ll prepare and join your datasets, analyze estimated accuracy, verify which columns are impactful, train the best performing model, and generate new individual or batch predictions. We’re excited to hear your feedback and help you solve even more business problems with ML.
Check out the new SageMaker Canvas documentation here.
— Alex