- AWS Solutions Library
- Guidance for Monitoring Amazon EKS Workloads Using Amazon Managed Services for Prometheus & Grafana
Guidance for Monitoring Amazon EKS Workloads Using Amazon Managed Services for Prometheus & Grafana
Overview
This Guidance demonstrates how you can configure the AWS Observability Accelerator to collect and visualize metrics, logs, and traces on Amazon Elastic Kubernetes Service (Amazon EKS) clusters. Use it with the AWS Observability Accelerator for Terraform infrastructure as code models to rapidly deploy and operate observability for your AWS environments.
How it works
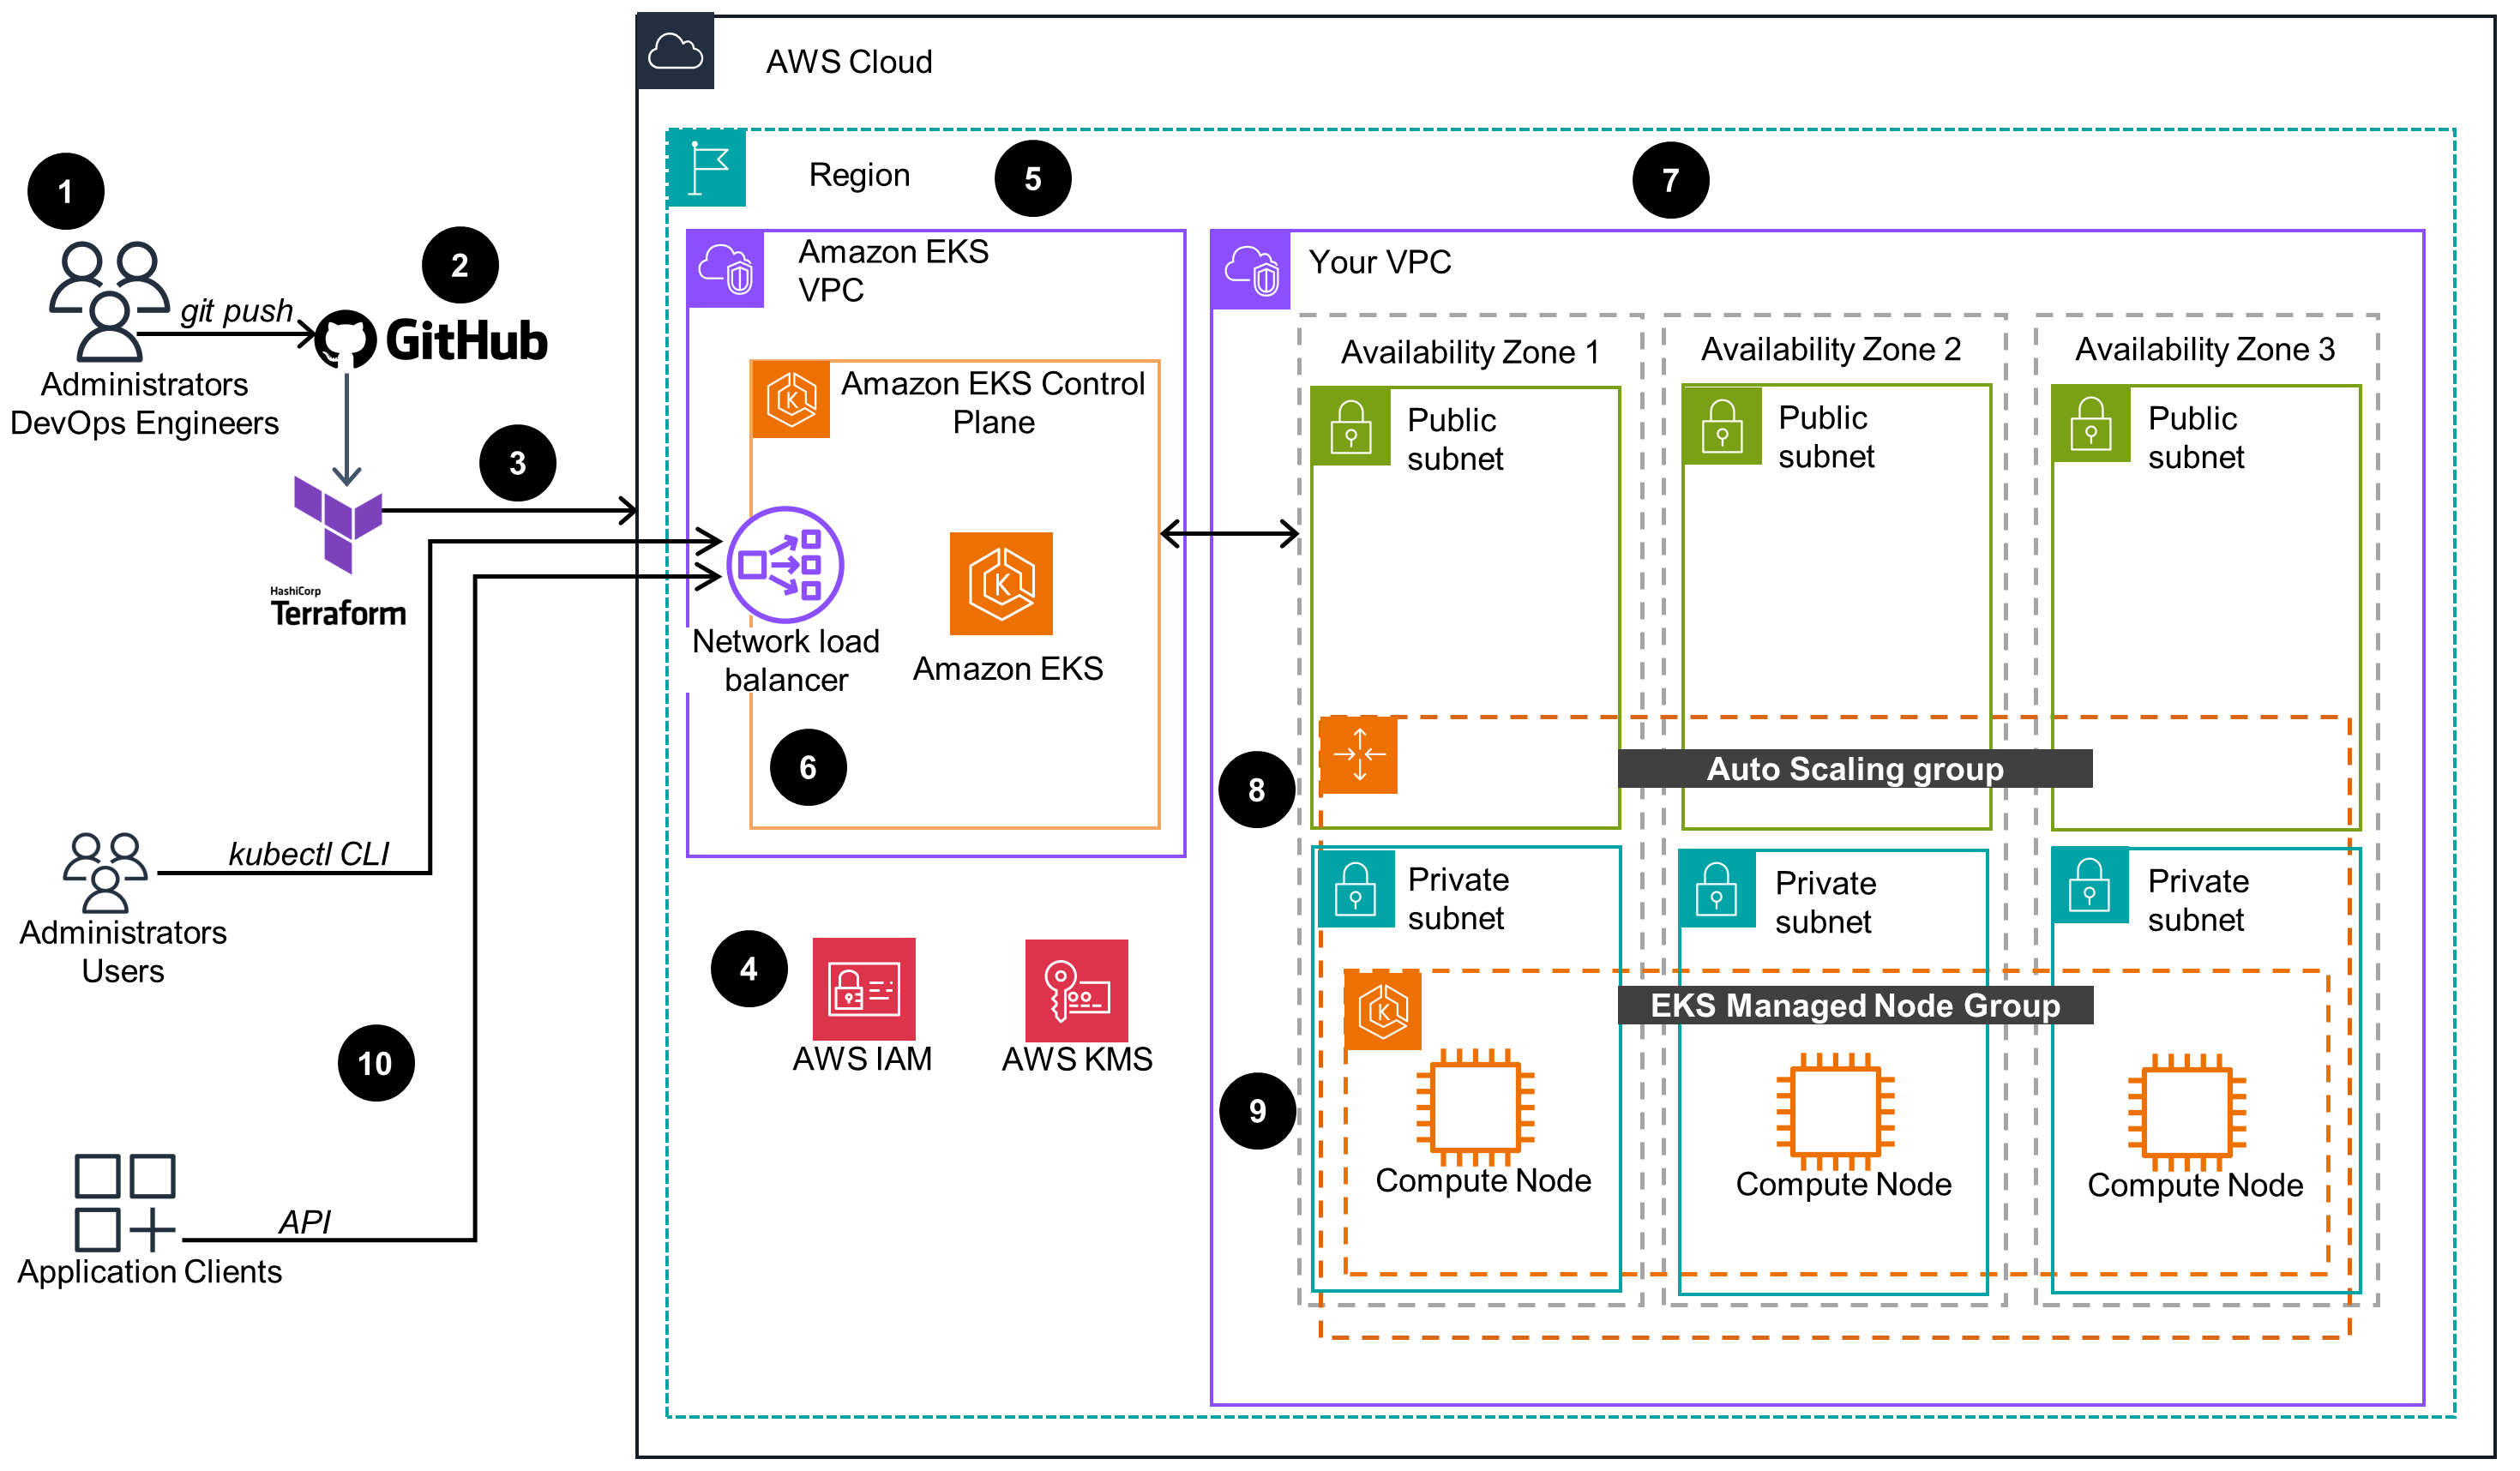
Optional
This architecture diagram demonstrates an Amazon Elastic Kubernetes Service (Amazon EKS) cluster provisioned through an Amazon EKS Blueprint for Terraform.
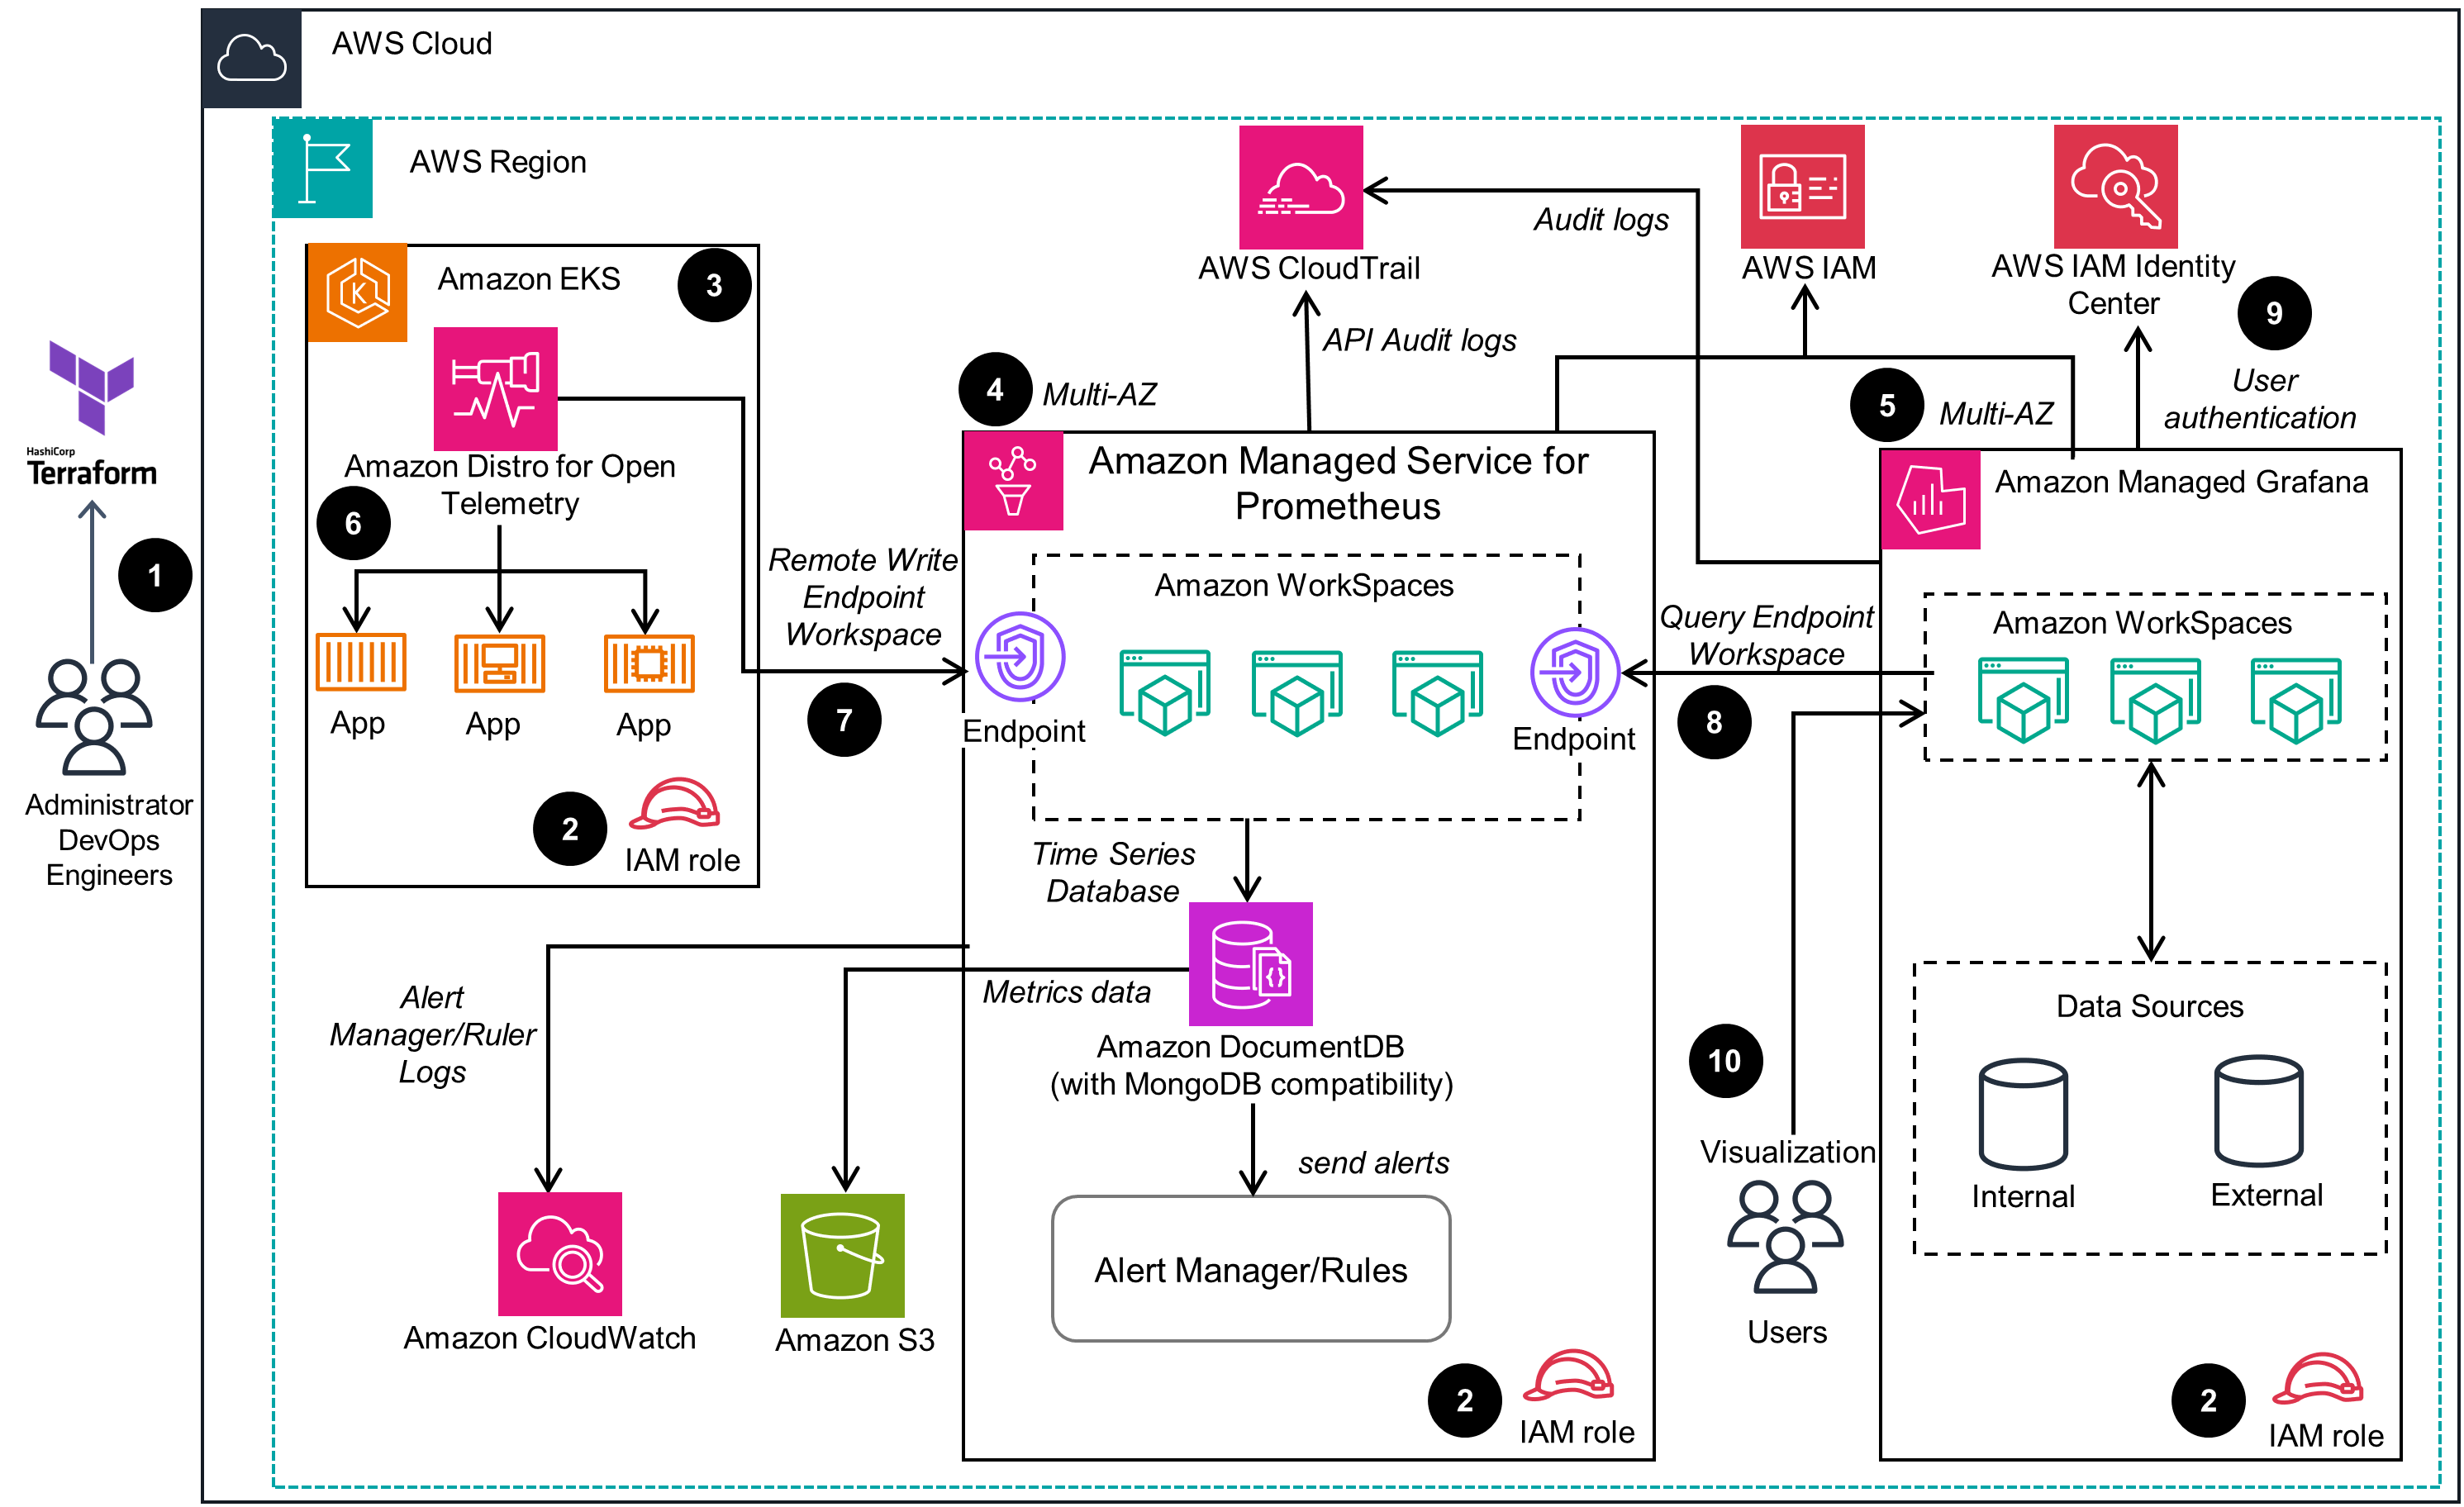
Main Architecture
This architecture demonstrates the deployment of AWS Observability Accelerator on an Amazon Elastic Kubernetes Service (Amazon EKS) cluster.
Well-Architected Pillars
The architecture diagram above is an example of a Solution created with Well-Architected best practices in mind. To be fully Well-Architected, you should follow as many Well-Architected best practices as possible.
This Guidance uses services that offer full observability through monitoring and logging, providing you with reliable, stable, and dependable applications. Cloud Administrators and DevOps team users can review metrics and receive alerts defined in this Guidance to monitor the health of both their infrastructure and cloud workloads.
In the unlikely, yet possible, event of a complete AWS Region outage, the sample code included with this Guidance can be redeployed to another AWS Region with minor changes to the Terraform modules. Because of the highly available configuration of managed services, as well as the Amazon EKS cluster-based components, all resources are managed efficiently. There are related log events that provide insights into AWS resources utilization available to Cloud Administrators and DevOps teams.
Finally, consider reviewing the Implement Feedback Loops document which describes how feedback loops are set up, how they work, and why they are helpful for driving actionable insights that aid in decision making.
The principle of least privilege is applied throughout this Guidance, limiting each resource’s access to only what is required. Amazon EKS clusters are normally deployed in a separate virtual private cloud (VPC) and can be accessed only through protected API endpoints front-ended by load balancers using HTTPS traffic with SSL certificates. Amazon Managed Service for Prometheus endpoints as well as Amazon Managed Grafana workspaces are secured through HTTPS traffic and certificates. Access to the Amazon Managed Grafana user interface is controlled through IAM.
Both Amazon Managed Service for Prometheus and Amazon Managed Grafana are Region-level services which are deployed across different Availability Zones for high availability and reliability. The Amazon EKS components, such as the Amazon Managed Service for Prometheus node exporter and the Distro for OpenTelemetry metrics collector pods, are supported by Kubernetes. With Kubernetes, you get distributed systems built with microservices where reliability is synonymous with stability.
Amazon Managed Service for Prometheus service logs can be enabled with Amazon CloudWatch. Also, log groups for core components deployed into an Amazon EKS cluster get created in CloudWatch and can be used for troubleshooting. Alerts can also be configured based on those metrics and delivered directly to Cloud Administrators or DevOps teams through notification channels, such as Amazon Simple Notification Service (Amazon SNS).
Amazon Managed Service for Prometheus and Amazon Managed Grafana are Amazon native services. This Guidance focuses on performant-efficient ways to deploy and integrate them with selected resources so that you can monitor and improve the efficiency of your Amazon EKS applications with high availability and low operational costs. Further optimization can be performed based on your CPU and memory usage, network traffic, and your input/output operations per second (IOPS).
Automation and scalability are cost-saving features this Guidance utilizes with Terraform and the AWS Management Console respectively. A centralized administration is implemented through the console, the AWS Command Line Interface (AWS CLI), and through the Amazon Managed Grafana console. These features allow for effective detection and correction of issues in both the infrastructure and the application development or deployment processes, reducing the total costs of development efforts.
Amazon Managed Service for Prometheus pricing includes details on what you are charged for metrics ingested and stored. More specifically, we charge for every ingested metric sample and the disk space it uses to store them. Reducing the resolution of time-series data to longer time slices reduces the number of stored metrics and its associated costs.
This Guidance deploys and integrates AWS services and an Amazon EKS cluster running in the AWS Cloud—there is no need to procure any physical hardware. Capacity providers keep virtual “infrastructure” provisioning to a minimum along with the necessary auto-scaling events should the workloads demand it.
Every pod running on the Kubernetes platform, including the Amazon EKS cluster, will consume memory, CPU, I/O, and other resources. This Guidance allows for the fine-grained collection and visualization of these metrics. Cloud Administrators and DevOps engineers can monitor their resource utilization through their own internal metrics and log events, and perform configuration updates when indicated by those metrics to achieve sustainable resource utilization.
Disclaimer
Did you find what you were looking for today?
Let us know so we can improve the quality of the content on our pages